
Against the economists on school spending
Summary of the controversy, evidence, and a bit of meta-science

Some days ago I posted a chart about school spending (per-pupil spending) and math test scores:
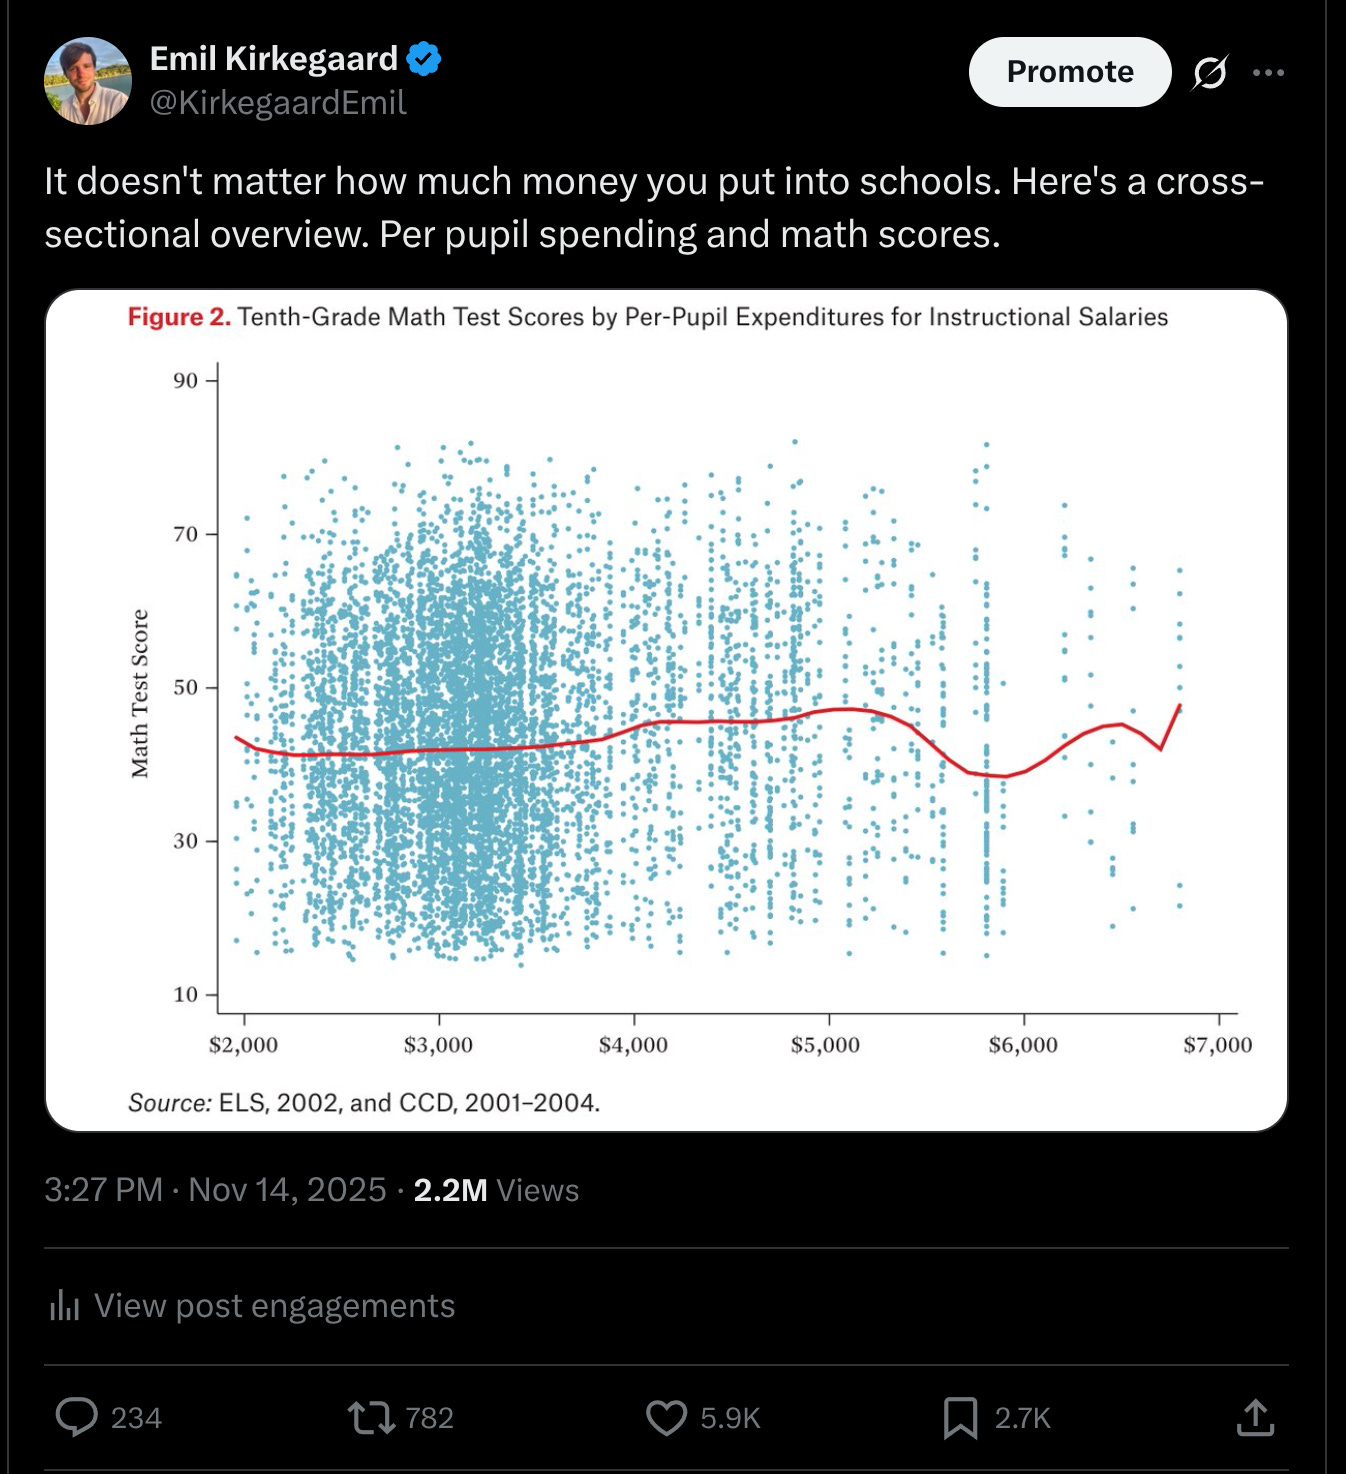
Note how I didn’t say this cross-sectional scatterplot proves anything about causality, but we will get to that later.
It unexpectedly went viral (2.2M views), even though this was just a simple figure from an older relatively unknown study:
Morgan, S. L., & Jung, S. B. (2016). Still no effect of resources, even in the new gilded age?. RSF: The Russell Sage Foundation Journal of the Social Sciences, 2(5), 83-116.
The context was that someone asked me about the famous Coleman report from the 1960s:
Coleman is widely cited in the field of sociology of education. In the 1960s, during his time teaching at Johns Hopkins University, Coleman and several other scholars were commissioned by the National Center for Education Statistics[6] to write a report on educational equality in the US. It was one of the largest studies in history, with more than 650,000 students in the sample. The result was a massive report of over 700 pages. The 1966 report, titled Equality of Educational Opportunity (otherwise known as the “Coleman Report”), fueled debates about “school effects” that are still relevant today.[16] The report is commonly presented as evidence that school funding has little effect on student achievement, a key finding of the report and subsequent research.[17][18][5] It was found as for physical facilities, formal curricula, and other measurable criteria, there was little difference between black and white schools. Also, a significant gap in the achievement scores between black and white children already existed in the first grade. Despite the similar conditions of black and white schools, the gap became even wider by the end of elementary school. The only consistent variable explaining the differences in score within each racial group or ethnic group was the educational and economic attainment of the parents.[19] Therefore, student background and socioeconomic status were found to be more important in determining educational outcomes of a student. Specifically, the key factors were the attitudes toward education of parents and caregivers at home and peers at school. Differences in the quality of schools and teachers did have a small impact on student outcomes.[17][18][5]
In other words, if you regress student achievement scores on school variables, parental variables etc., then school variables don’t account for so much, about 10%. In a simple interpretation, this sets an upper-bound on the importance of their causality but not a lower-bound. Since many people claim that school quality is very important, this was something of a letdown. Decades were then spent trying to disprove this conclusion.
The production of science and academia’s self-interests
Anyway, now it’s time for a brief detour before we look at the responses to my post. Let’s take a step back and think about how the production of evidence works in society. We have institutions that are mostly publicly funded whose job it is to both educate people (for higher end jobs) and to produce evidence about anything. We call this place academia. Now, since those people working in academia have a direct interest, financially and personally, in the evidence showing that education works, we have reasonable grounds for suspicion of their work. Think about research published by Big Tobacco about the health effects of cigarettes. Do you think maybe this evidence would be biased in regards to reality? What about research published by Big [your personal bogeyman] about [their economic interests]? Big Oil about dangers of oil spills and global warming? Big Chemistry about the safety of their pesticides? Big Pharma and their drugs? If you don’t think these organizations and their researchers might bias the evidence in their own favor, then I don’t know what to tell you. But if you do, then do you think Big Education (AKA academia) would be similarly inclined to generally produce evidence that favors their own interests? If not, why not? Let’s assume you agree to some extent. Society has a problem. Someone must be delegated the task of finding out what is true and what is not so we can all make wiser decisions. It makes sense that the people whose job it is to find out what is true about some domain are the same people educating the future people who work in those domains. How could it be any other way? It does however create this unhealthy incentive and a positive feedback loop where no matter how effective education is, the very people who produce the evidence concerning the effects of education are the people who stand to benefit from more money spent on education. This is a fundamental problem with science which means that research will be systematically biased in more of more education. Granted, it may still be that education is actually good, but we simply end up overestimating how good it is. However, it can also be that more education at some point (speaking broadly) is actually bad because the gains are illusory and the costs are very real.
The responses
With that in mind, let’s look at some of the evidence economists posted in reply to my post. First, we have a post by economist Arin Dube:
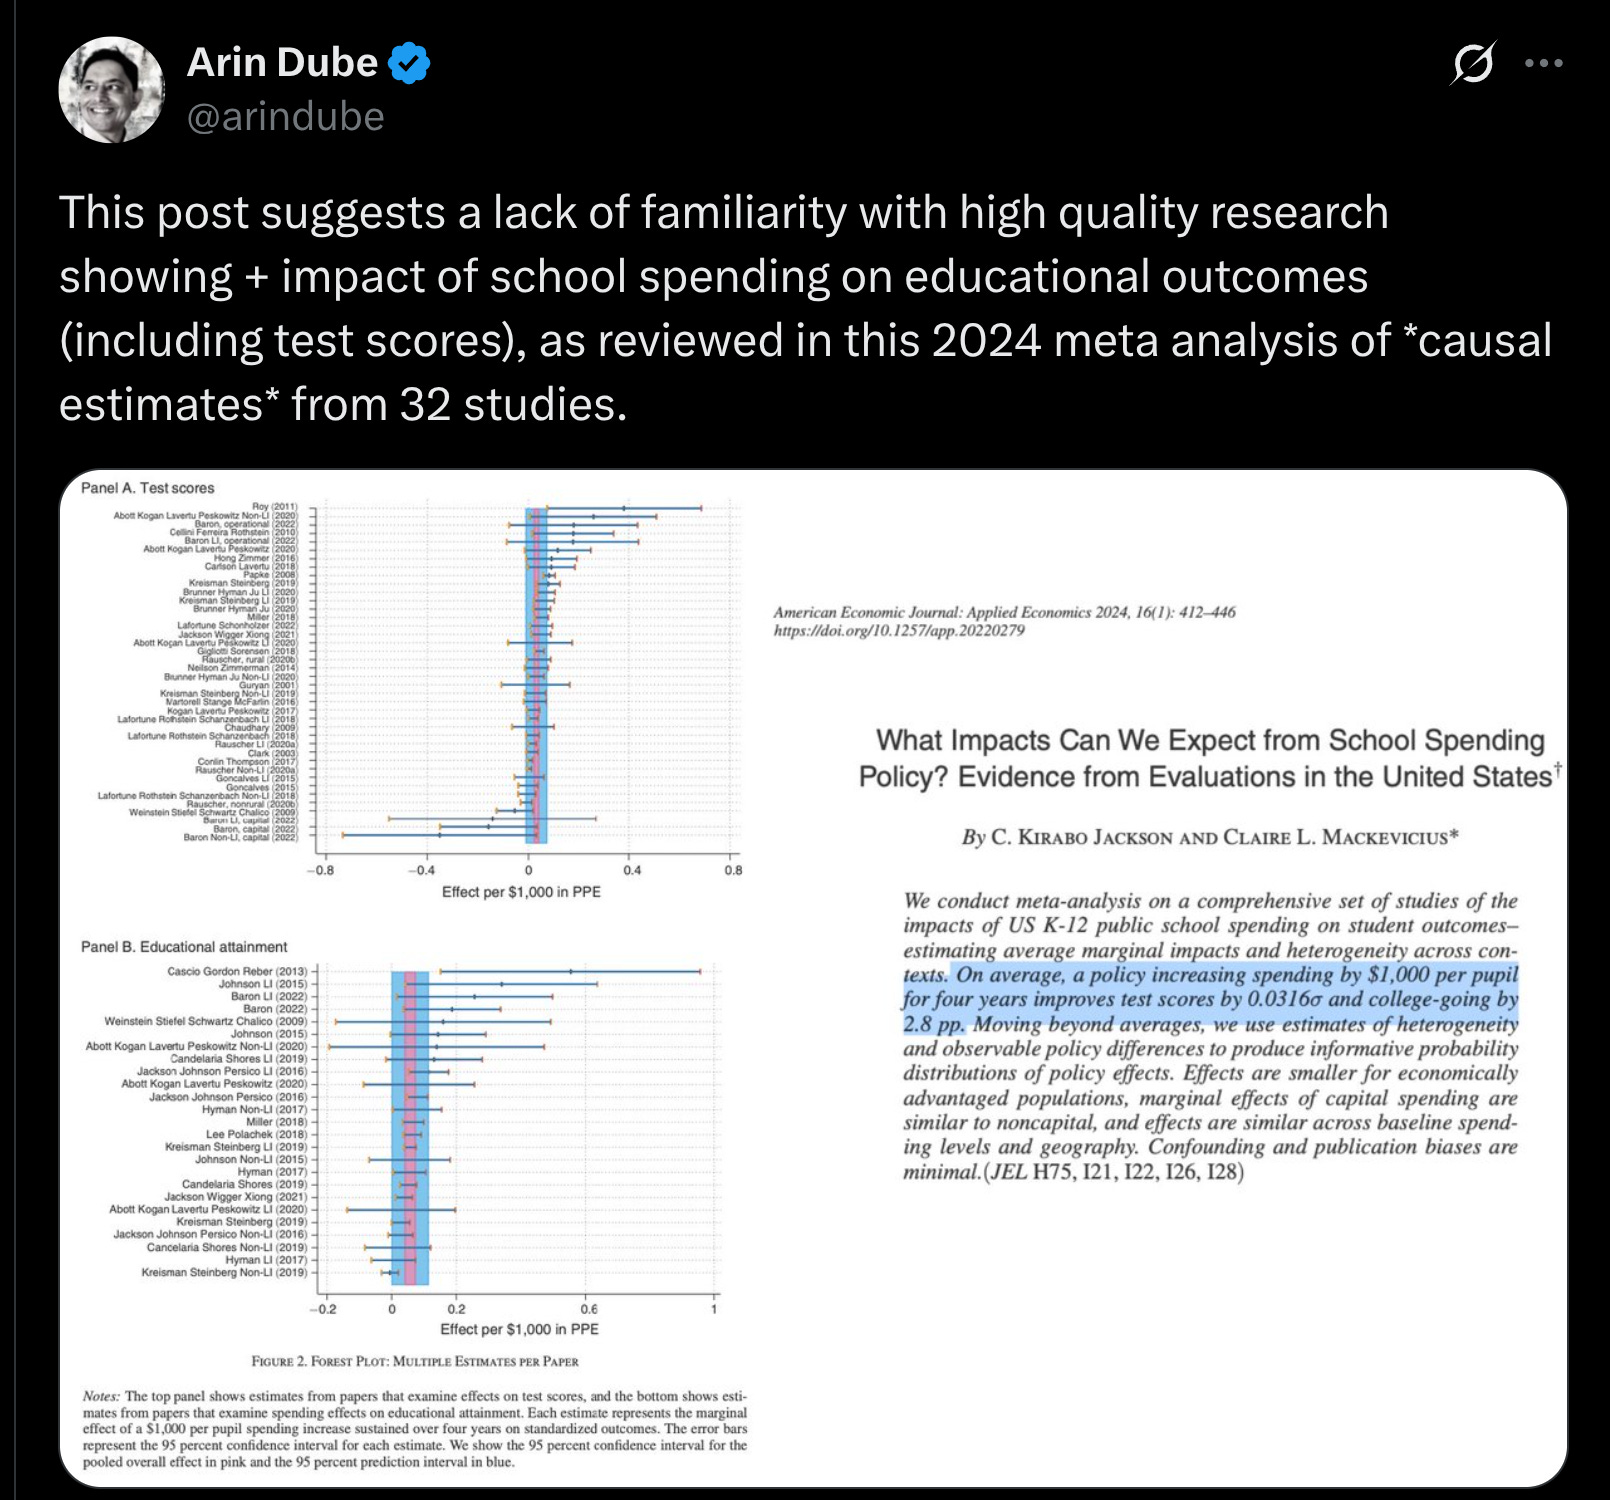
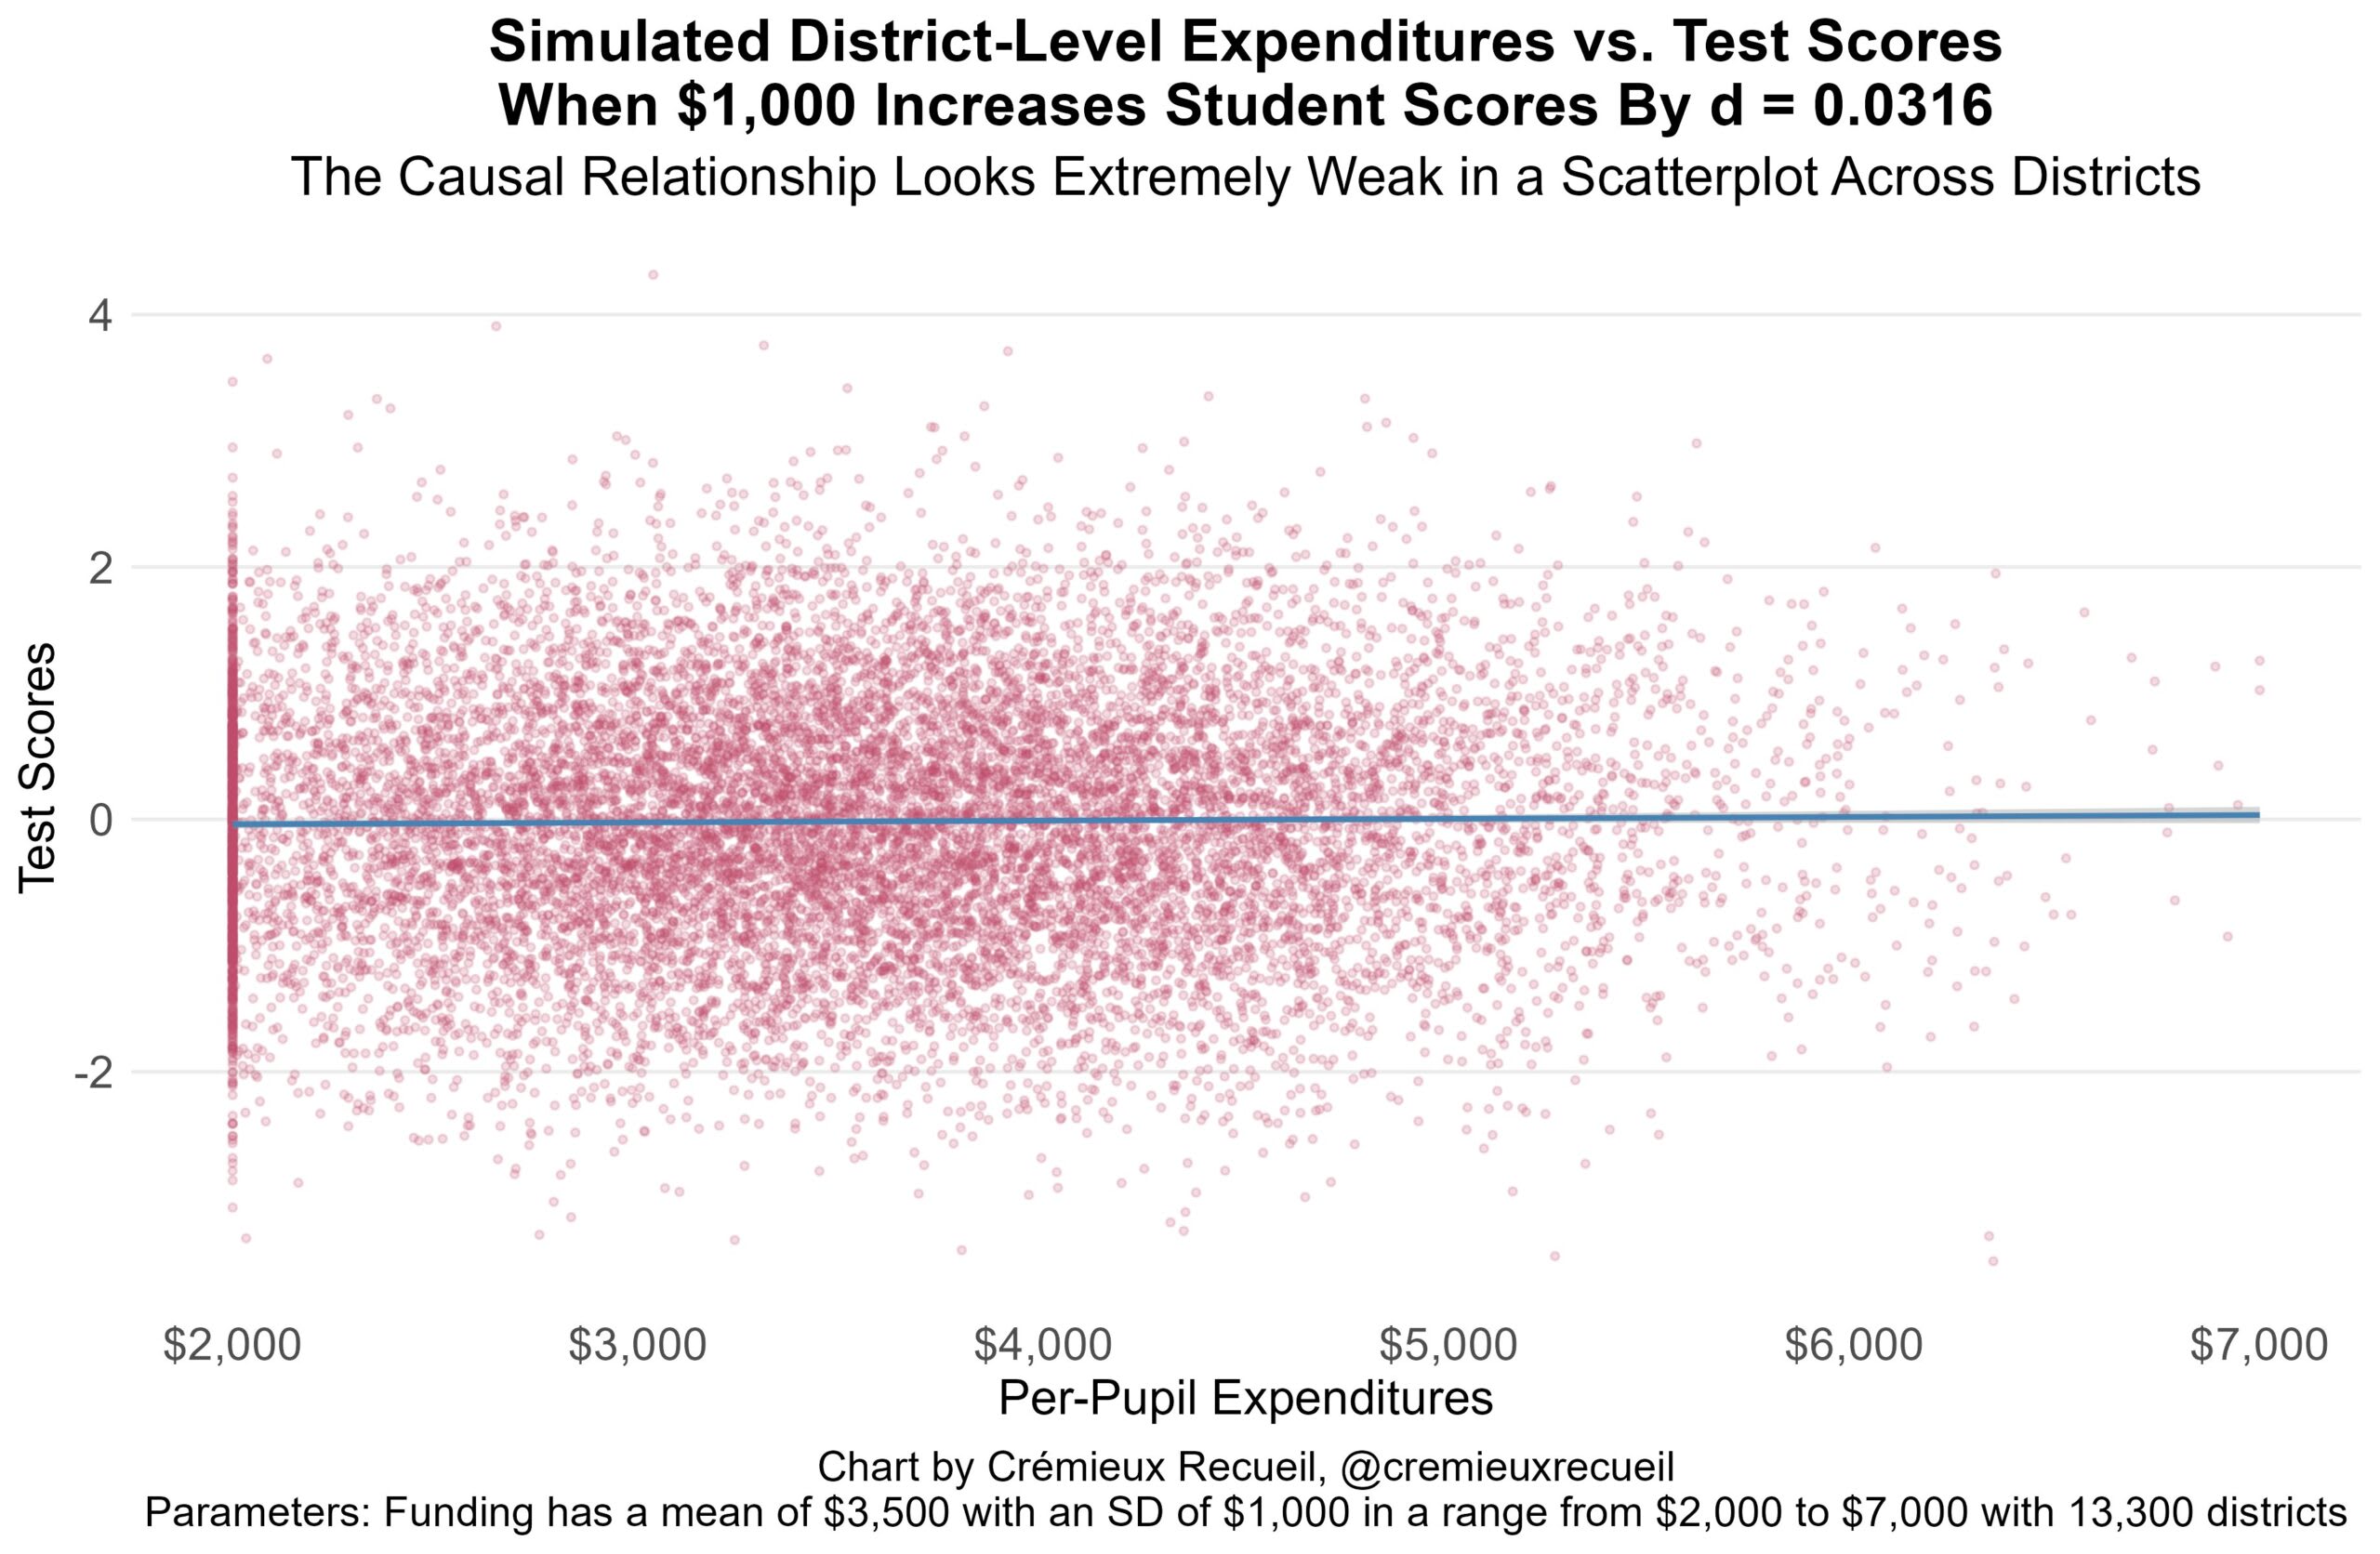
He posts a meta-analysis (Jackson & Mackevicius 2024) of educational spending and the estimated effects form the economic literature. He seemingly thinks this is good evidence, but looking at the forest plots we can see that it is quite terrible. The top plot (about test scores) shows that the average effect size is roughly 0, 0.03 to be specific. The more imprecise studies are more likely to produce positive results (more studies in the top than bottom). Even a tiny amount of bias in the included studies could cause the overall effect size to be slightly misestimated from 0 to 0.03 (or some other nearby value). The bottom plot is even worse, with almost all imprecise (smaller sample) studies in the top, typical of publication bias/p-hacking. In any case, if we accept the effect size claimed, Cremieux was kind enough to plot what this would look like:
Philippe Lemoine provides apt commentary:
I think a good way to think about what is driving people’s reactions here is the following thought experiment. Imagine that a meta-analysis had found that a rise in the share of immigrants in a school district of 1 percentage point resulted in a 0.03 SD reduction of test scores.
You could make the same arguments, mutatis mutandis, that people are making in this case about how maybe a 0.03SD effect size is actually a big deal, but we all know that if anyone used that result to argue that immigration has a really bad effect on educational outcomes in destination countries economists would (rightly) mock him.
More importantly, however, is how we think about any such effects if real, Lemoine again:
But even assuming it’s real, which frankly is a generous assumption (apparently only 3 papers even estimated the effect on college enrollment and most of the studies that were used to estimate the effect on college enrollment were actually about high-school graduation), it’s not clear that we should care about it because the fact that money doesn’t seem to have a practically significant effect on test scores raise questions about the mechanism. For instance, we could imagine that money helps increase college enrollment because it allows schools to hire someone to help students apply to college, but if their test scores are left mostly unchanged it’s not clear that it would increase their college graduation rate or future earnings.
Let’s imagine the typical real-life scenario. Some activist is unhappy that poor Black kids in some area are not doing as well as the middle class White kids. So they lobby and eventually sue the government for civil rights something or another. In some cases, they win the lawsuit, and an activist judge orders the local government to spend more money on the poor Black kids. The schools there now get an inflow of cash and some hints about what to do (make lines go up). They of course hire some consultants who are supposed to know how to do this and more teachers etc. They set target goals, say, 80% graduate high school, and they work hard with remedial education for those who weren’t doing well. Some of these kids can be pressed through with enough time and money and now graduate high school. The school counselors then press them to apply for colleges. At the colleges they will benefit from the next round of egalitarian intervention (affirmative action of various types) and be more likely to be accepted despite a poor high school record and test scores. Some of them will even graduate college, probably with poor grades and degrees at relatively bad colleges. But hey, they do look good on paper. In fact, some of these will get jobs based on their degrees because degrees work by credentialist signaling. Will they make better workers though (and be healthier)? Ultimately, that is the only thing we care about as a society. It is the hard (primary) end-point, as they say in medicine, everything else is a proxy. If we spend more money to make some people gain more income because they do better educational signaling, this doesn’t help society make more money because it erodes the signaling value of education by the same amount, so everybody else’s degrees are slightly worse as signals, and the mean income is unchanged from this intervention (if the intervention was free that is). Unfortunately, measuring actual job performance is very hard, so we mostly don’t and rely on these proxies. Even test scores can be a bad proxy. If we pick some poorly performing students in 3rd grade, and give them extra hours with teachers, they will likely improve their grades and test scores. However, if we stop doing this, then 4 years later, their grades are probably back to the expected level due to regression towards the mean. The problem is that boosting performance in a particular school topic does not necessarily improve the main trait that predicts future performance, namely general intelligence. To put it more pithily, improving the 3rd grade math skills of an 80 IQ child for a few years until these dissipate (how did fractions work again?) is not likely to improve their life outcomes. This is the general problem with intervention studies: their effects are temporary and don’t effect the key underlying trait.
Moving on, another study I was sent is Lafortune et al 2018, who is one of the studies concerning achievement scores and finance reforms. If you look back at the meta-analysis figure above, you can see this study produce essentially a bunch of 0 findings. Their main table is this:
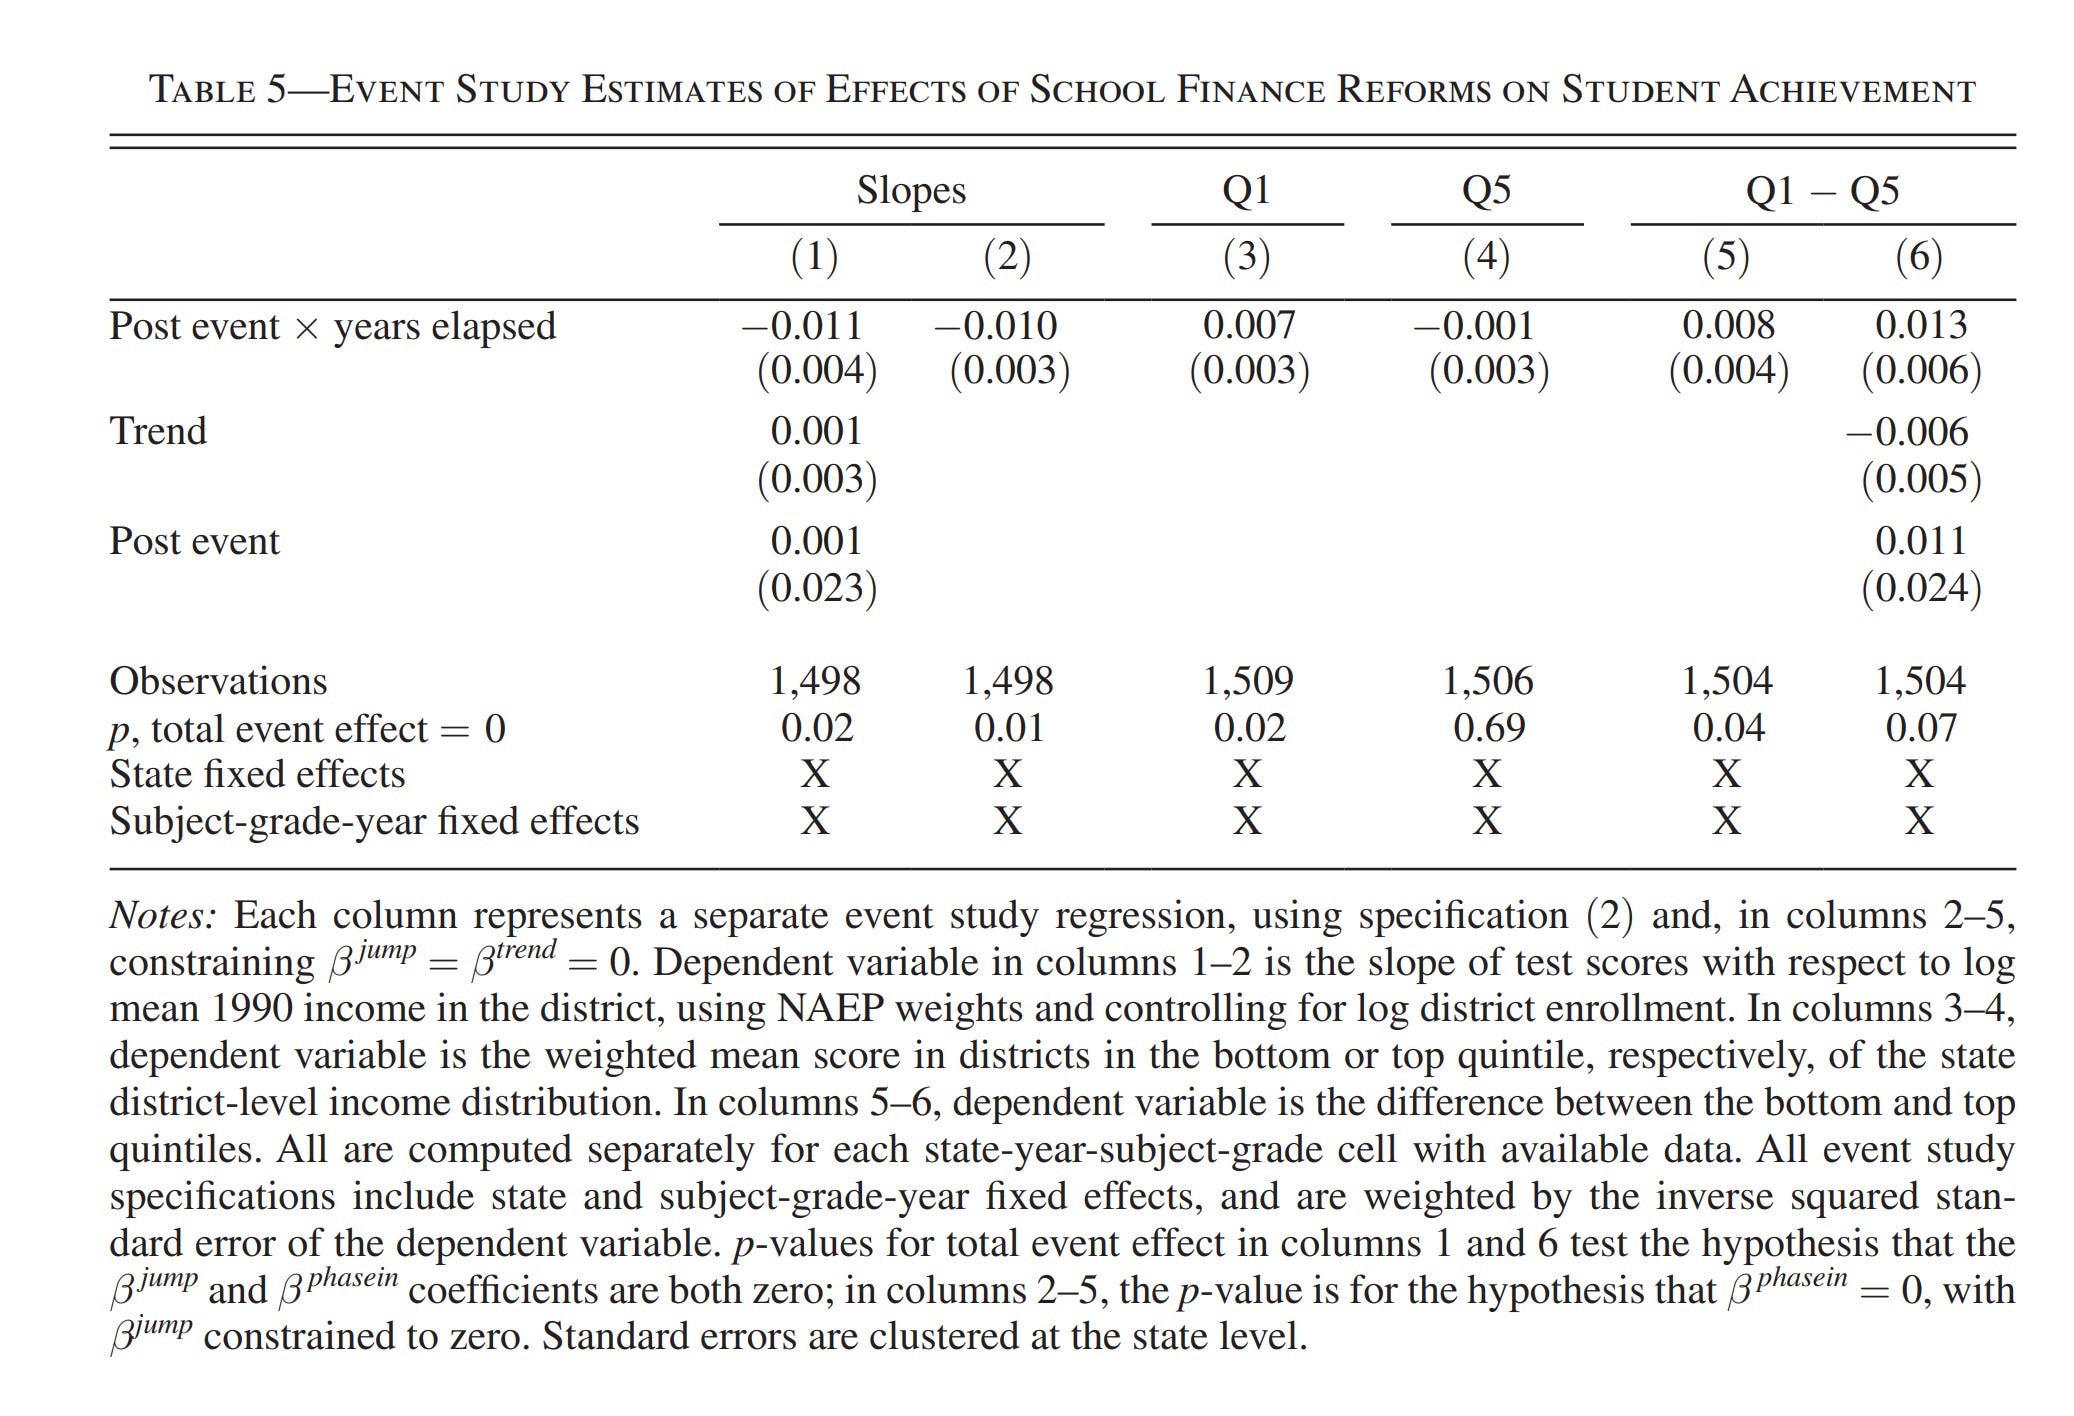
Look at the p-values: 0.02, 0.01, 0.02, 0.69, 0.04, 0.07. This study started with millions of observations, and aggregated the data into ~1500 units, and these are the best p-values they could get. This doesn’t exactly inspire confidence. Rather, from a Bayesian perspective, it suggests the true finding is ~0 since such weak p-values are unlikely given a true effect.
What about correlation and causation?:
There were a number of these “AHA Gotcha” posts, but we’ll go with Fransico’s here. The problem here is that while correlation between X and Y does not imply causation from X to Y (or Y to X), it does imply that there is causation somewhere (chance relationships aside). However, what about the reverse, does no correlation of X and Y imply lack of causation? Not really. One can imagine various thermostat-like causal patterns that cause X and Y to be uncorrelated despite a causal relationship. However, in general, causation makes correlation very likely, and thus lack of correlation also makes causation unlikely. That’s why every attempt at proving causation for something or another started with observations that some times tend to go together and figure out why that is.
The crown jewel of the evidence offered by various economists (and one even sent me this in a DM to make sure I saw it) is the study by Jackson et al 2016. This paper is a behemoth running 96 pages. Unlike the other studies, it doesn’t have any obvious blunders that I could see, but I am not an economist. Nevertheless, there is room for doubt. To see why, let’s explain the study.
Jackson et al 2016 used various court decisions to change school funding in various districts the last many decades. Since court decisions are sort of randomly imposed (we can maybe assume), then variation in funding that is due to such court orders is plausibly random in origin and can be used to estimate causal effects. They specifically note the problems with using ‘natural’ existing variation:
Our emphasis on using only exogenous variation in spending is motivated by the observation that simply comparing outcomes of students exposed to more or less school spending, even within the same district, could lead to biased estimates of the effects of school spending if there were other factors that affect both outcomes and school spending simultaneously. For example, a decline in the local economy could depress school spending (through home prices or tax rates) and have deleterious effects on student outcomes through mechanisms unrelated to school spending, such as parental income. This would result in a spurious positive correlation between per pupil spending and child outcomes. Conversely, an inflow of low-income, special needs, or English-language learner students could lead to an inflow of compensatory state or federal funding while simultaneously generating reduced student outcomes. This would lead to a spurious negative relationship between spending and student outcomes.
This is a thermostat-like relationship, which can cause correlations (and cross-sectional analysis in general) to become uncorrelated even if there is actual positive causation. Their paper is basically arguing that this is the case. They produce a large number of figures like this one:
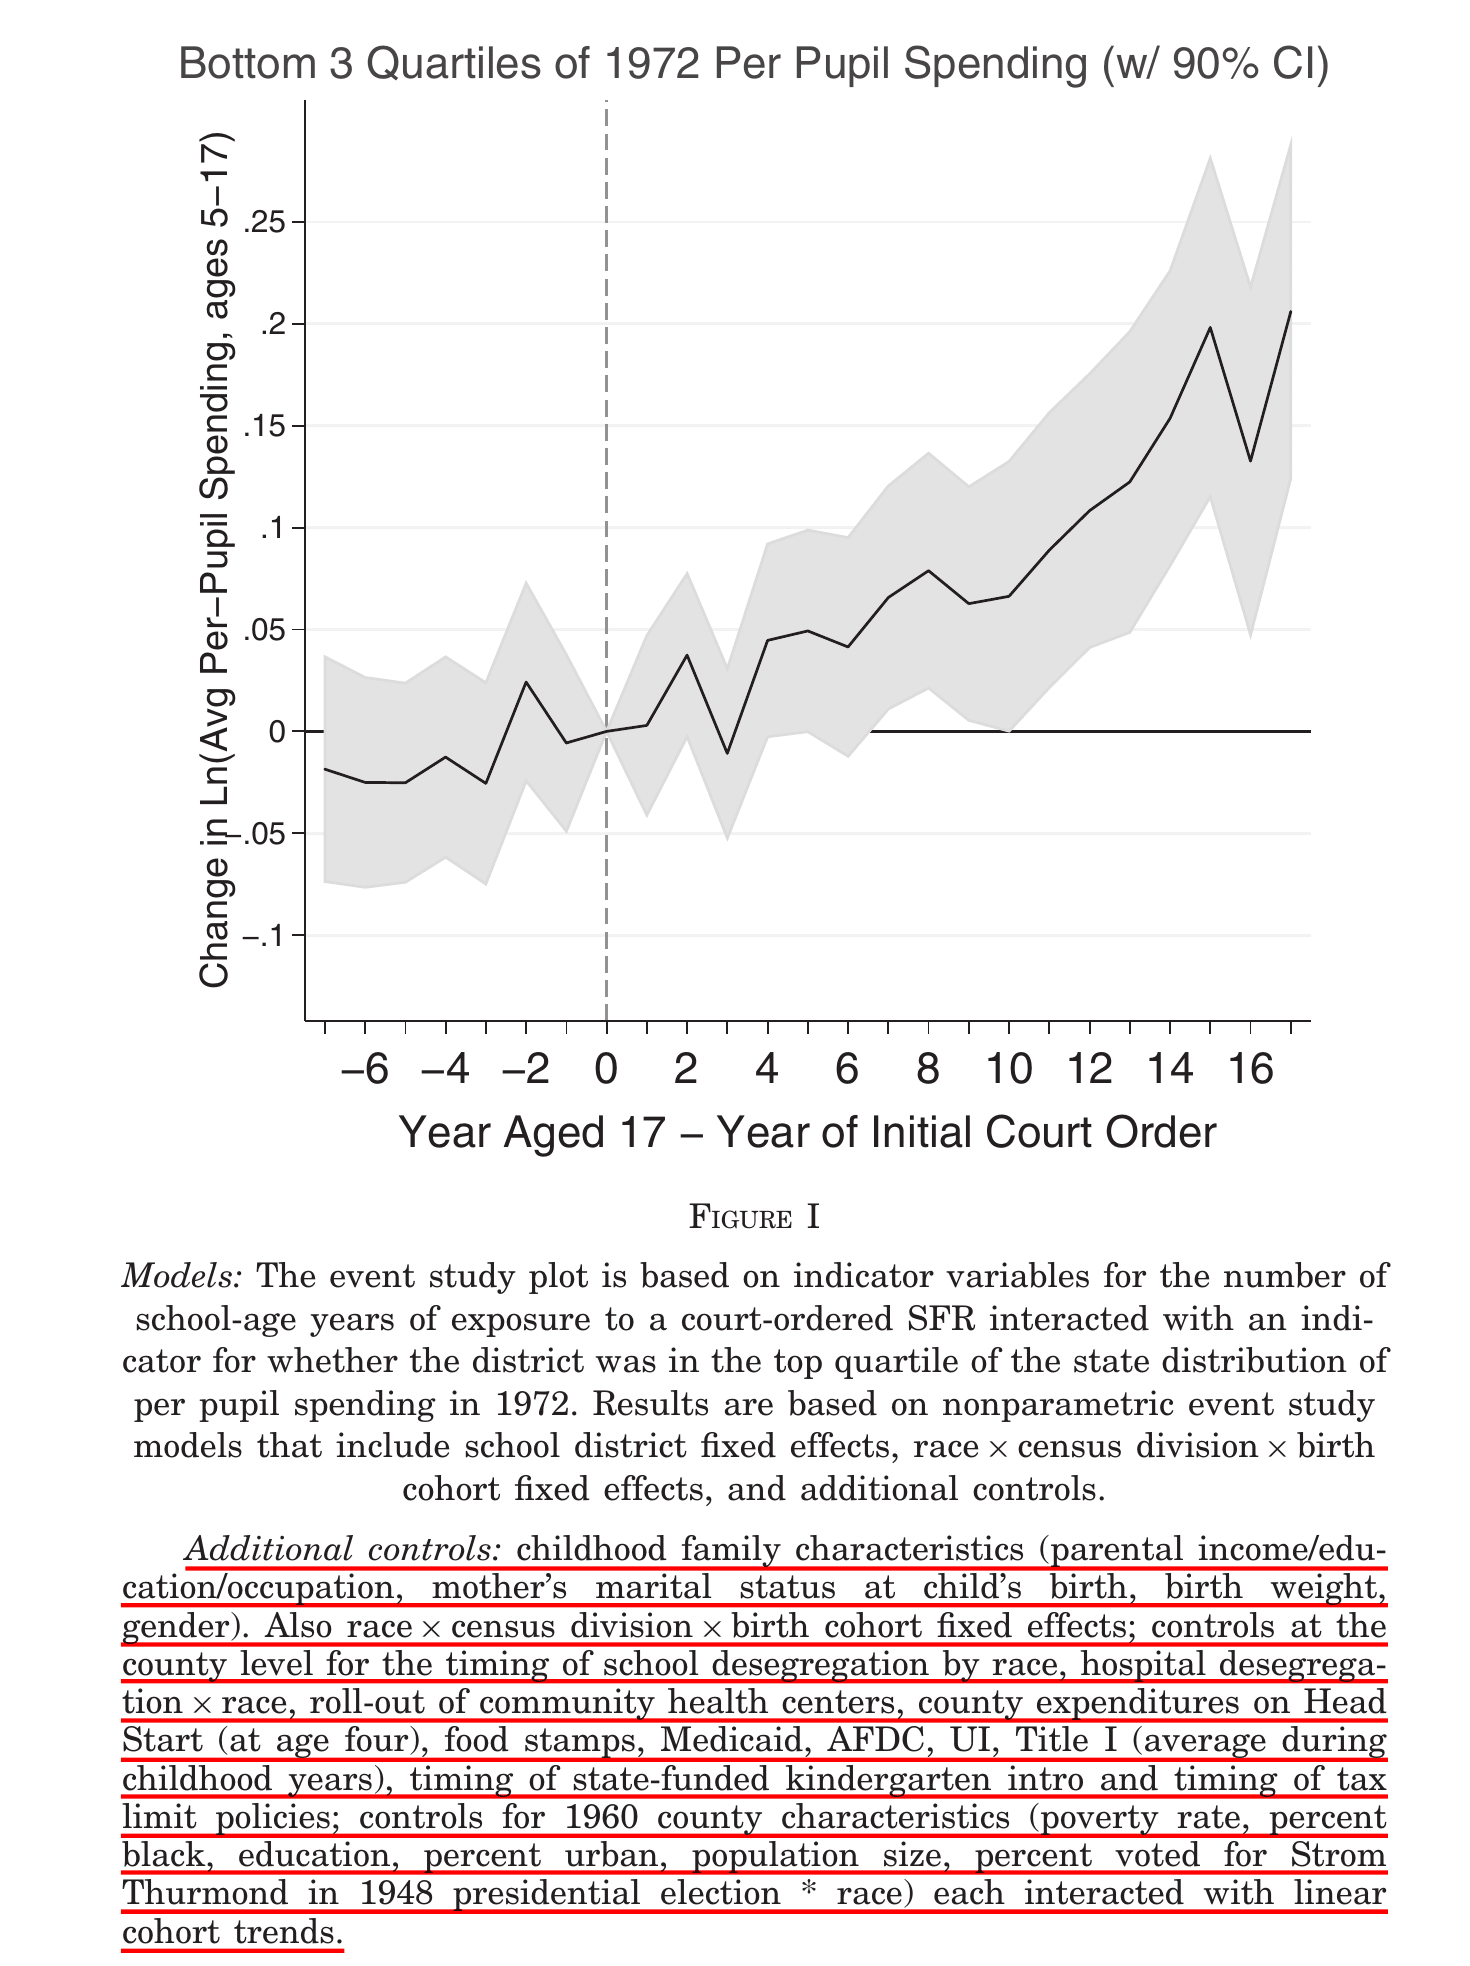
This figure is just one of their checks that funding actually went up in the bottom 75% of schools funding-wise. However, note their list of control variables. It’s a crazy list. As far as I can tell, they don’t present results without such an extreme list of controls. And probably no one is going to reanalyze these particular data to see if other sets of controls would change the results, so no one knows, except maybe the authors. The highlights my first general complaint: the study is extremely complicated and any number of things could have gone wrong, and there is no way for the reader to tell. We already know from prior research that when many teams of researchers are told to analyze the same dataset for the same outcome, they come to wildly different conclusions. As I wrote on X regarding general philosophy of science:
I think the main lesson here is to trust mostly p hacked and opaque economist papers a lot less than much simpler forms of evidence. If there’s a good signal, you don’t need complex methods to find it. RCTs of educational interventions almost always produce null effects.
It is meant as a reference to the metallic laws of economics (read Gwern’s page), which are:
The Iron Law of Evaluation: “The expected value of any net impact assessment of any large scale social program is zero.”
The Stainless Steel Law of Evaluation: “The better designed the impact assessment of a social program, the more likely is the resulting estimate of net impact to be zero.”
The Brass Law of Evaluation: “The more social programs are designed to change individuals, the more likely the net impact of the program will be zero.”
The Zinc Law of Evaluation: “Only those programs that are likely to fail are evaluated.”
In this case, we are dealing with the Stainless Steel law. Ask yourself, what would you trust more? 1) A large randomized controlled trial, or 2) some economists who did complex methods you don’t understand on semi-random data? Of course the randomized trials are to be preferred because they are harder to screw up. As a matter of fact, here is the distribution of large randomized trials of educational interventions that were tested by 3rd parties with planned analyses:
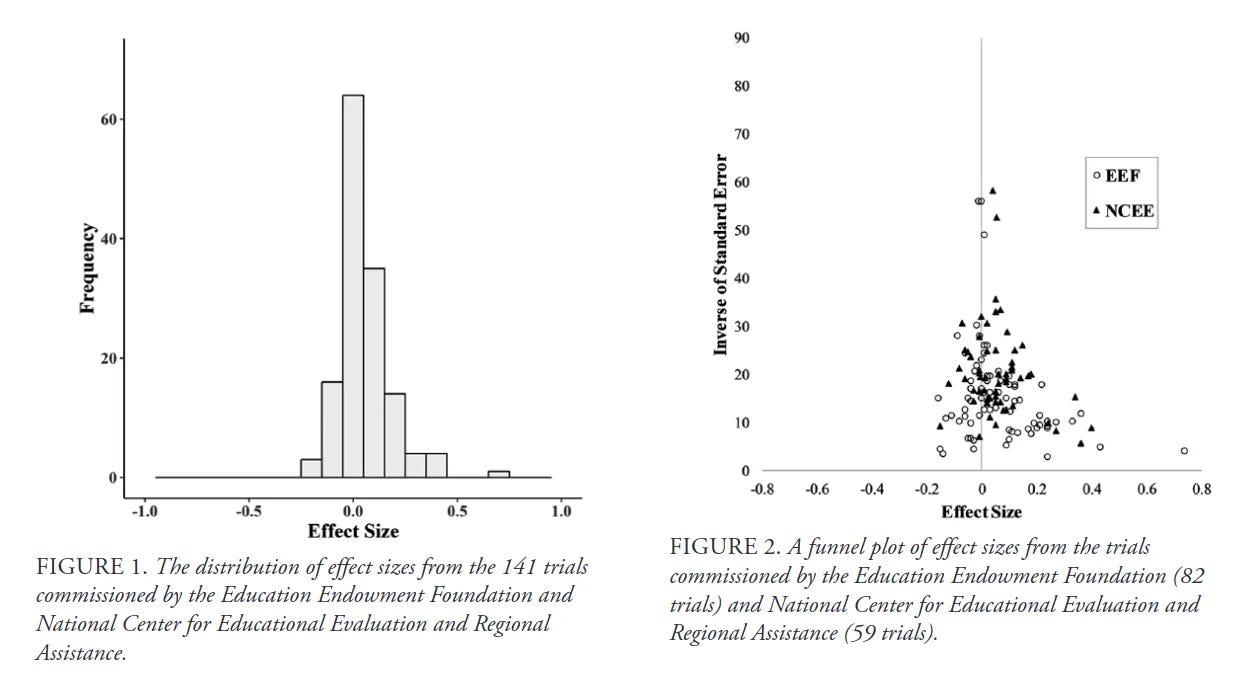
The average effect size is 0.06 d, or just about nothing. And these were interventions that were deemed plausible enough to test rigorously! There is in fact also an economist randomized controlled trial, called the STAR study (Tennessee 1985, 11,000 students). Chetty et al 2010 analyzed this trial to look for the potential long-term benefits:
As a reference, in column 1 of Table 5, we estimate (1) with the first observed test score (in the year of entry) as the outcome. Consistent with Krueger (1999), we find that students assigned to small classes score 4.8 percentile points higher on tests in the year they enter a participating school. Note that the average student assigned to a small class spent 2.27 years in a small class, while those assigned to a large class spent 0.13 years in a small class. On average, large classes had 22.6 students while small classes had 15.1 students. Hence, the impacts on adult outcomes below should be interpreted as effects of attending a class that is 33% smaller for 2.14 years
...
The regression estimates reported in Column 2 of Table 5 are consistent with the results in Figure 3a. Controlling for demographic characteristics, students assigned to a small class are 1.8 percentage points (6.7%) more likely to attend college in 2000. This effect is statistically significant with p < 0.05. Column 3 shows that students in small classes are 1.6 percentage points more likely to attend college at some point before age 27.
...
Column 4 of Table 5 shows that students assigned to a small class attend colleges whose students have mean earnings that are $109 higher. That is, based on observed impacts on college attendance, we predict that students in small classes will be earning approximately $109 more per year at age 28. This earnings increase incorporates the extensive-margin of higher college attendance rates, because students who do not attend college are assigned the mean earnings of individuals who do not attend college in our index.23 Conditional on attending college, students in small classes attend lower quality colleges on average because of the selection effect shown in Figure 3b.24 Earnings. Figure 3c shows the analog of Figure 3a for wage earnings. Earnings rise rapidly over time because many students are in college in the early years of the sample. Individuals in small classes have slightly higher earnings than those in large classes in most years. Column 5 of Table 5 shows that without controls, students who were assigned to small classes are estimated to earn $4 more per year on average between 2005 and 2007. With controls for demographic characteristics, the point estimate of the earnings impact becomes -$124 (with a standard error of $325). Though the point estimate is negative, the upper bound of the 95% confidence interval is an earnings gain of $525 (3.3%) gain per year. As a result, the observed earnings impact is not statistically distinguishable from the $109 impact predicted by the college attendance impacts. If we were to predict the expected earnings gain from being assigned to a small class from the crosssectional correlation between test scores and earnings reported in column 3 of Table 4a, we obtain an expected earnings effect of 4.8 percentiles × $94 = $451. The observed small class impact of -$124 is also statistically indistinguishable from this prediction.
The study produced the usual short-term moderately positive effect on school grades. Their table 5 shows that most of these supposed adult positive effects are bordering or not even p < .05 despite 11,000 children in the study, and no doubt every attempt made to squeeze something useful out of the dataset (there’s a minor industry analyzing every large negative RCT to prove that it really showed a benefit).
Going back to Jackson et al, this is what their study implies according to themselves:
Although we find small effects for children from affluent families, for low-income children, a 10% increase in per pupil spending each year for all 12 years of public school is associated with 0.46 additional years of completed education, 9.6% higher earnings, and a 6.1 percentage point reduction in the annual incidence of adult poverty. The results imply that a 25% increase in per pupil spending throughout one’s school years could eliminate the average attainment gaps between children from low-income (average family income of $31,925 in 2000 dollars) and nonpoor families (average family income of $72,029 in 2000 dollars).
Do you think this seems like a reality-based model projection? School funding has increased massively in the last many years, and obviously, there are still large gaps between children from poor and rich families. Maybe just another 25% funding increase and the miracle will happen. Speaking of such examples, arctotherium dug up (last year) one of these unfulfilled promises:
In 1985, the Supreme Court of New Jersey issued Abbot v Burke, which determined that existing methods of school funding, relying on local property taxes, were unconstitutional and deprived underprivileged (read: black) students of their right to an equal education (1/7).
In 2010, the so-called Abbot districts, which benefited from the decision, received $18,850/student, $3100 more than the state average, overwhelmingly paid for by taxpayers located outside of these districts. Local tax intakes actually dropped (1973-2010) in real terms! (2/7)
Needless to say, this judicially-mandated colossal increase in funding for these districts (spending nearly tripled in real terms, from $7000 to $18,850/student in 2010 dollars 1973-2010), paid for by other NJ taxpayers, did not close the achievement gap in the slightest (3/7).
Visually:
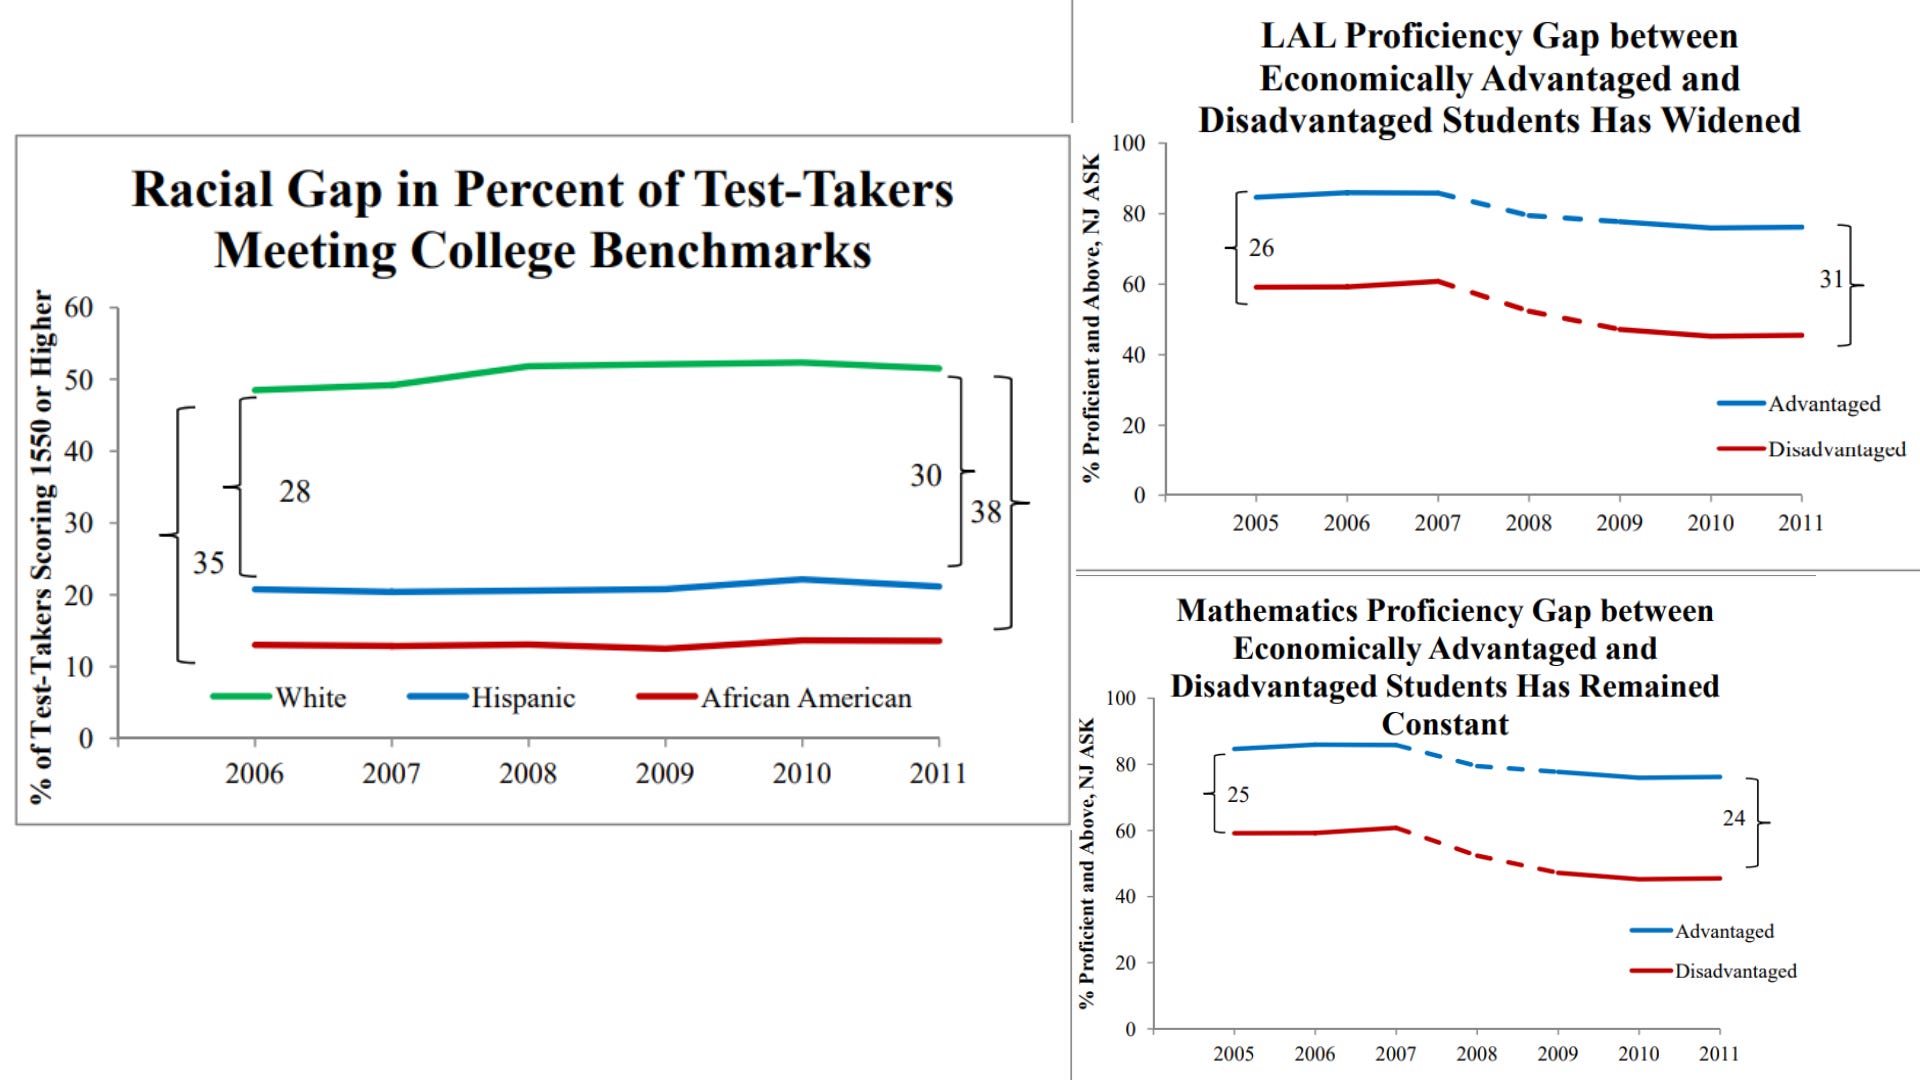
Unfortunately, the plots don’t show the test scores from back in the 1970s to present, but clearly, the various gaps were not closed and weren’t even improving in the 2005-2011 window. Recall that above they just predicted that a mere 25% increased funding would close the rich-poor gap, but some of these districts gained 200% and still the gaps remain. As a general matter, any theory that predicts that just more money is likely to close gaps because poor students benefit more (interaction effects) is already falsified since funding increased markedly since the 1960s but gaps didn’t move much in general.
For good measure, I also want to add these two recent school reform attempts lest they be forgotten. First, Zuckerberg’s 200 million donation:
Four years after Zuckerberg’s announcement on the Oprah Winfrey Show, the reforms had not lived up to expectations. The 2014 state test results showed that proficiency in both math and English had declined in every tested grade since 2011. Moreover, the ACT college admission test, which all high school juniors had taken, revealed that only 2 to 5 percent of non-magnet school students in the district were ready for college. Anderson resigned the following year. By then, Booker had already moved on to the U.S. Senate, and his successor, Democratic Mayor Ras Baraka, was elected largely because of his opposition to the Booker/Anderson reforms. Soon after, Christie turned his attention to his (ultimately failed) presidential bid.
Second, sportsballer LeBron James donated money to set up new schools in Ohio:
Basketball superstar LeBron James has more to worry about this summer than whether the Lakers will make the playoffs. The I Promise school he launched with much fanfare in 2018 made headlines last week for all the wrong reasons.
Data presented to the Akron, Ohio, school board revealed not a single student from the school’s inaugural third-grade class — now entering eighth grade — has ever passed the state’s math test.
“It is discouraging,” said Keith Liechty-Clifford, the district’s director of school improvement, in a model of understatement.
State test scores in English and science are nearly as bad, and Black students at I Promise test in the bottom 5% of all Black students in Ohio.
I could go on, and just during the writing of this post I saw that Aaron at Heretical Insights had already done so, but I want to conclude here. My takeaways are:
Large, planned randomized controlled trials of educational interventions almost always find no benefits of whatever is attempted, with a mean effect size of 0.06 d.
Various complex economist studies of semi-random variation in education funding finds relatively minor benefits if you stare really hard at the data, e.g., 0.03 d per 1000$/pupil. They make big promises about how great a mere 25% funding increase would be.
However, academia researchers have self-interest in proving that education works because their jobs depend on this. If you don’t trust Big Pharma in proving their drugs work, why trust academics proving that education works?
It’s easy to cite examples of attempts at school reform that dramatically failed despite 100s of millions spent. One could in fact write an entire book of such attempts.
The schools reflect their students far more than the students reflect the school (I think the impact ratio is > 10:1). I moved into an area with an excellent school disctrict when my kids were in school - but I did not fully trust the schools to do their job. We monitored their learning and at times supplemented it. I gave school administrators grief to get the kids into appropriate classes - and when I could not, I oversaw home-study/correspondence classes. I was a hands-on and involved parent - but I did not do the work for them, I made sure that they did it themselves and mastered the material.
Once you have a classroom and a teacher, the next most important thing is not devices, but the absence of disruptive and disaffected students who disrupt the learning by everybody else in the classroom. And money doesn't affect that directly.
The better students will be at least partial autodidacts - they will learn if given a chance. When I went to school many of the better students were not well off - they were the children of the Holacaust survivors, many of whose parents were running small shops. Many were both bright and hard working - and their home culture supported academics.
damn that's depressing. for these kids, is school just daycare that reduces criminality while allowing their parents to work?