
Are IQ scales interval or ordinal?
Some indirect evidence for interval level

One of the more obscure objections to intelligence testing is that really the tests are only on ordinal scale, and thus many of the usual statistical operations are undefined. Recall, levels of measurement:
Examples are:
Nominal: sex, country
Ordinal: age groups (infant, child, teenager, young, middle, old), Mohs scale (hardness)
Interval: temperature in Celsius or Fahrenheit, year since Jesus
Ratio: temperature in Kelvin, grams (weight), m/s (speed), Joule (energy)
Each level of measurement allows certain mathematical operations to be used sensibly. If we just have arbitrary categories, we can still count them and thus find the mode (most common value). However, it makes no sense to calculate the average (the average sex is about 1.50 if we arbitrarily set male=1 female=2). Ordinal data improves on this, at least we can put things in order, even if the relative differences are unclear. Teenagers are older than children, but not necessarily by the same number of years as “young adults” are older than teenagers. Interval data has this problem solved such that measurements that are some units apart in value are actually the same distance in the construct of interest no matter where the difference is. The time between the year 1900 and 1920 is the same as that between 0 and 20. However, the 0 point is arbitrary and so it makes no sense to do multiplication/division, and thus percentage. Someone might say 20 C is twice as warm as 10 C, but would they say 10 C is -1 times as warm as -10 C? I hope not. Finally, (true) ratio scale measurement are the real deal where 0 on our measurement scale means there is no amount of whatever we are measuring: 0 m/s is not moving at all (in the reference system), 0 seconds is no time elapsed, and 0 Kelvin is no temperature. Using these scales we can correctly use ratios, and thus 20 K is twice as warm as 10 K, and 10 m/s is half as fast as 20 m/s.
The holy grail of psychological measurement is finding some way to measure something on a ratio scale. Essentially every psychological measurement is done using relative scales that essentially just tell us how high or low a given person is relative to others we measured. We can then rescale the data into perhaps more meaningful metrics. The most commonly used is the z-scores, that is, mean=0 and standard deviation=1. However, one can use whatever, and intelligence researchers ended up using mean=100, SD=15 (earlier it was 16 and 24). The SAT uses a weird scale with 800 maximum (which is bad), PISA uses 500 as the mean of Western countries. Many people like to think in centiles, which is a nonlinear transformation of the same thing.
Anyway, so occasionally, one will find someone claiming that, aha, IQ is only really an ordinal scale, so all the statistics are gibberish. In fact, Wikipedia teaches us:
In particular,[10] IQ scores reflect an ordinal scale, in which all scores are meaningful for comparison only.[11][12][13] There is no zero point that represents an absence of intelligence, and a 10-point difference may carry different meanings at different points of the scale.[14][15]
If you check the citations, you might expect to find the usual communists, but actually the references are to works by Hans Eysenck and the like. Peculiar.
What about Arthur Jensen? Well, in 1980 he wrote a book called Bias in Mental Testing, which spent a chapter arguing that IQ scales are interval. And then in later writings he wrote they were only ordinal. I don’t know how he made sense of this change, to my knowledge, he never stated his reasons for his apparent change of mind. However, in his works, he continued calculating means, correlations, and so on, so he was treating it as interval, as was everybody else. So let’s quote Jensen 1980 (chapter 4):
At least an interval scale is required for the form of the frequency distribution of our measurements to be meaningful. If the numerical values of the measurements do not represent equal units of the thing being measured, then of course the form of the frequency distribution, plotted on such a scale, will only reflect the peculiarities of the unequal units between different points on the baseline. Unfortunately we have no direct way of knowing whether the scores on most mental tests constitute an interval scale. We can only be sure that they are an ordinal scale. Measurements on an ordinal scale can only represent “ greater than” or “ less than” ; but we cannot know how much “ greater than” or “ less than. Thus the measures only denote rank order. The hardness of gems is measured on an ordinal scale; if gem A can scratch gem B, but B cannot scratch A, then A is ranked as harder than B, and all substances can thus be ranked in hardness. Diamond is at one extreme, talc at the other, but all the substances in between, although they are assigned ordinal numbers indicating their rank order, do not represent equal differences in degree of hardness. Test scores are analogous; they merely rank order individuals. Whatever the numbers assigned to the scores, they can only be compared with one another in terms of “ greater than” or “ less than.” Individuals’ test scores could be changed to any other numbers that one pleased as long as their rank order remained the same. Obviously then, the shape of the frequency distribution of scores that are only an ordinal scale is quite meaningless, or at best trivial.
How can we get a mental test that will yield scores on an interval scale, so that the shape of the frequency distribution of scores is meaningful? We have no independent yardstick of ability as we have when we measure height. (It is easy to test whether the marks on your yardstick for measuring height are equal intervals; for example, if we cut the yardstick at the 18-inch mark, will the two pieces when laid side by side have the same length?) The mental test itself is our yardstick, but the scale properties of the scores are what we do not know. So how can we ever make sure that the test scores represent an interval scale?
We simply assume what the distribution of scores should look like if we had an ideal test that measured the trait or ability in question on a perfect interval scale. Then, if we can construct an actual test that in fact yields a score distribution like the one we have assumed, we can be absolutely certain that the scores are on an equal-interval scale— provided, of course, that we are correct in our initial assumption about the true shape of the distribution. For most mental abilities, and particularly general intelligence, psychologists have assumed that the true distribution is the normal distribution. Ipso facto, any test of intelligence that yields a normal distribution of scores must be an interval scale. The logic boils down to the one crucial question: What is the justification for the assumption of normality?
He offers essentially two related arguments: 1) if we can plausibly assume that a ratio intelligence scale is normally distributed, and our measurement shows such a distribution, it must be at least interval level, and 2) if we can plausibly assume that a ratio intelligence scale is linearly related to some other variable, and our measurement shows such a linear relationship, then the measurement must be at least interval level.
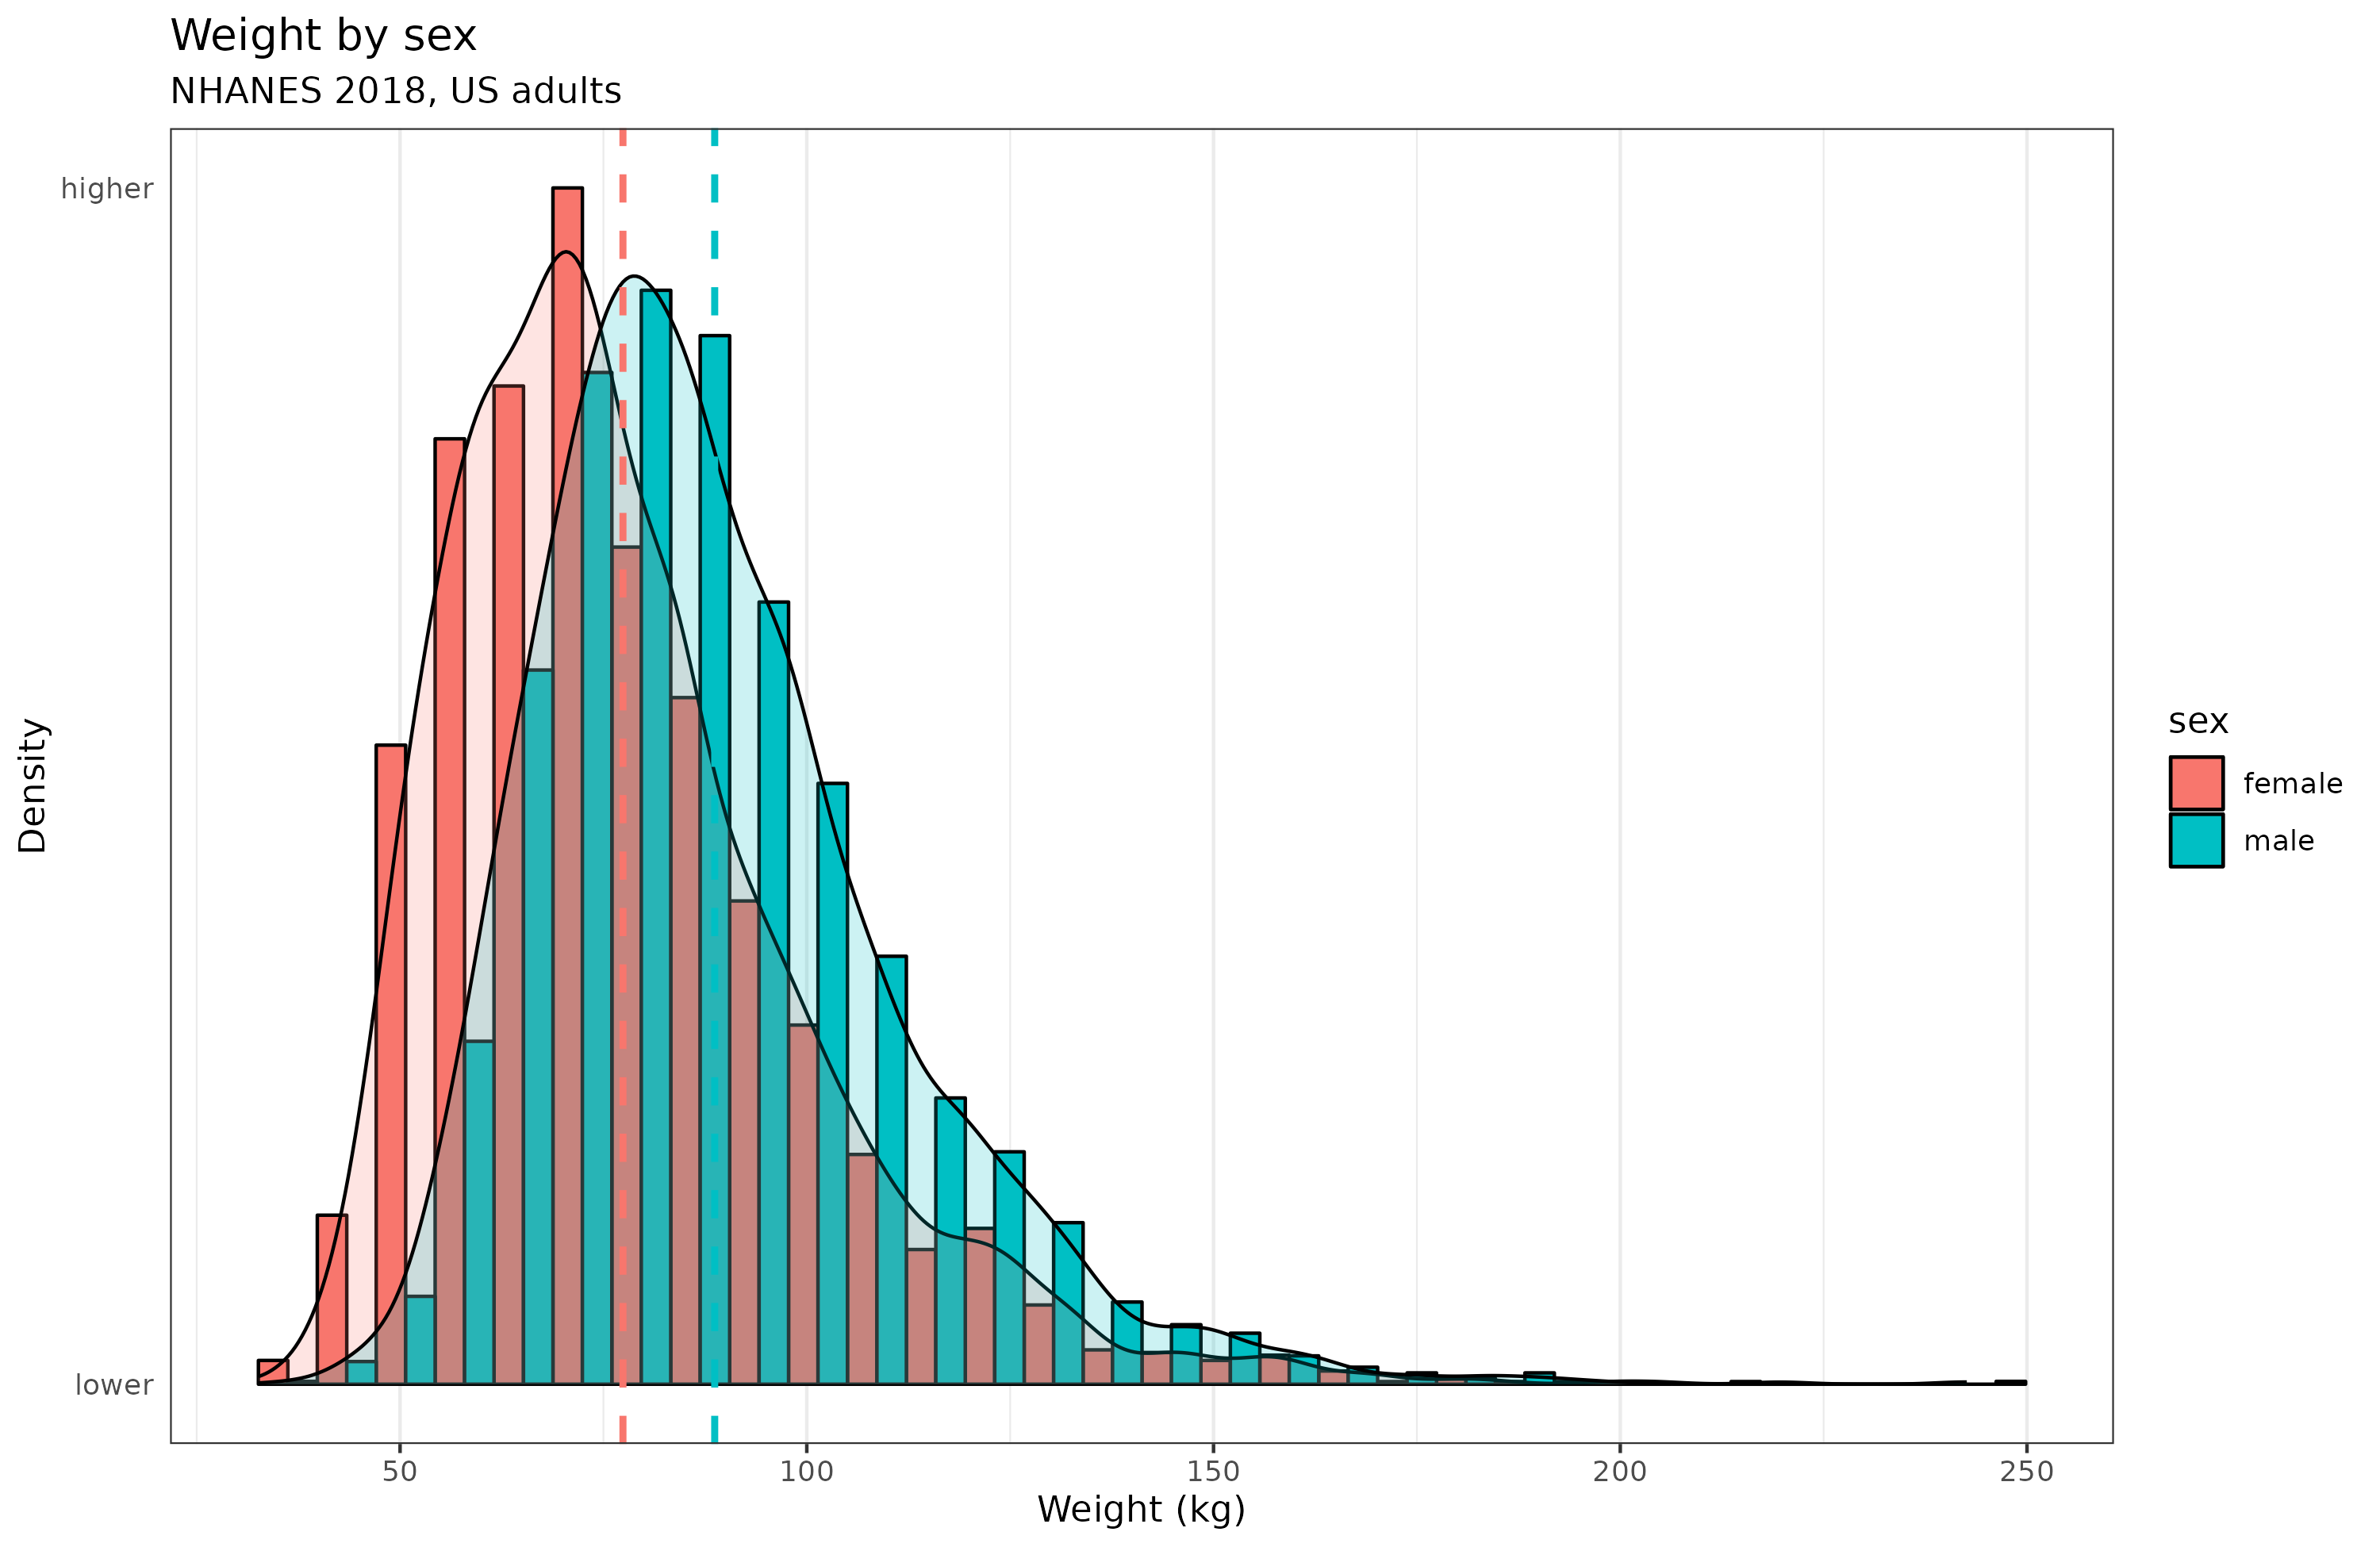
What is the reason to assume a normal distribution? Well, by analogy with certain other physical features, chiefly height. The distribution is assumed to result from many independent but small causes, which when added up results in a normal distribution. For height, there are additionally some thick tails due to genetic defects causing abnormally weak or strong growth. One can come up with various other examples, say, birth weight at full term (including preterm births would give a thick left tail). However, not everything works this way, for instance, adult weight is presumably also caused by many small causes, but isn’t normally distributed:
Or take body fat % (BMI is deliberately nonlinear since it involves dividing by a squared term), which presumably is also quite heritable and caused by many small independent causes:
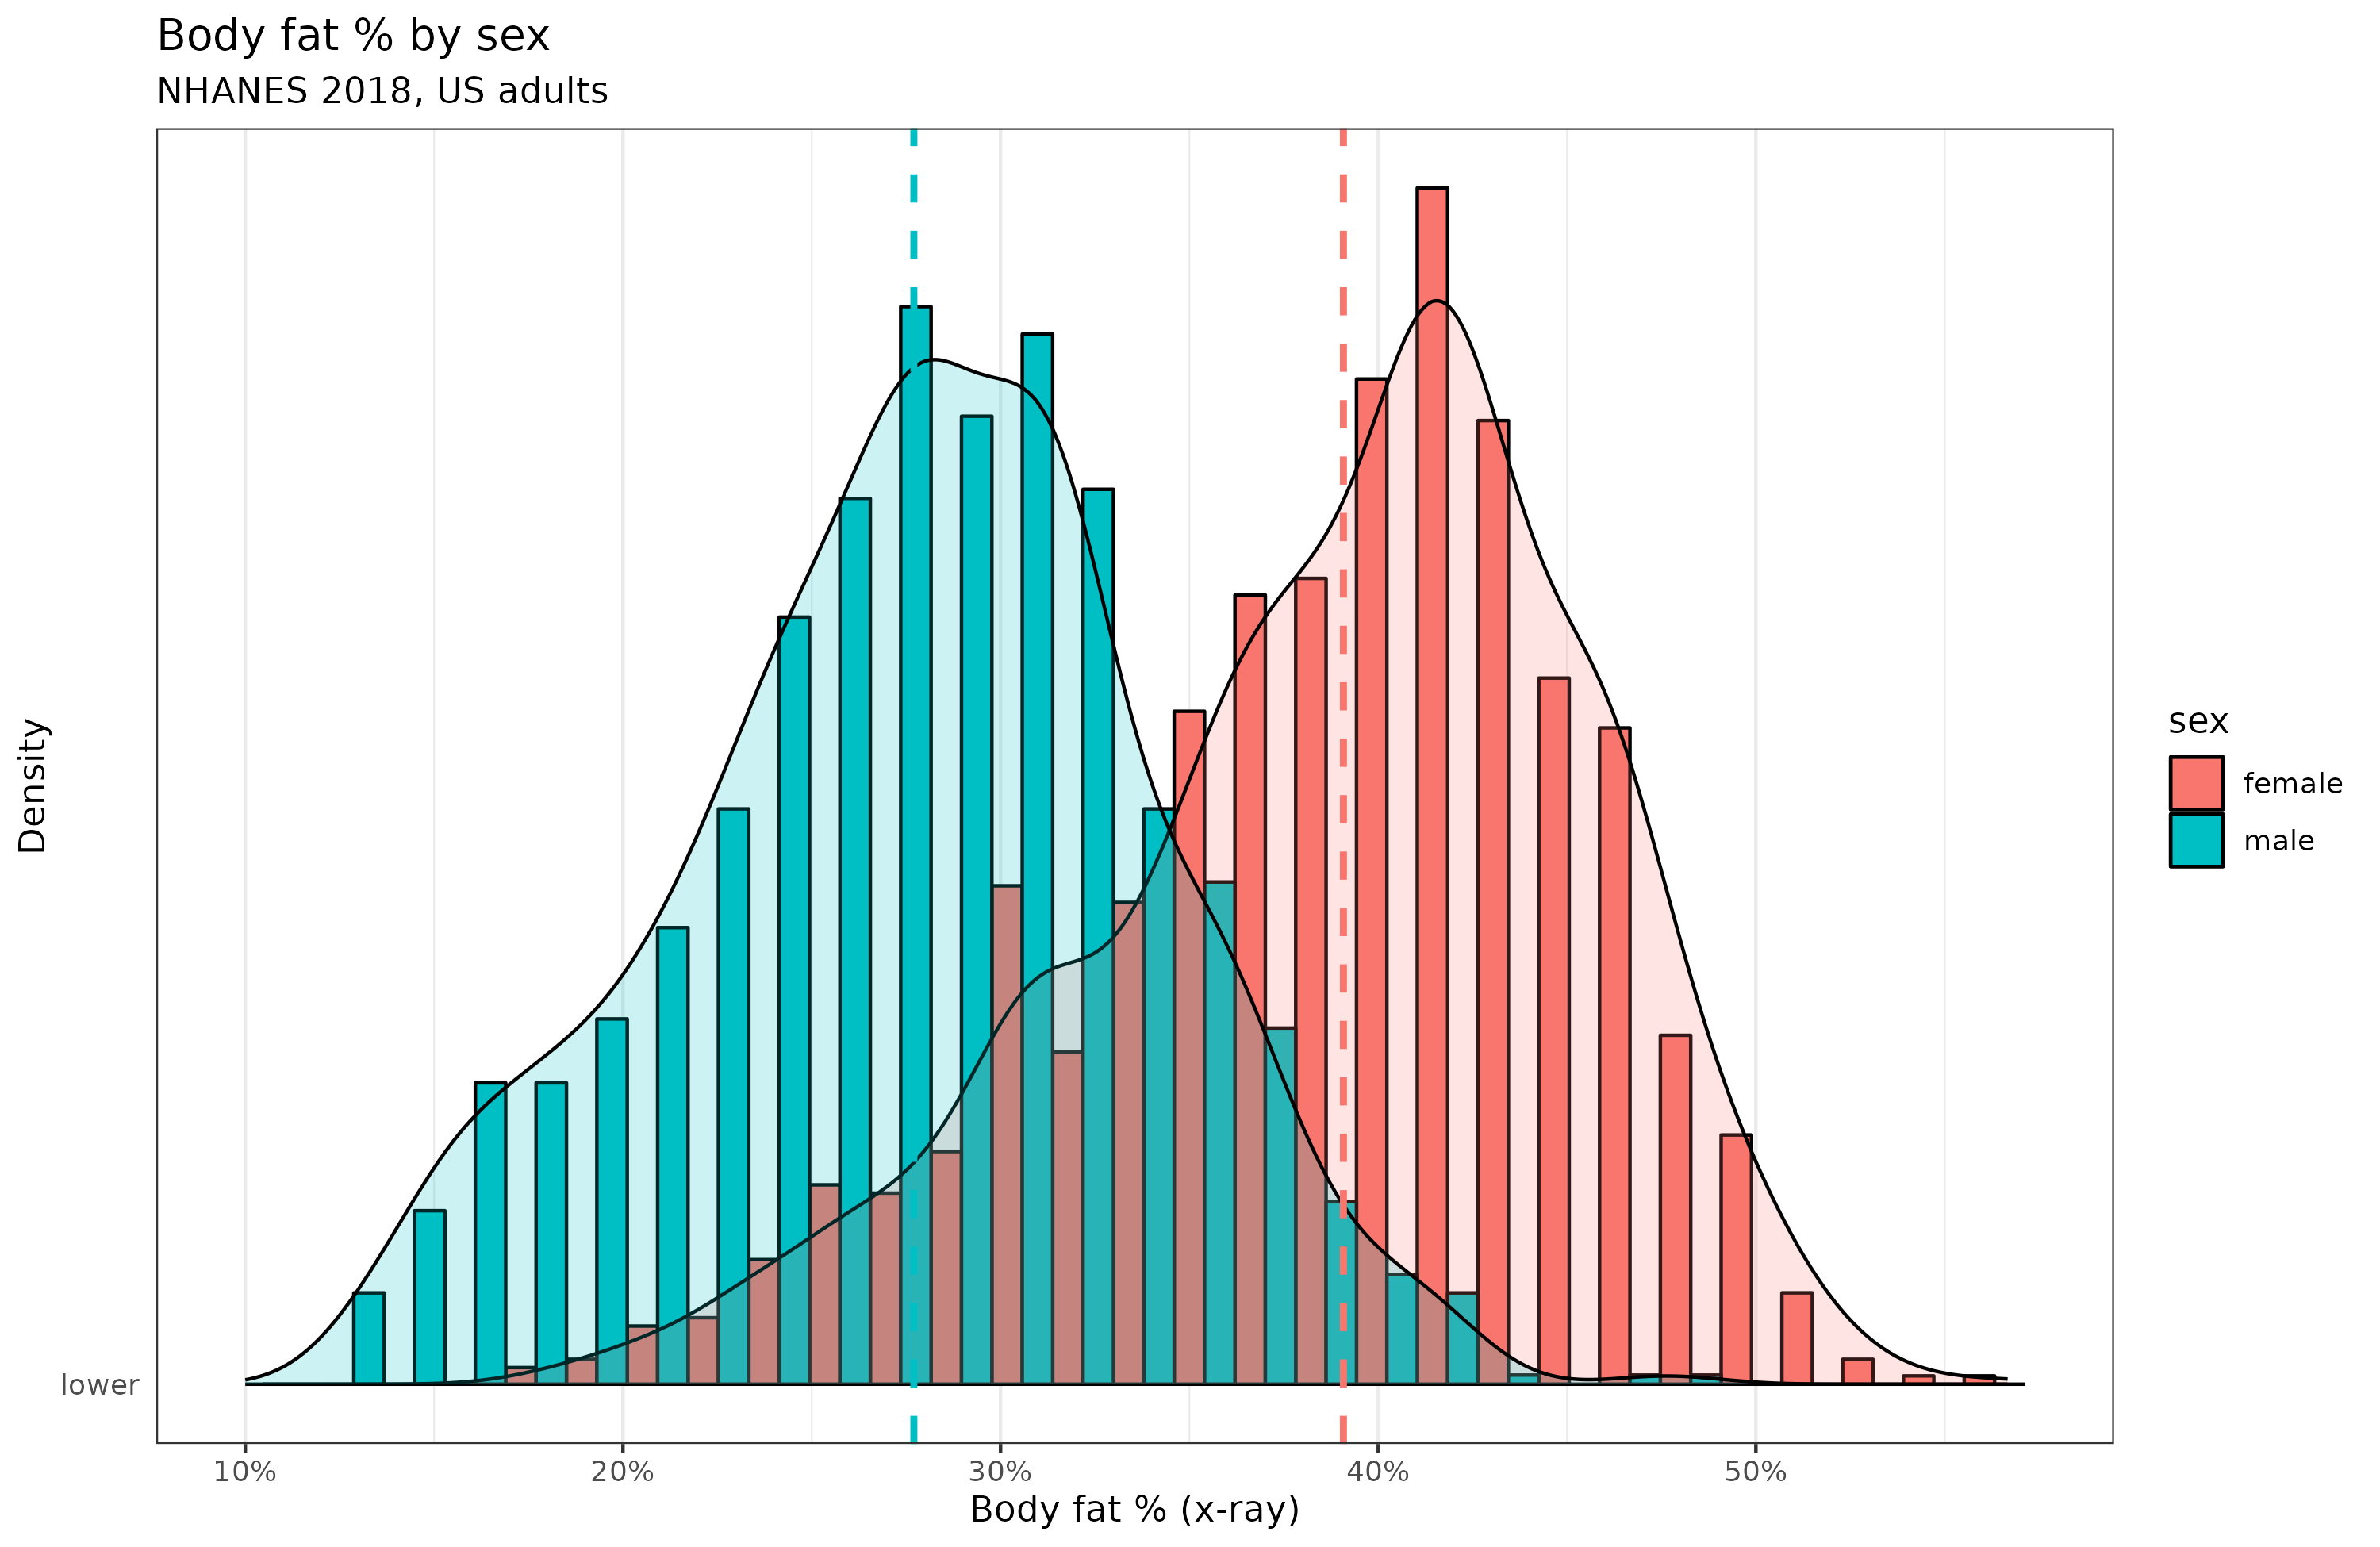
So the distribution argument isn’t all that great I think, at least, not without some good reasons why intelligence is more akin to adult height than adult weight.
With regards to the linear relationship argument, I simulated some more data and stipulated it has a linear relationship with some 3rd variable:
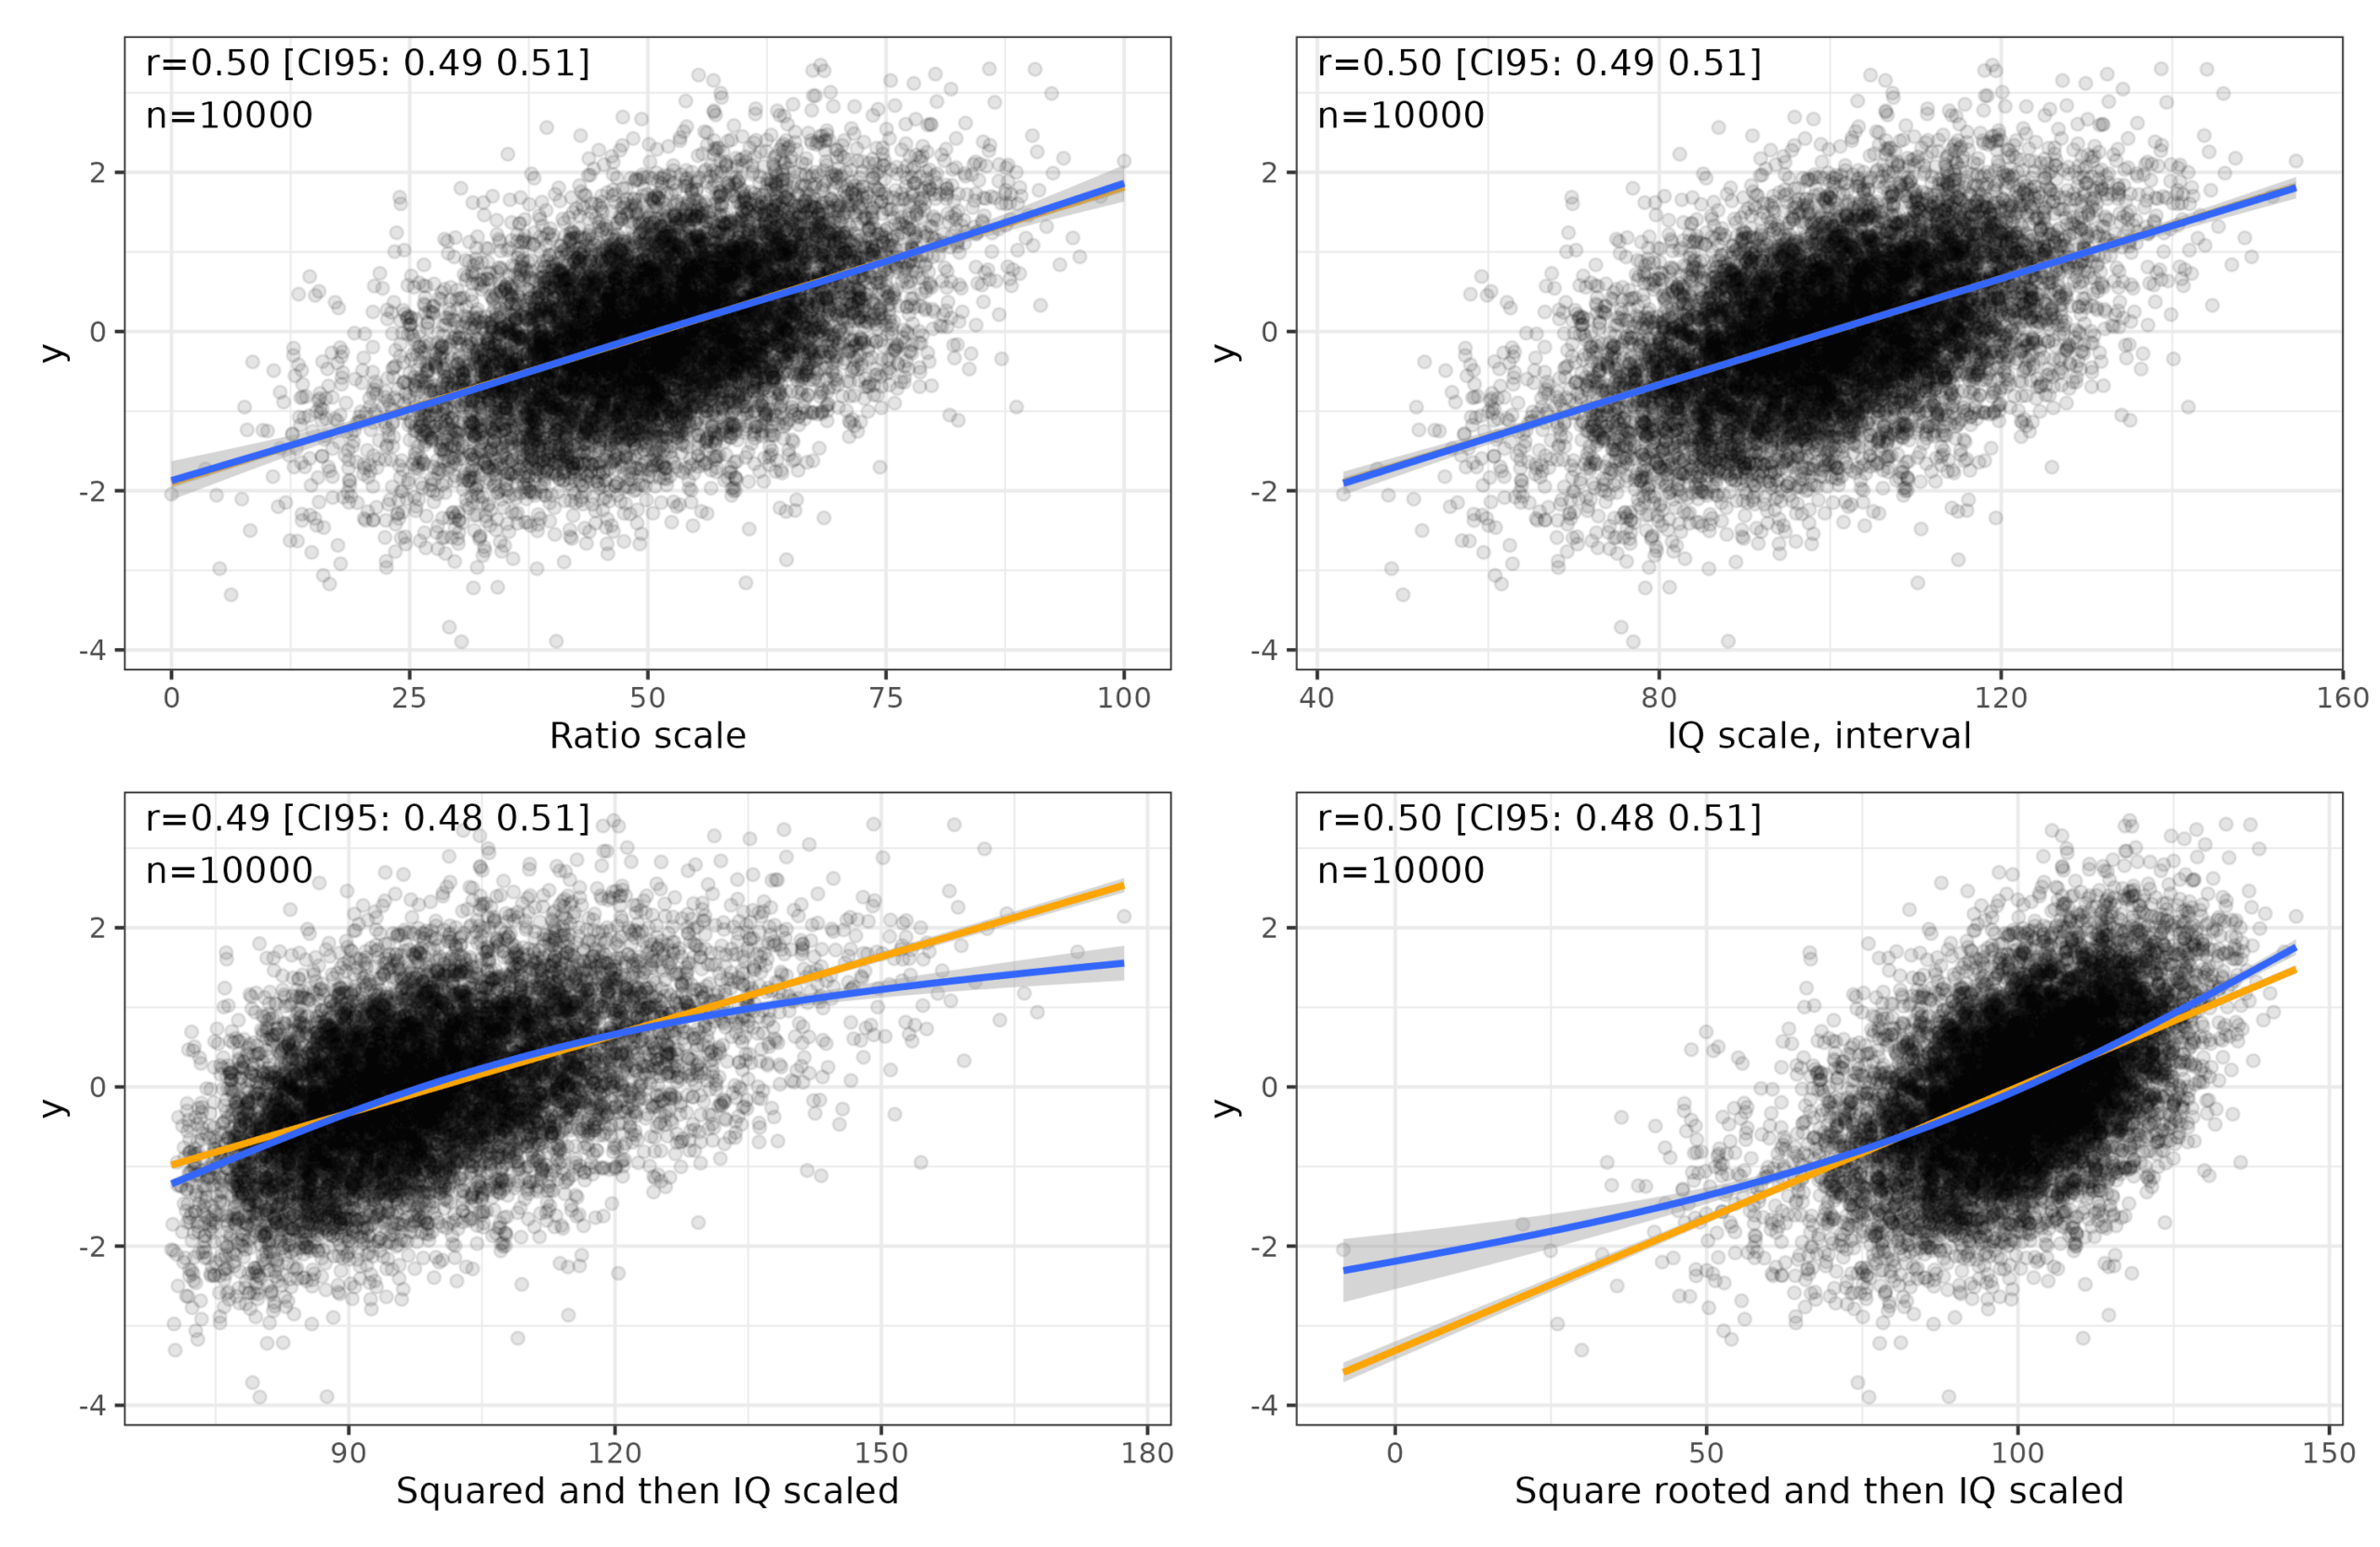
Top left plot is a hypothetical ratio scale of intelligence, with 0 being essentially brain dead (no intelligence), and 100 being arbitrarily the smartest person in 10,000 people. Ideally, one would measure brain speed or thinking ability in some proper unit, but no one knows what this unit might be. The best we have is analogies with computers, so flops and the like. Top right plot shows the standard IQ scale transformation of the ratio scale, which is what we hope we have. Bottom left shows a squared transformation followed by IQ scaling. Notice that if our measurement was actually this way, the relationship to external variables would be modified somewhat and turn a bit nonlinear. Bottom right shows a square root transformation, which also disturbs the relationship but in the opposite way. Here’s the distributions:
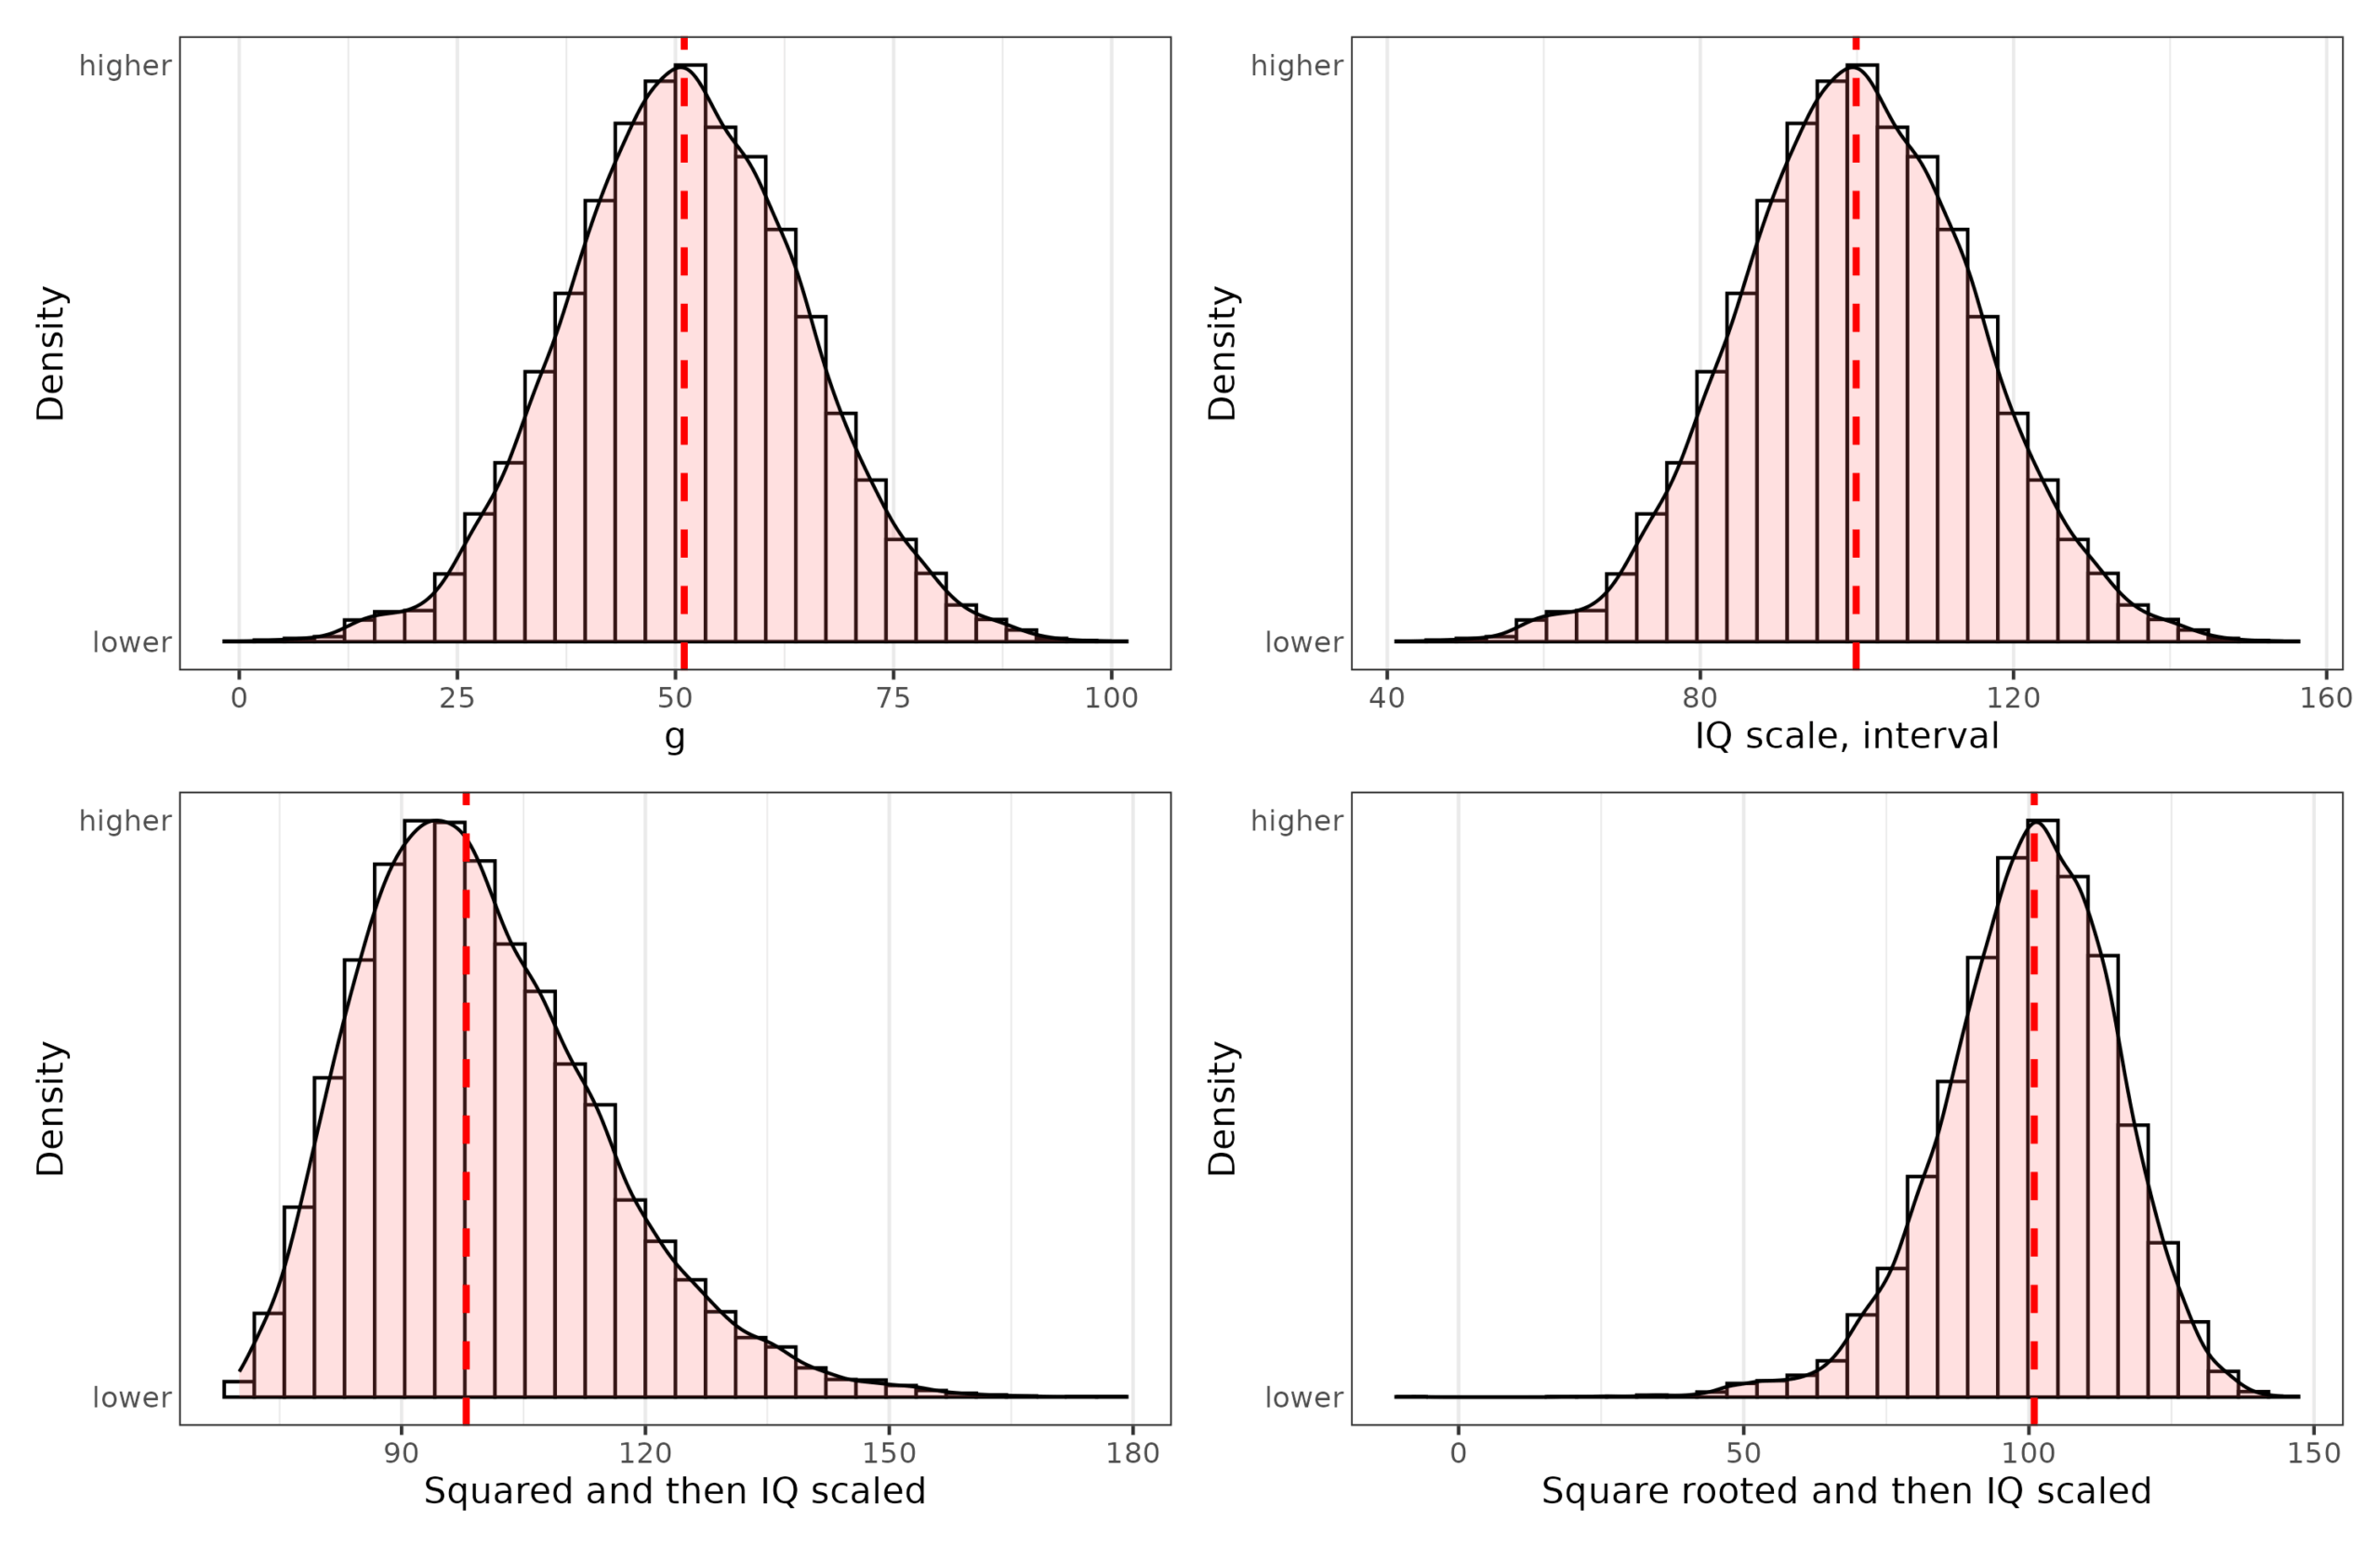
The bottom two distributions are fairly but not entirely normal. They have an asymmetry to them. We could compare the distributions of really representative samples to these and see if they have non-normality beyond cases of genetic defects on the left tail. There are several such studies, and Russell Warne & colleagues has perhaps the best one. They were particularly interested in whether the right tail is thicker than expected by a normal distribution (akin to bottom left above). However:
We tested this hypothesis by searching public datasets and the published literature for large representative datasets, 10 of which were found in 6 sources. Results indicated that the overabundance hypothesis was mostly unsupported by the data. Moreover, most datasets included approximately the same (or fewer) gifted individuals than would be predicted from a normal distribution.
The evidence isn’t entirely convincing because the distribution also reflects the way we construct tests and score them in part. If you took an ordinary 7th grade school test but written in Chinese and gave it to some people in Kenya, they probably wouldn’t do very well, and the average score would close to that of blind guessing (smartphones and foreigners aside). Similarly, if you made a test of 3rd grade arithmetic and gave it to some math PhD students, the performance would presumably be nearly perfect and not very normally distributed. Both of these cases reflect range restriction issues (ceiling/floor effects). In other words, if we don’t make a proper test with items that people vary on, the distribution will be extremely skewed. However, the distribution is still not necessarily normal even if balanced items are used. Here’s a simulation to show this:
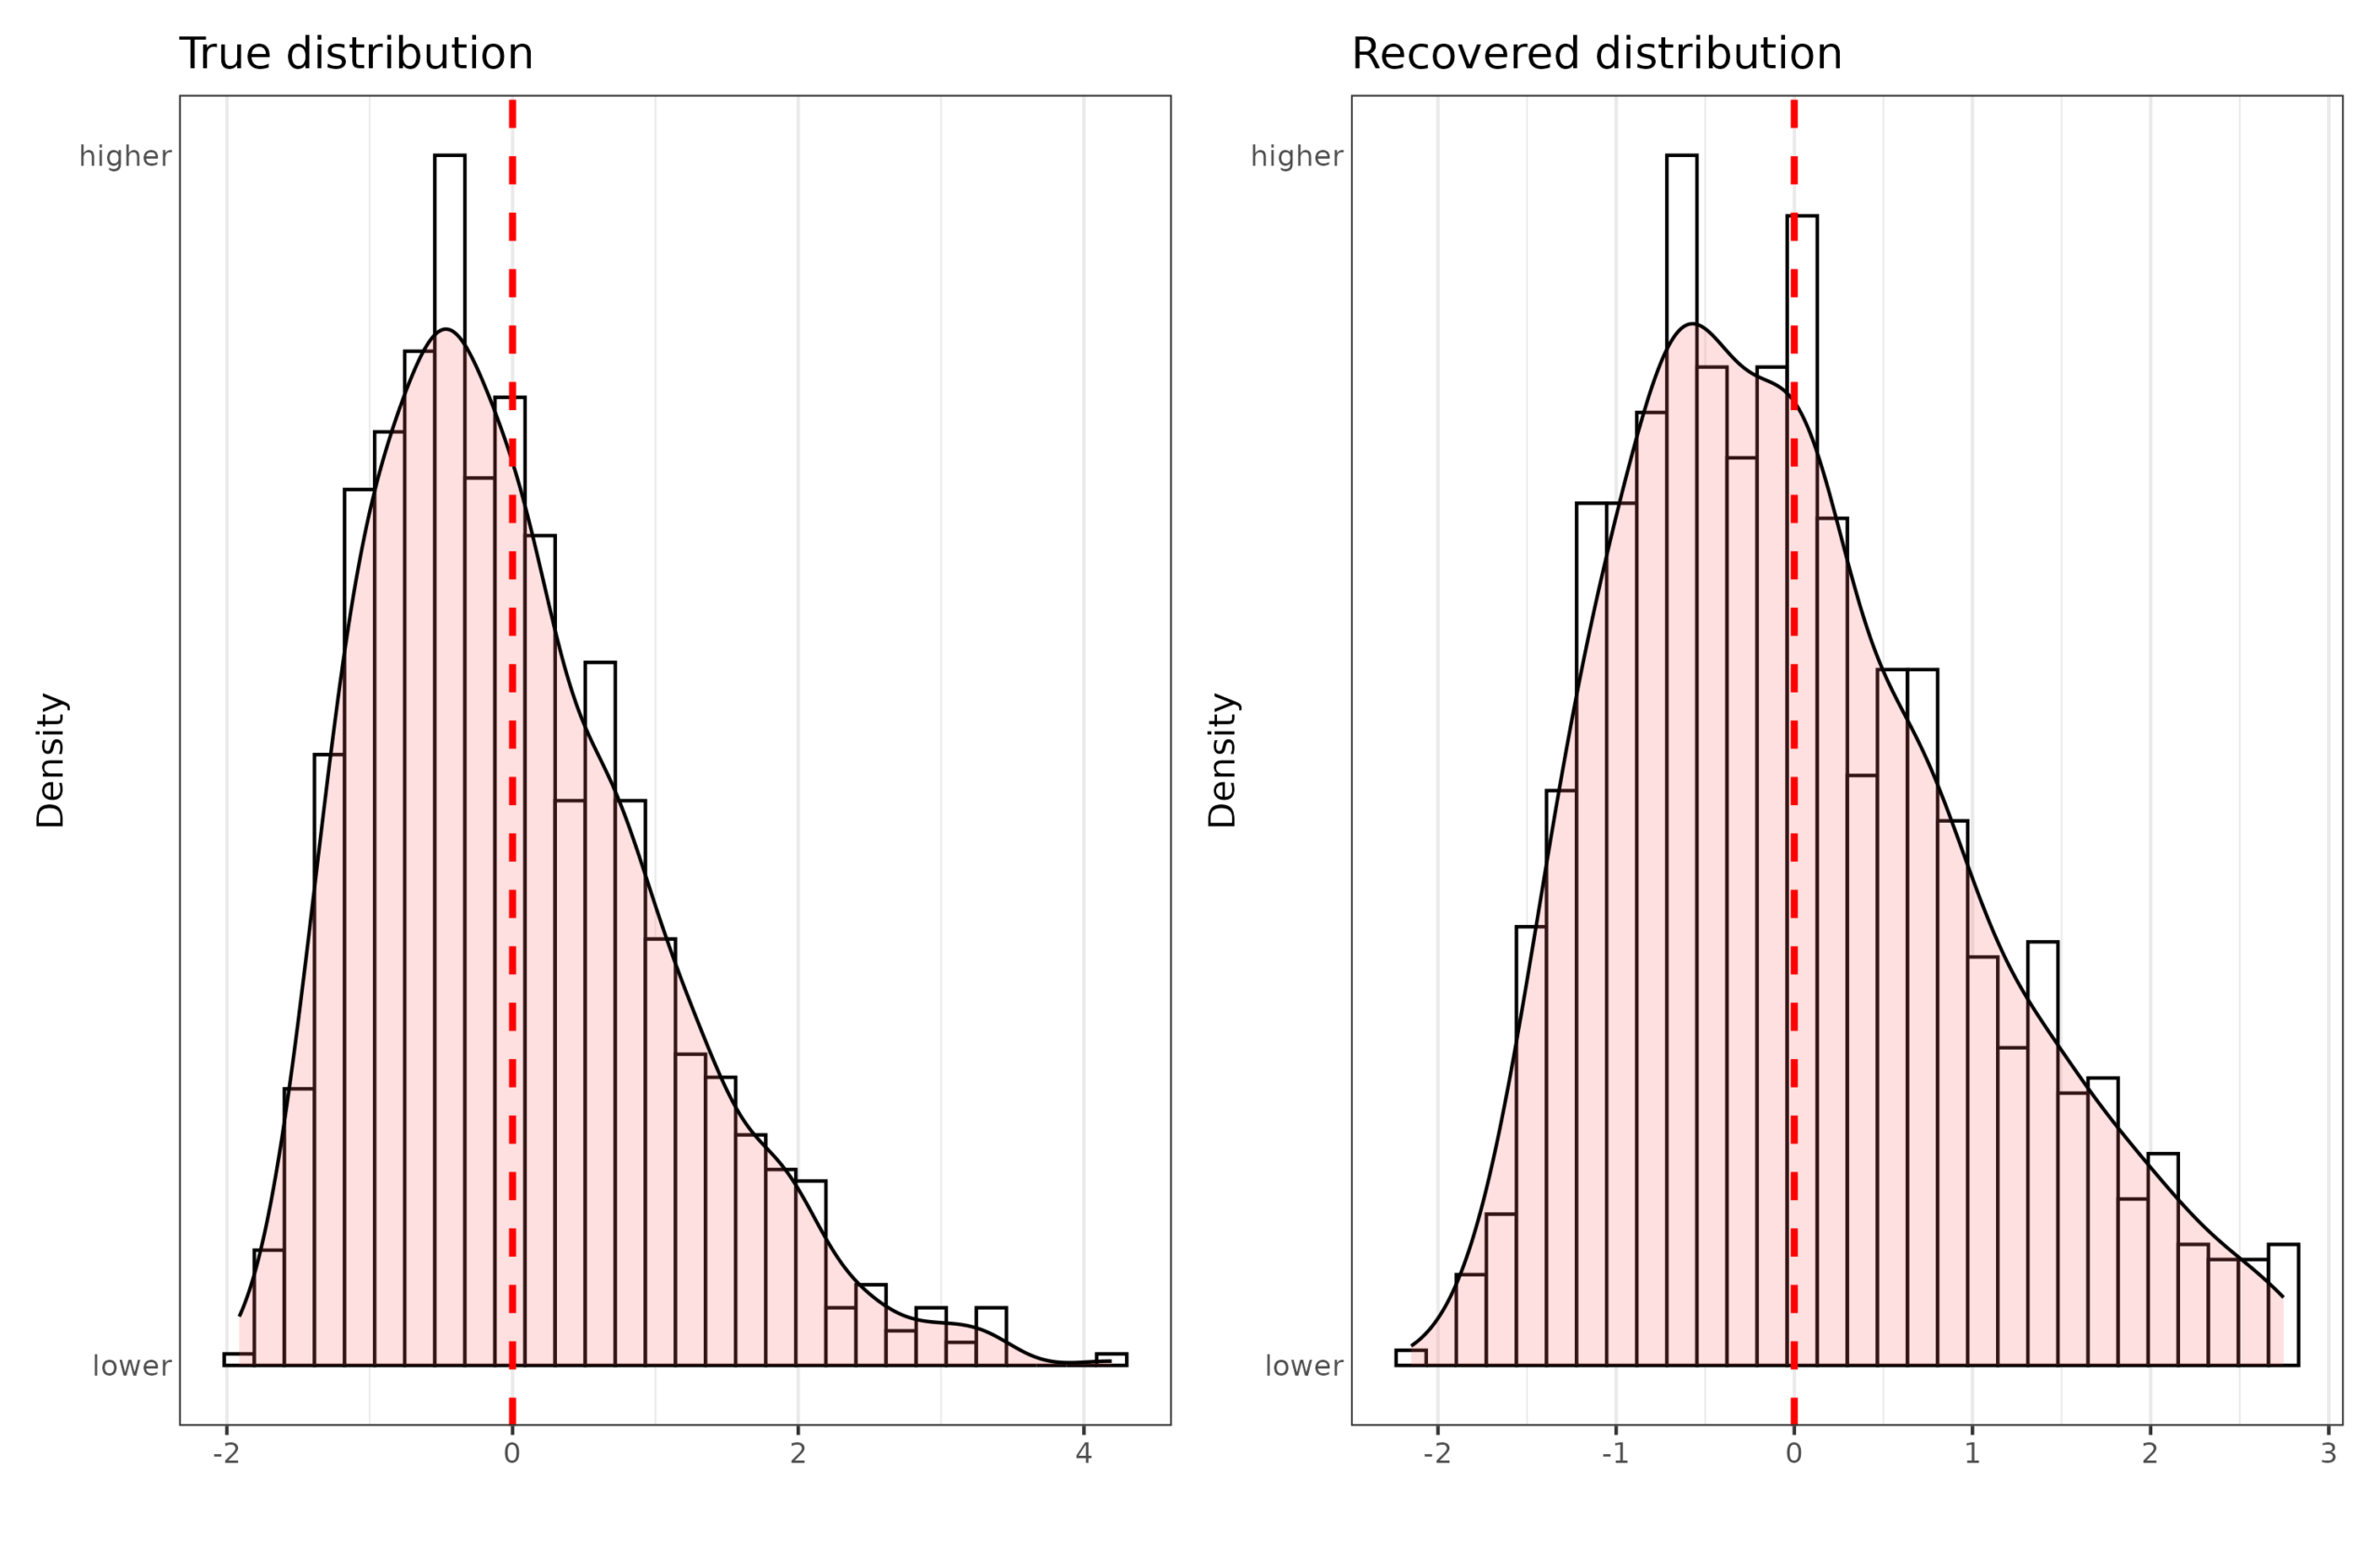
The true distribution is more skewed than what we estimated, I suspect because some of the mathematical modeling behind the scoring is based on normality assumptions. Nevertheless, if the real intelligence distribution was markedly non-normal, our measurements would find this to some extent. The scoring itself does not force a completely normal distribution.
Finally, there is a stronger argument. Again, from genetics we know that there is a thing called regression towards the mean. If we measure a large number of people on some phenotype, say, adult height, we find a normal distribution (+ thick tails). We also find that siblings are similar in that if one sibling is really tall, the others are probably also tall. However, they aren’t as tall on average, they are a bit regressed towards the mean. The degree of regression is a function of 1-heritability (assuming no environmental effects). This regression is expected on genetic grounds and must take a certain linear form. If, for instance, the (additive) heritability is 80%, then a sibling of a +2 SD (+14 cm) person will be about 0.8*0.5*14=5.6 cm above average. If our intelligence measurement is interval scale, the same linearity should hold, and this can be tested. E.g., the siblings of 140 IQ persons should be about 116 IQ (assuming again 80% heritability and no assortative mating). This particular theoretical expectation has been tested a few times, including by old studies that Jensen was aware of:
It has been argued that, if intelligence is normally distributed in the population and if intelligence test scores are normally distributed, it must mean that the scores are an equal-interval scale. Now, if we really have an equal-interval scale, we should expect that, if we pick a person with a score near the high end of the scale of measurements, that individual should differ from his or her own siblings by the same amount as does a person with a score equally far toward the low end of the scale. There is no theoretical reason to believe that sibling differences should be greater or smaller above the mean than below the mean. If the test scores were not an interval scale throughout the full range, and the differences between high scores were not really the same as nominally equal differences between low scores, we should expect sibling differences to vary systematically at different points on the scale. But this is not the case. Sibling differences, on average, are the same for high as for low IQs, until we come to the very low IQs below about 50, where the normal curve no longer holds.
Furthermore, we have a theory of intelligence—the polygenic theory—that is entirely independent of any test of intelligence. (The same essential polygenic theory applies also to all continuous characteristics in all plants and animals.) The theory, which will be explained later, predicts the magnitude of the difference between siblings, provided the measurements are an interval scale. It predicts that, on the average, the score of a person’s sibling will fall halfway between the score of the person and the mean score in the population from which the person is selected. This phenomenon is known as regression to the mean. It results because each full sibling inherits a random half of the parental genes (i.e., half of each parent’s genes combine in the fertilized ovum from which the new individual develops); siblings therefore, on the average, have half of their segregating genes (i.e., genes that make for variance in the trait) in common, causing them to be correlated .50. A sibling correlation of .50 implies that for persons who deviate from their population mean by X units, their siblings, on the average, will deviate .50X units from the mean. This prediction is derived from purely theoretical considerations that are entirely independent of any intelligence tests. Yet the prediction of the sibling differences could be borne out accurately only if the measurements were on an interval scale. The prediction has in fact been borne out in many studies using standardized intelligence tests constructed entirely without reference to polygenic theory.
Unhelpfully, he doesn’t cite these studies, but then again, his book was already 800 pages long. He mentions the same research in another paper from 1970, so it must be old. Whatever the exact studies were, we have replicated this finding using the NLSY. See also my prior post on the two kinds of retardation (which is based on the 1970 paper).
Anyway, so to sum up the points:
We have plausible grounds to think intelligence is normally distributed (polygenic basis) + left-tail due to genetic disorders and accidents.
Our measurements of intelligence are in fact quite normally distributed, which indirectly supported them being interval scale, not merely ordinal.
Our measurements of intelligence show quite linear relationships to many variables, which fits an interval scale, though does not prove it (theoretically, both variables could be log-normal distribution and linearly related or some such mutual cancellation).
Sibling regression towards the mean effects are linear, which is also predicted by polygenic theory, and other distributions would not predict this.
And of course, this objection is proving too much (isolated demand for rigor). If intelligence science fails because the measurements are not provably interval level, then essentially all of psychology fails too, as all the other measurements are on a worse theoretical foundation. I mean, sometimes someone like Turkheimer argues like this, but then goes back to doing his regular work that he himself just argued is pseudoscience. Maybe he does think he is a fellow pseudoscientist, just with better (socialist) morals. I don’t think this objection is much of a concern.
One of the studies Jensen probably read.
Cobb, M. V., & Hollingworth, L. S. (1925). The regression of siblings of children who test at or above 135 IQ. Journal of Educational Psychology, 16(1), 1.
https://archive.org/details/sim_journal-of-educational-psychology_1925-01_16_1/mode/2up
One of the first ideas I learned in graduate school (psych), was that of the "hypothetical construct". "intelligence" as addressed in psych is one such. The trait is one we infer. Originally I think because Binet set out to find out which people did well in school. what he put together (as set of questions) was predictive. voila--intelligence had its birth. but at heart it is still just an operationalization of an idea. and your off-hand idea that much of psychology is void if such things as intelligence are not ratio scale is profound. To me, the fact that such tests predict so much in the real world (maybe in spite of being non-ratio) is fascinating. I am over the hill at age 78 so it doesn't matter to me except for some curiosity that won't settle down. TY EK.