
Are PISA items biased?

Asil, M., & Brown, G. T. (2016). Comparing OECD PISA reading in English to other languages: Identifying potential sources of non-invariance. International Journal of Testing, 16(1), 71-93.
The use of the Programme for International Student Assessment (PISA) across nations, cultures, and languages has been criticized. The key criticisms point to the linguistic and cultural biases potentially underlying the design of reading comprehension tests, raising doubts about the legitimacy of comparisons across economies. Our research focused on the type and magnitude of invariance or non-invariance in the PISA Reading Comprehension test by language, culture, and economic development relative to performance of the Australian English-speaking reference group used to develop the tests. Multi-Group Confirmatory Factor Analysis based on means and covariance structure (MACS) modeling was used to establish a dMACS effect size index for each economy for the degree of non-invariance. Only three wealthy, English-speaking countries had scalar invariance with Australia. Moderate or large effects were observed in just 31% of the comparisons. PISA index of economic, social and cultural status had a moderate inverse correlation with dMACS suggesting that socioeconomic resourcing of education played a significant role in measurement invariance, while educational practice and language factors seemed to play a further small role in non-invariance. Alternative approaches to reporting PISA results consistent with non-invariance are suggested.
This is both a neat and a frustrating study. PISA does not give all students all the items. They give students random booklets/parcels of some subset of items, so there is a massive missing data design (like SAPA) but with groups. They wanted to examine literacy for whatever reason, and they picked booklet 11 which has 28 items about literacy translated into various languages. One can get a feel for the items because they make new ones for every wave, and release the old ones. Here's the 2018 items.

(It is pretty outdated. No one buys ringtones with SMS anymore. That's like 2003 tier behavior. Made by boomers?)
Anyway, so they end up with those 28 items with complete data for 32,704 people from 55 countries. They fit a simple g-factor model to these 28 items, and using Australia as the Chosen People, they compute the dMACS score (this is a metric for how much differently the items works) for AUS-focal comparisons. Their result looks like this:

OK, so a lot of countries some show non-MI, which is of course expected. A lot of these show small amounts overall. Annoyingly, the authors don't compute the effect of this on the score differences between the countries. If we find that items don't work similarly, and we are using scores from these items for all kinds of research, then we are pretty interested in how this test bias actually affects the comparisons! Seemingly, the authors disagree. They do note that all the countries with small gaps measurement variance to Australia are wealthy countries, and the gaps don't seem to relate strongly to script or language family, but probably some effect of having the same language. Authors then say:
Alternately, grouping countries into clusters of “countries-like-me,” assuming they use the same language and/or share the same educational culture, might be abetter way to identify invariance of responding to test items and to report results.Restricting reports to those nations would likely be defensible and informative.For example, it may be conventional to argue that East Asian societies which use Mandarin (i.e., Singapore, China, Macao, and Taiwan) and having strong dependence on testing and public examinations and shared cultural approaches to schooling and testing should be compared, independent of other East Asian societies which have different writing scripts and languages, despite having similar cultural histories and forces (i.e., Japan, Korea, and Hong Kong). However, this study has suggested that grouping and reporting performances among East Asian societies may be defensible, since the range of dMACS relative to Australia for all seven economies was just 0.136 to 0.199. Likewise, once could imagine Nordic countries (i.e., Finland, Sweden, Norway, Iceland, and Denmark) or continental Western European countries choosing to allow inter-country comparisons because of their similarities in ESCS, despite differences in language. Nonetheless, separate studies that demonstrate that such natural geographic and cultural groupings were defensible requires conducting parallel analyses using one or more of the contributing nations as a reference point.
Yeah, one could cluster the countries based on this. But since the authors didn't actually compute the entire distance matrix, this can't be done, one can only guess. Naturally, when they were doing the above, all they had to do was write a loop to compute the entire matrix of pairwise distances but ... no. Another obvious idea is to take some items from another domain, PISA has 3 others, math, science, problem solving, and do the same. Do these show the same results? One can also do it across waves of PISA to check any trends. Some countries grew closer in e.g. wealth during the time since year 2000 (first wave) and 2018 (newest wave). So, doing these two things is a pretty obvious and important study. It would be the first large-scale analysis of whether national IQ gaps are massively affected by measurement variance or not. There is another prior study (Wu et al 2007) that looked at measurement variance in these scholastic test data, but it also did not compute the effects on mean scores. For the reference, this can be easily done using the metrics in mirt package's empirical_ES() function. Meade 2010 provides a nice introduction to these metrics, but the one we want here is Expected Test Score Standardized Difference (ETSSD), which is the expected effect size in Cohen's d of the deviance from measurement invariance for the items in question. These differences will probably be small because the measurement variance varies at random by item. One item will happen to be easier for one group, harder for a second group, slightly higher loading for a fourth, lower loading for a fifth, and so on. These effects will cancel out if they are not systematic, so the estimated of mean differences by group will not be biased.
So, to answer the question in the title: Yes, the items show pervasive bias, as expected, but we don't know what the impact of this is because the authors did not compute metrics this.
Oh on a technical note:
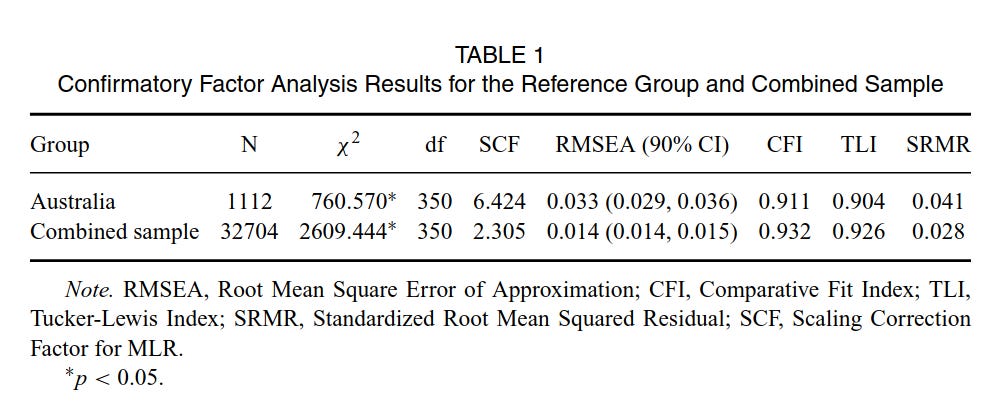
It is pretty weird that the fit of the items in the combined sample is better than to the Australian sample alone. The authors showed that the items don't work entirely the same, and for some groups, not at all the same. But then, this means that combining all the data should lead to worse fit, but somehow they get quite a much better fit on combined sample! Note that this fit is not related to having different factor structures, all the data are fit with a g-only model, with all items loading, the differences they investigated are only due to loading/slope and intercept differences (scalar invariance). 🤔 Do all of these fit metrics have a sample size bias? It's the best idea I can think of. One could just subset at random from the total sample to the size of the Australian sample to check this idea out.