
Classification error and relative rates
Measurement error of categorical variables is tricky

Our latest big project on mugshots and race misclassification by the US law enforcement. It is currently going viral on X:
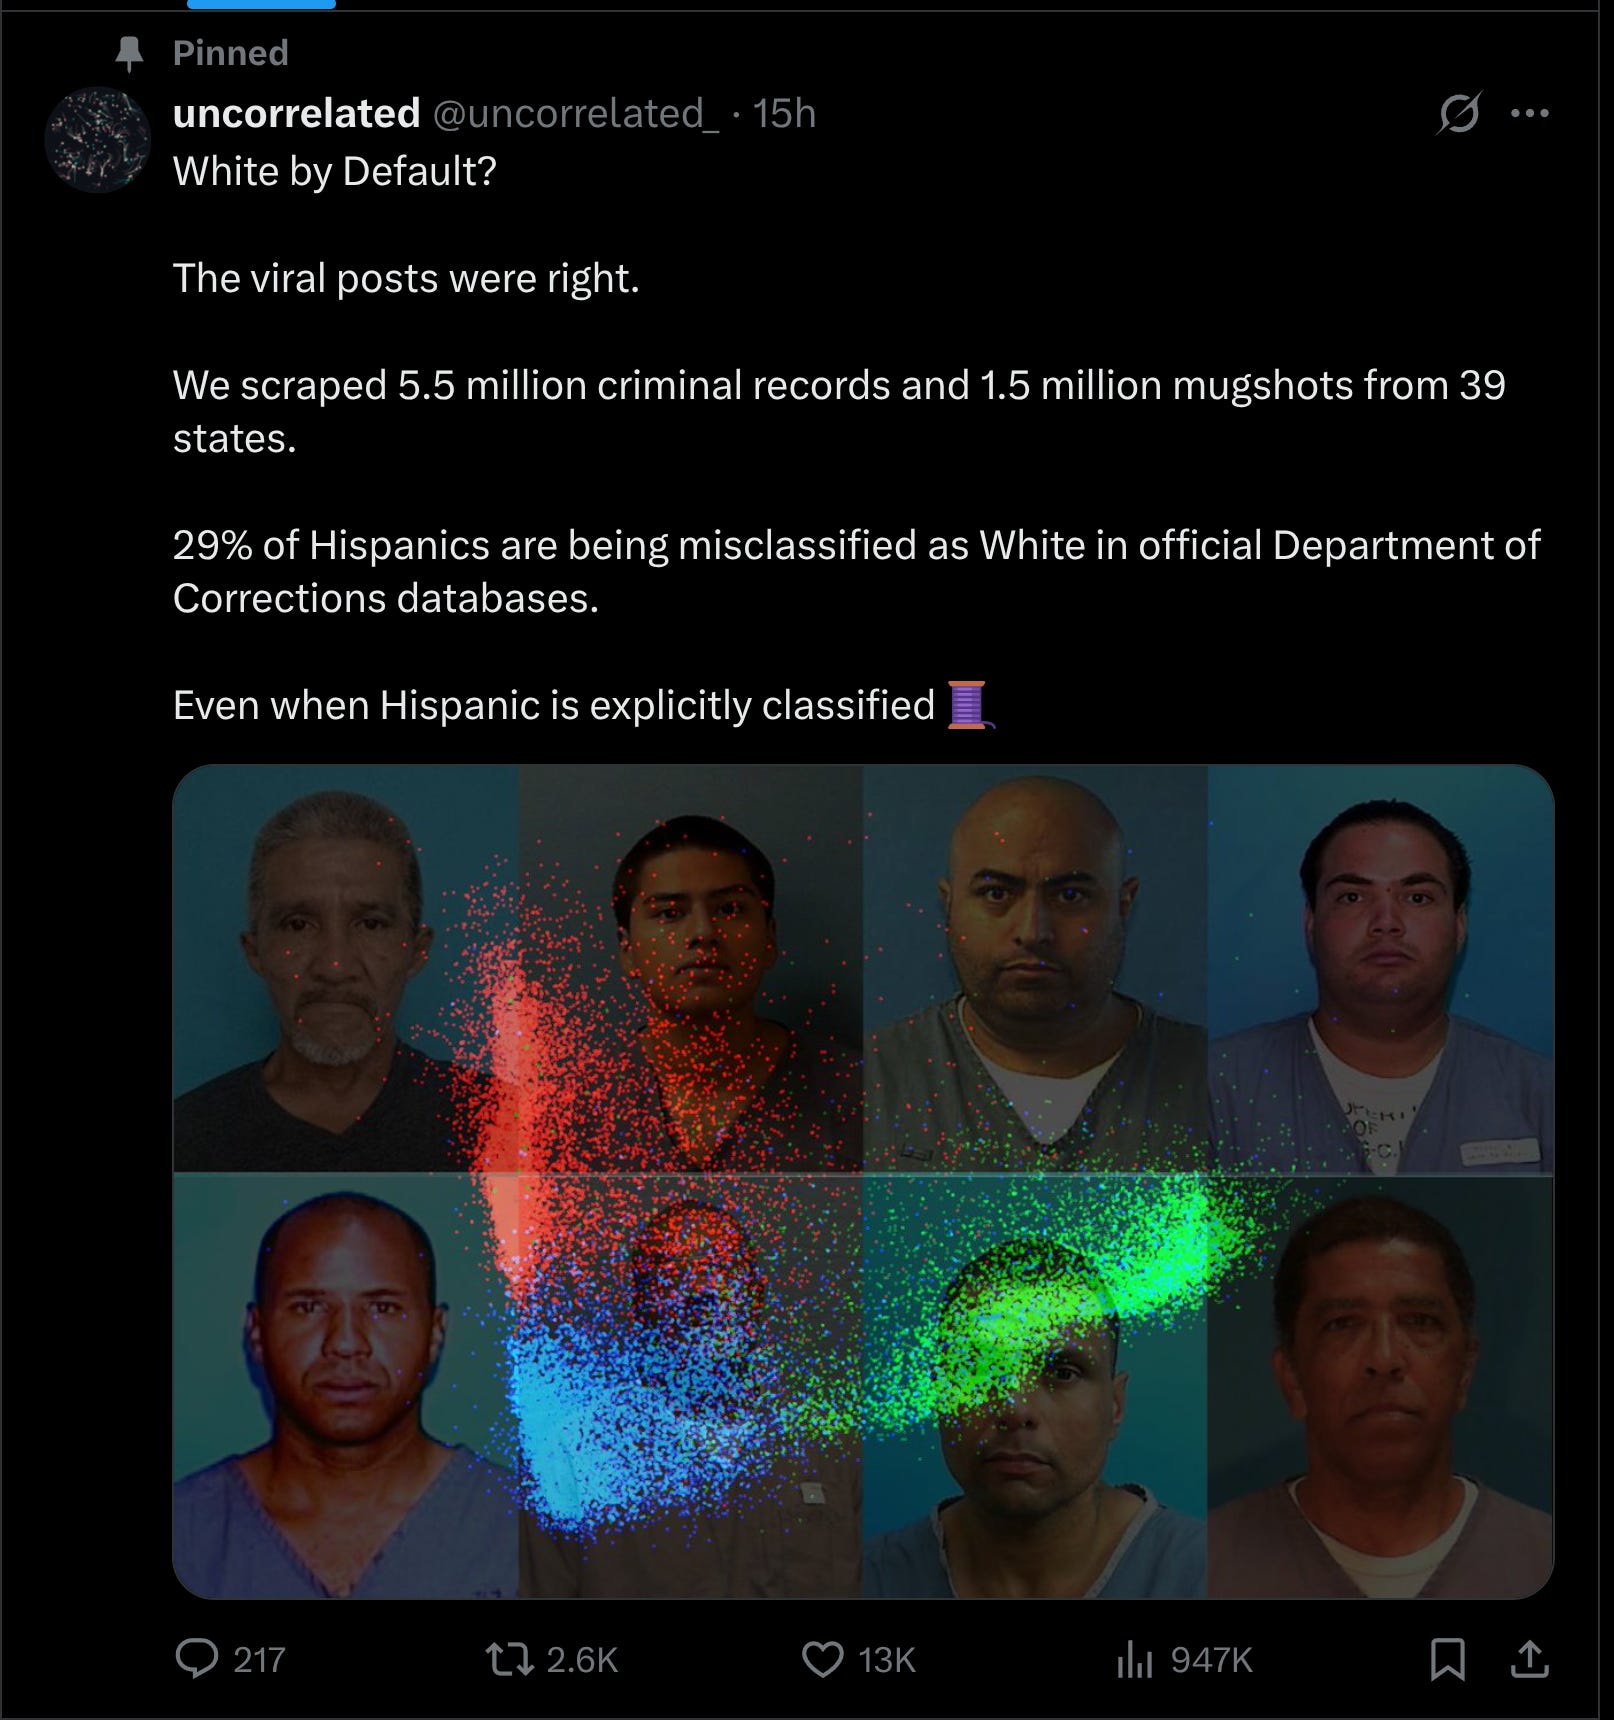
You can start by reading the thread summary, or read the blogpost. There is also an academic paper coming out. The summary is:
We trained a multinomial logistic regression model (k = 18, n = 1.5 million) using racial probability classes extracted from DeepFace’s racial classifier and first and last name racial summary statistics from the US census and Rosenman et al. (2023), achieving 92.76% accuracy in three-race classification (Black, White, Hispanic).
A sufficiently accurate linear model trained on biased data learns the true signal from noise. Systematic deviations indicate mislabeling by authorities rather than model error.
29% of individuals predicted to be Hispanic were officially classified as White by Department of Corrections authorities.
This pattern persisted at high model confidence (95-100%), where 22.4% of predicted Hispanics were still assigned as White.
Correcting for misclassification increases Hispanic criminal record rates by 31%, decreases White rates by 6%, and decreases Black rates by 1%.
Bias between other racial pairings was minimal and symmetrical (equal numbers of Blacks misclassified as White and vice versa).
State-level analysis showed no correlation with political ideology (r = 0.21, 95% CI: -0.36 to 0.67, p = 0.472), indicating random administrative error rather than deliberate bias.
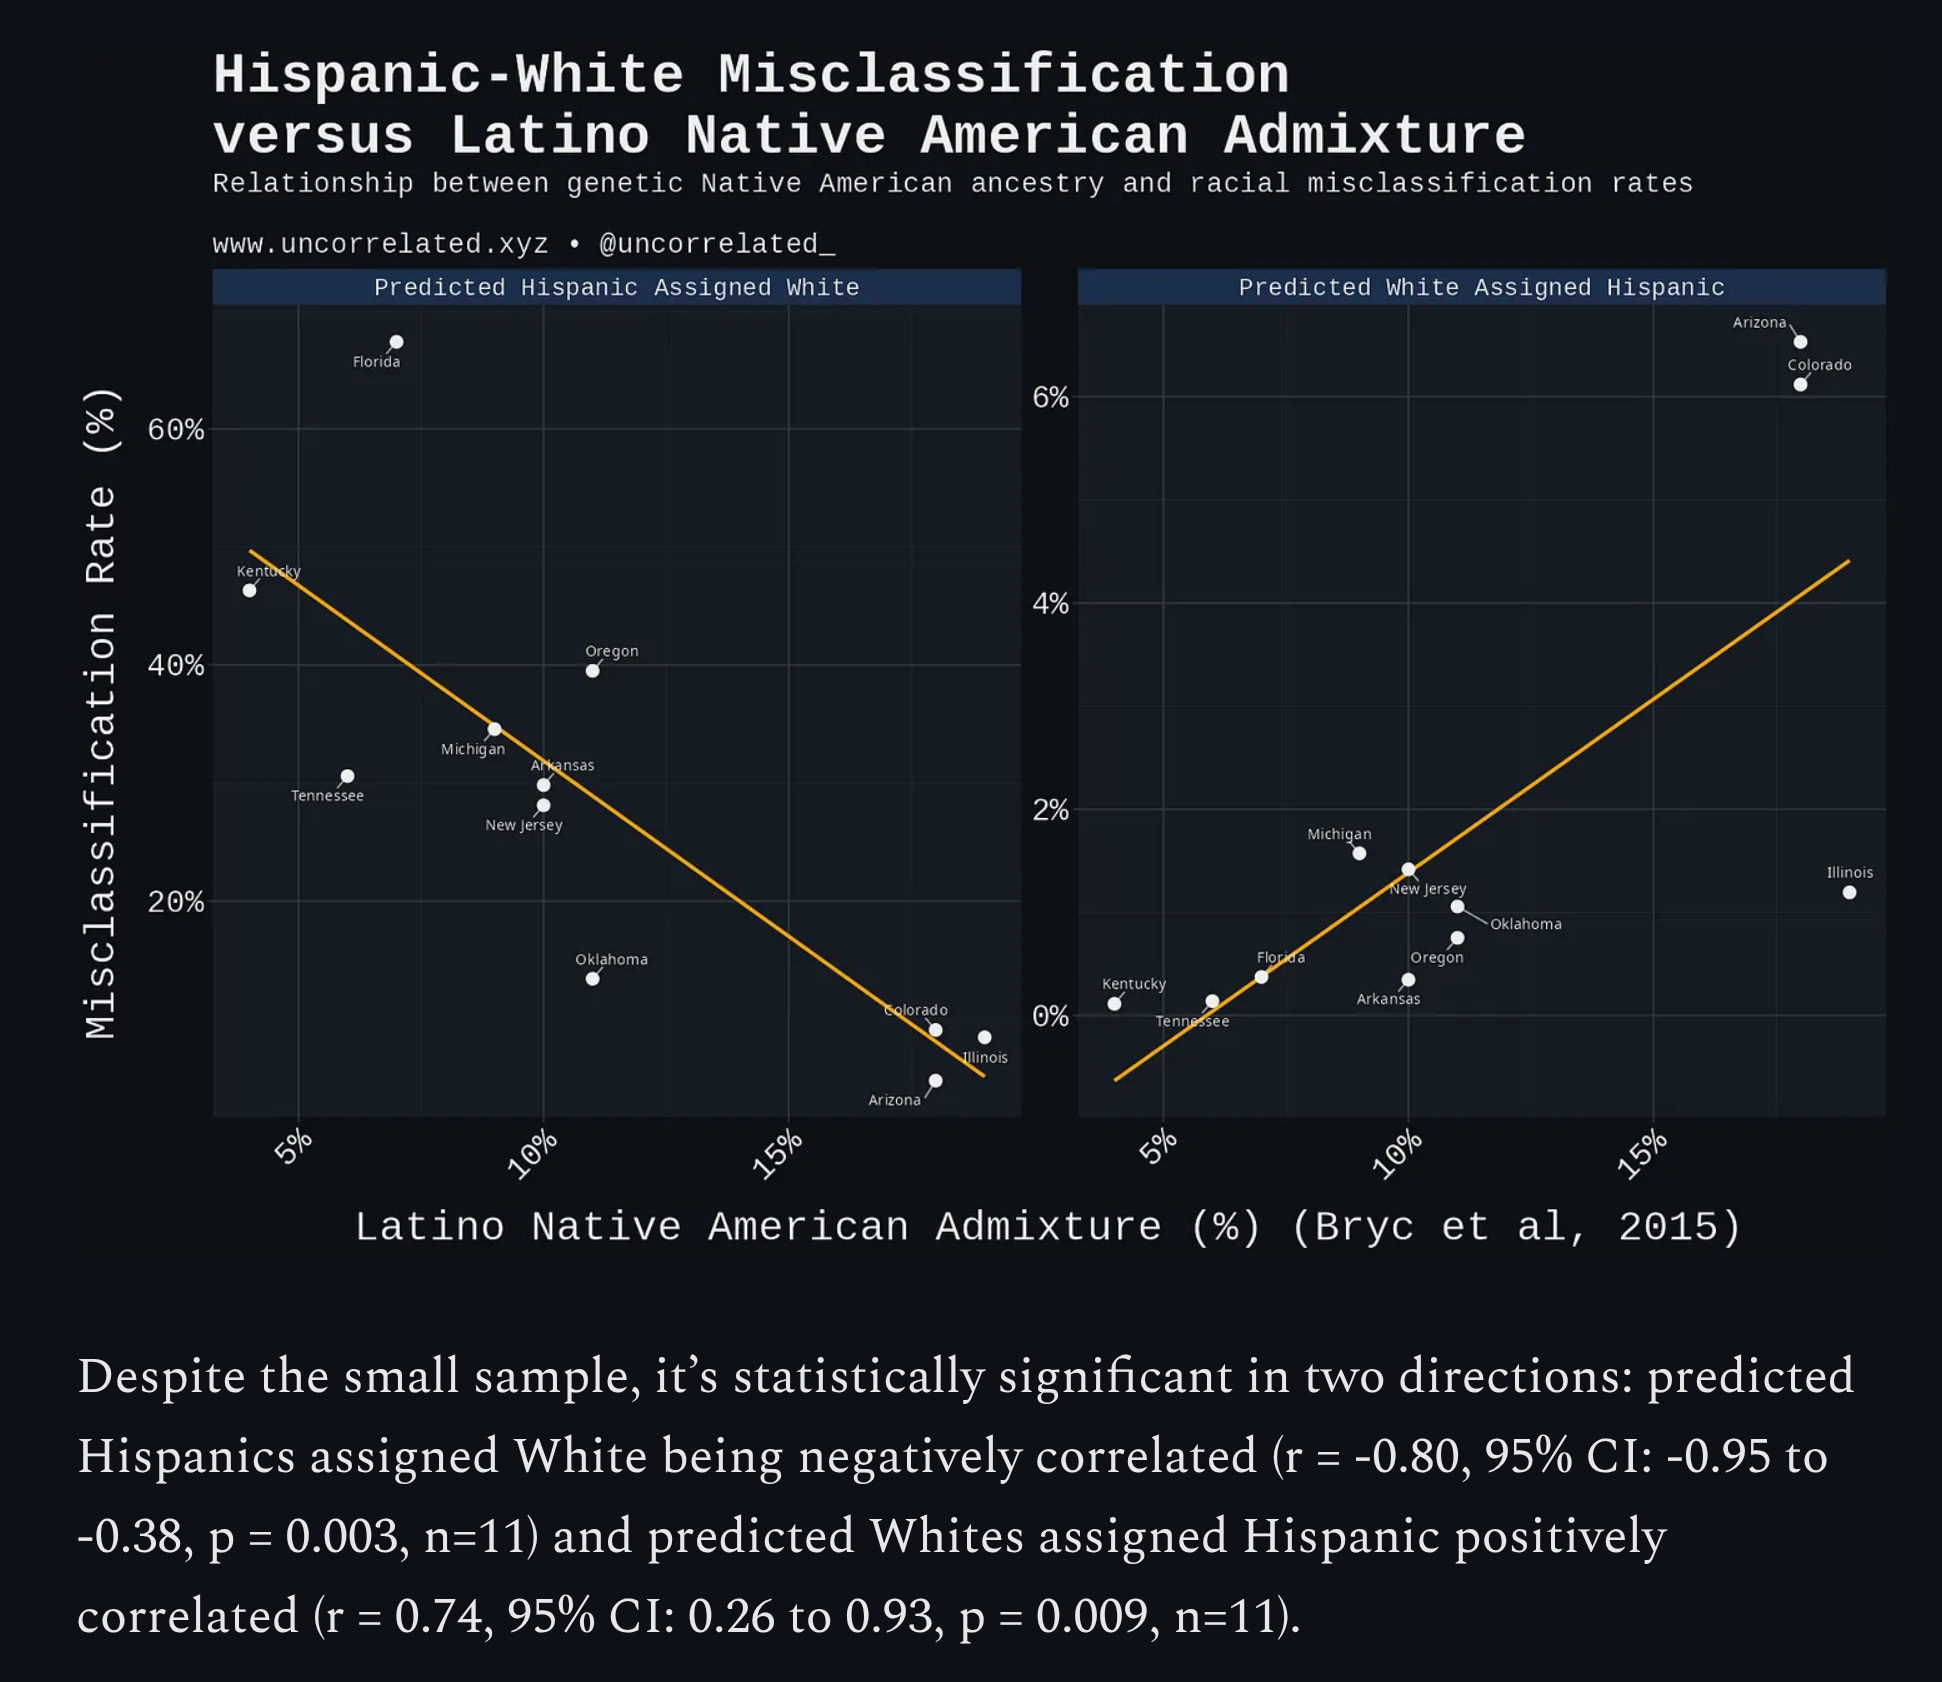
The proportion of predicted Hispanics assigned White (r = -0.80, 95% CI: -0.95 to -0.38, p = 0.003, n=11) and the proportion of predicted Whites assigned Hispanic both correlated with Native American ancestry among Latinos (r = 0.74, 95% CI: 0.26 to 0.93, p = 0.009, n=11).
In the USA, when the police book someone (file paperwork), they classify the race of the person. In some places, they adhere to the artificial race/ethnicity split, whereas in others Hispanic is considered its own racial category. The latter makes things much easier since otherwise one has to subtract the Hispanics from the other groups, which is often not possible. FBI and others then aggregate these data to calculate state and national-level crime rates, from which one can calculate the relative rates (RRs). Because many places use the race/ethnicity distinction, it is often not possible to calculate rates for non-Hispanic Whites since most Hispanics are additionally classified as White.
So far so good, but the key problem identified here is that many subjects are misclassified. This is what all the memes were about the last months. But how does classification error impact relative rates? This turns out to be a relatively complicated matter, so I have done a number of simulations to build our intuitive understanding.
In simulation 1, we have 2 groups, the blues and the reds, and the rate of bad in the blue group is 0.1, and in the red it varies from 0.05 to 0.5 (RR 0.5 to 5). We also vary the classification error. The way the classification errors are made is that a % of subjects are picked at random and then assigned a random group with equal probability (thus, a subject affected by error has 50% chance of getting assigned the correct group at random). This is obviously a simplification of how real life might work out, but allows us to get started. The results are these:
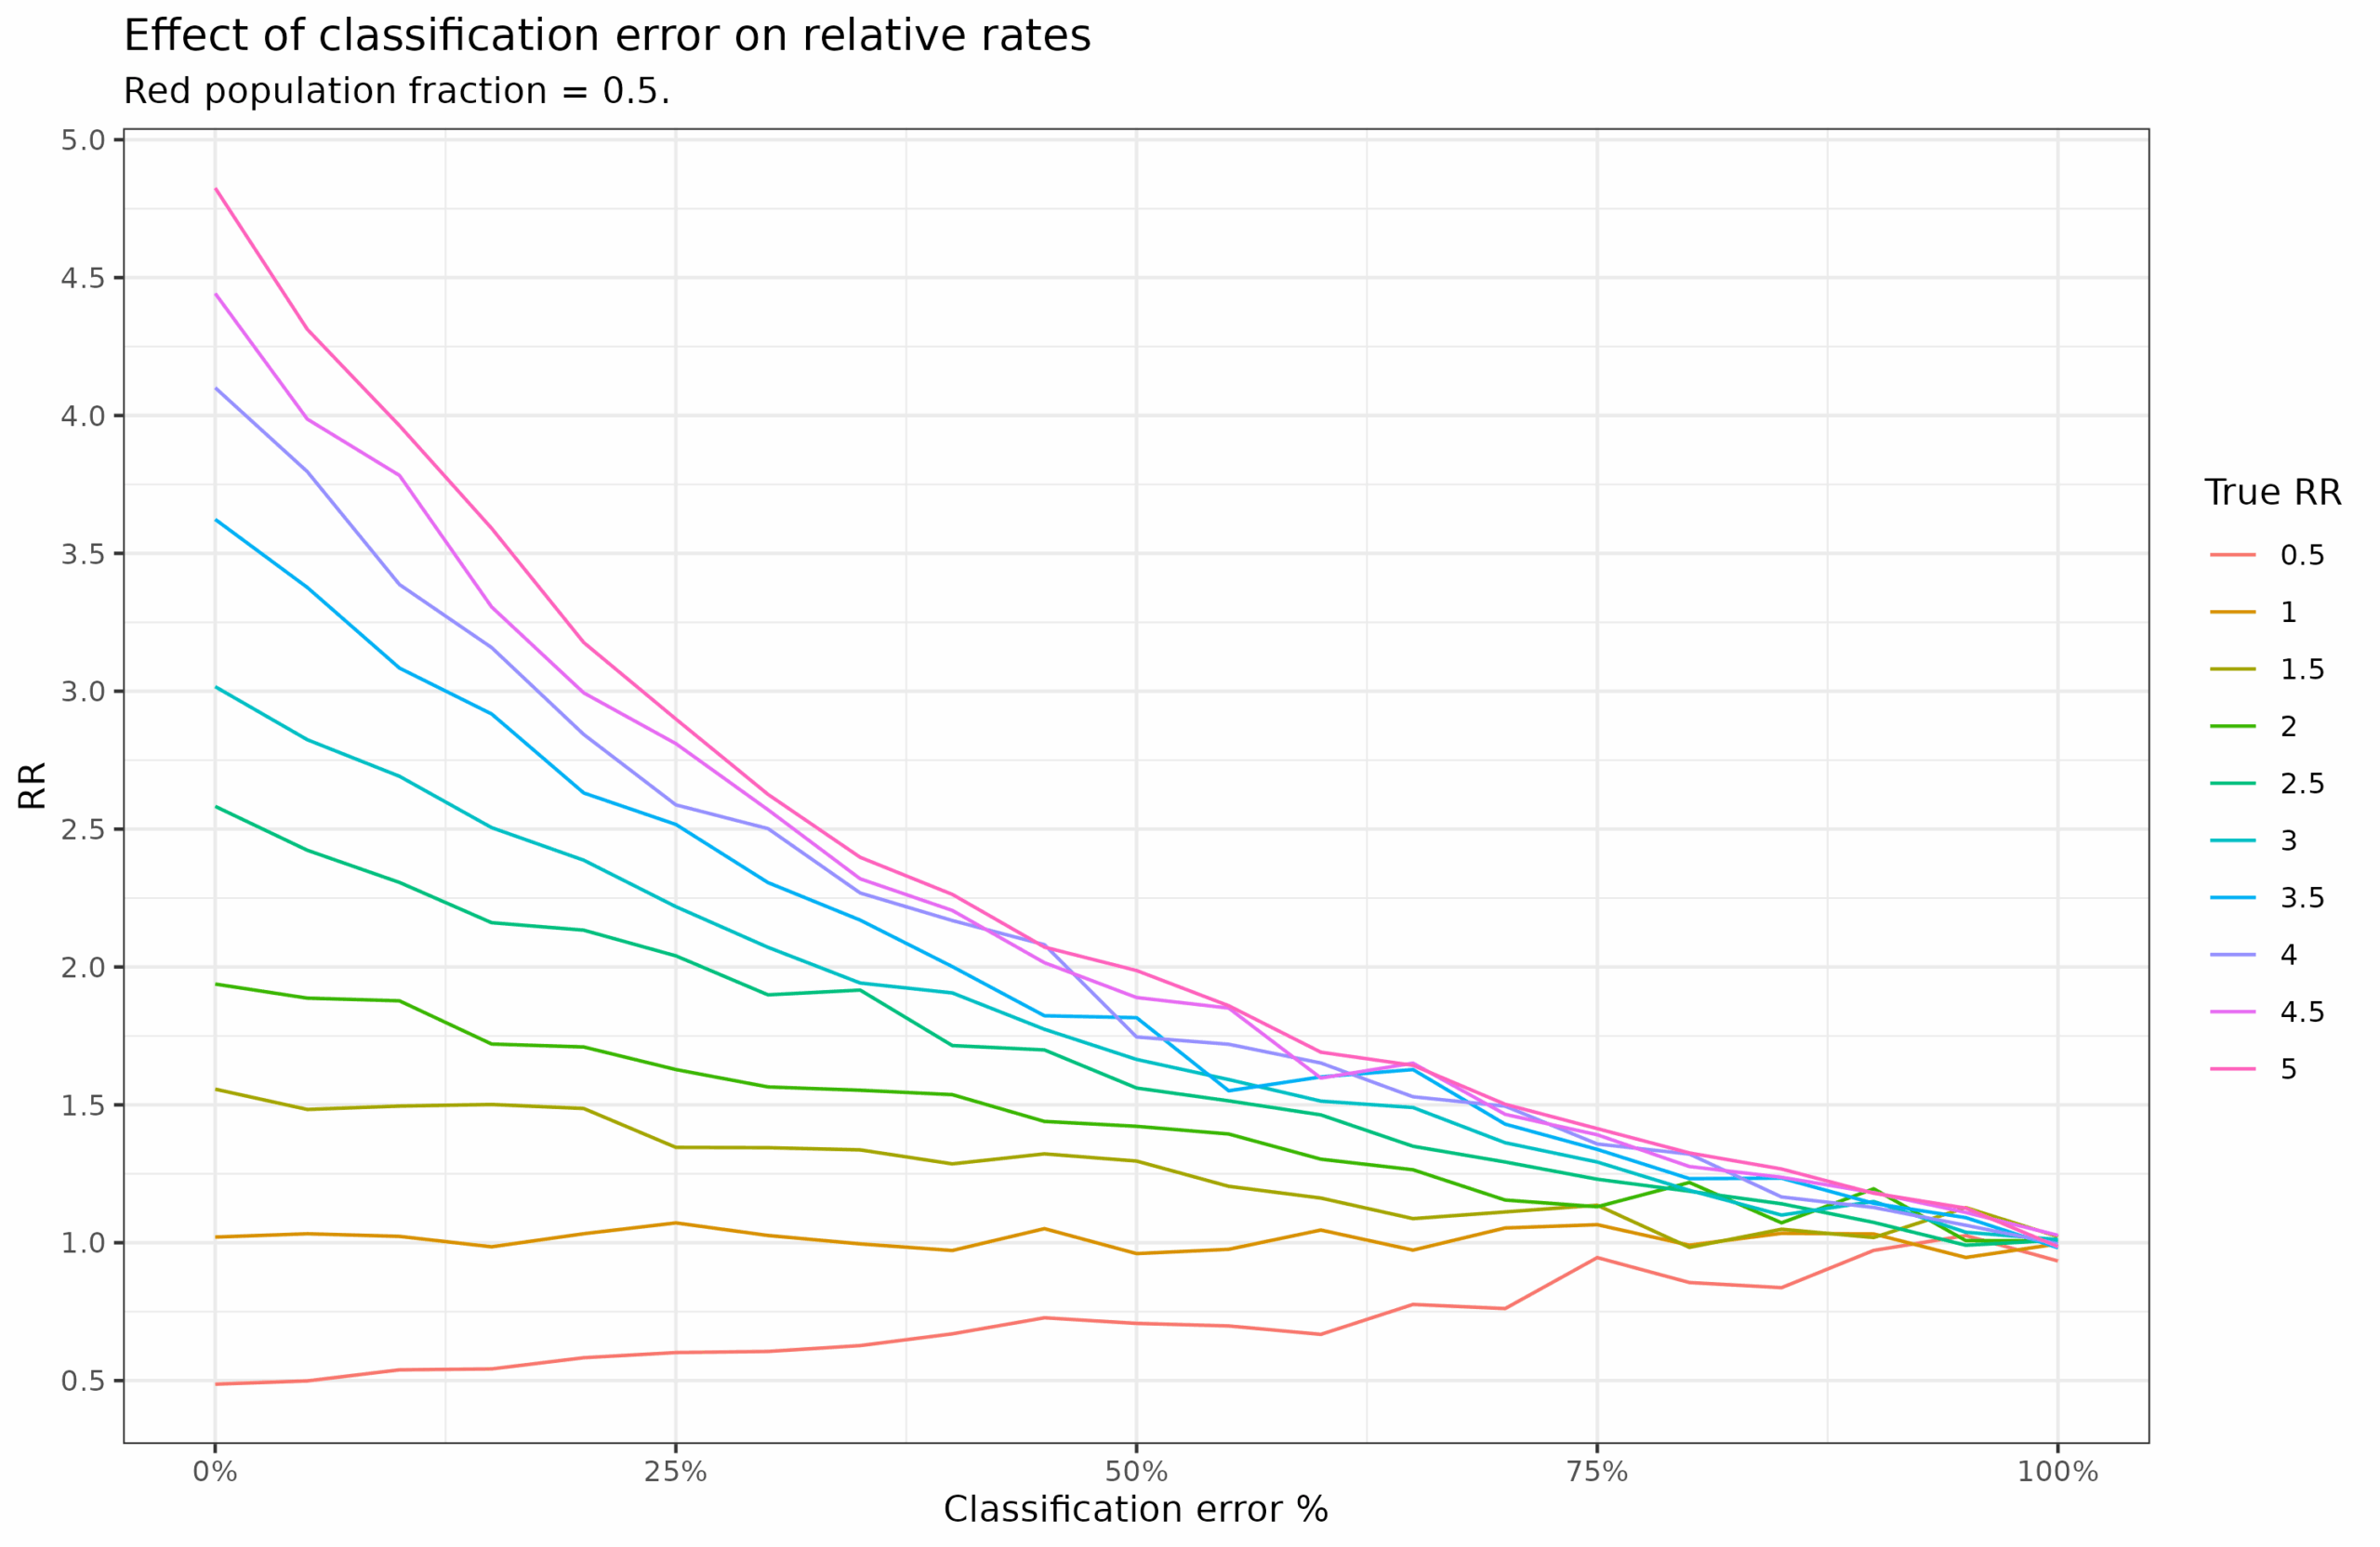
RR is calculate as observed red rate / observed blue rate. In the case of no errors, we see that the values match up to expectations well. E.g., in the simulation where red has a true rate of 0.05, it has an observed RR of 0.5 as well (red line in bottom). Note that in this simulation the groups have equal sizes, 50% of the population. As the misclassification rate goes towards 100%, the RR goes to 1 no matter its initial value. This makes sense, if you randomly swap all subjects group labels around, each group will end up with the same rate, and thus the RR will be 1.
What if red is a minority population? Let’s set it to 10%:

When red is a minority, the effects of error is larger and the RR moves closer to 1 faster.
This gives us the idea that errors always diminish the RR, but this is not true. In real life data, the population counts are based on census data, not the mugshots, and thus the denominator has a different error rate, probably smaller. (You can’t calculate rates for mugshots since you only observed bads, not the non-bads.) In simulation 3, I assume the denominator has 0 error (true population fraction is used for the rate calculation). This dramatically changes things:

Now error makes the RR increase, not decrease. Why is that? Well, we can work out the expectation in the limit of 100% error. In this case, the population fractions used for calculating rates are constant at 0.9 and 0.1, but the bad counts get distributed to 50-50% at 100%. Thus, even a minority group with a below average rate (0.05) will get assigned half the bad counts and thus their observed rate will become much higher, and so will the RR. The expectation is:

Thus, working out the math the rate for red should be about 0.475 (we see 0.494) and the RR should be around 9 (we see 8.96). Thus, when the denominator is fixed -- as it is with mugshot based calculations -- measurement error works against any minority group.
In simulation 4, we confirm this result by instead varying the population fractions:
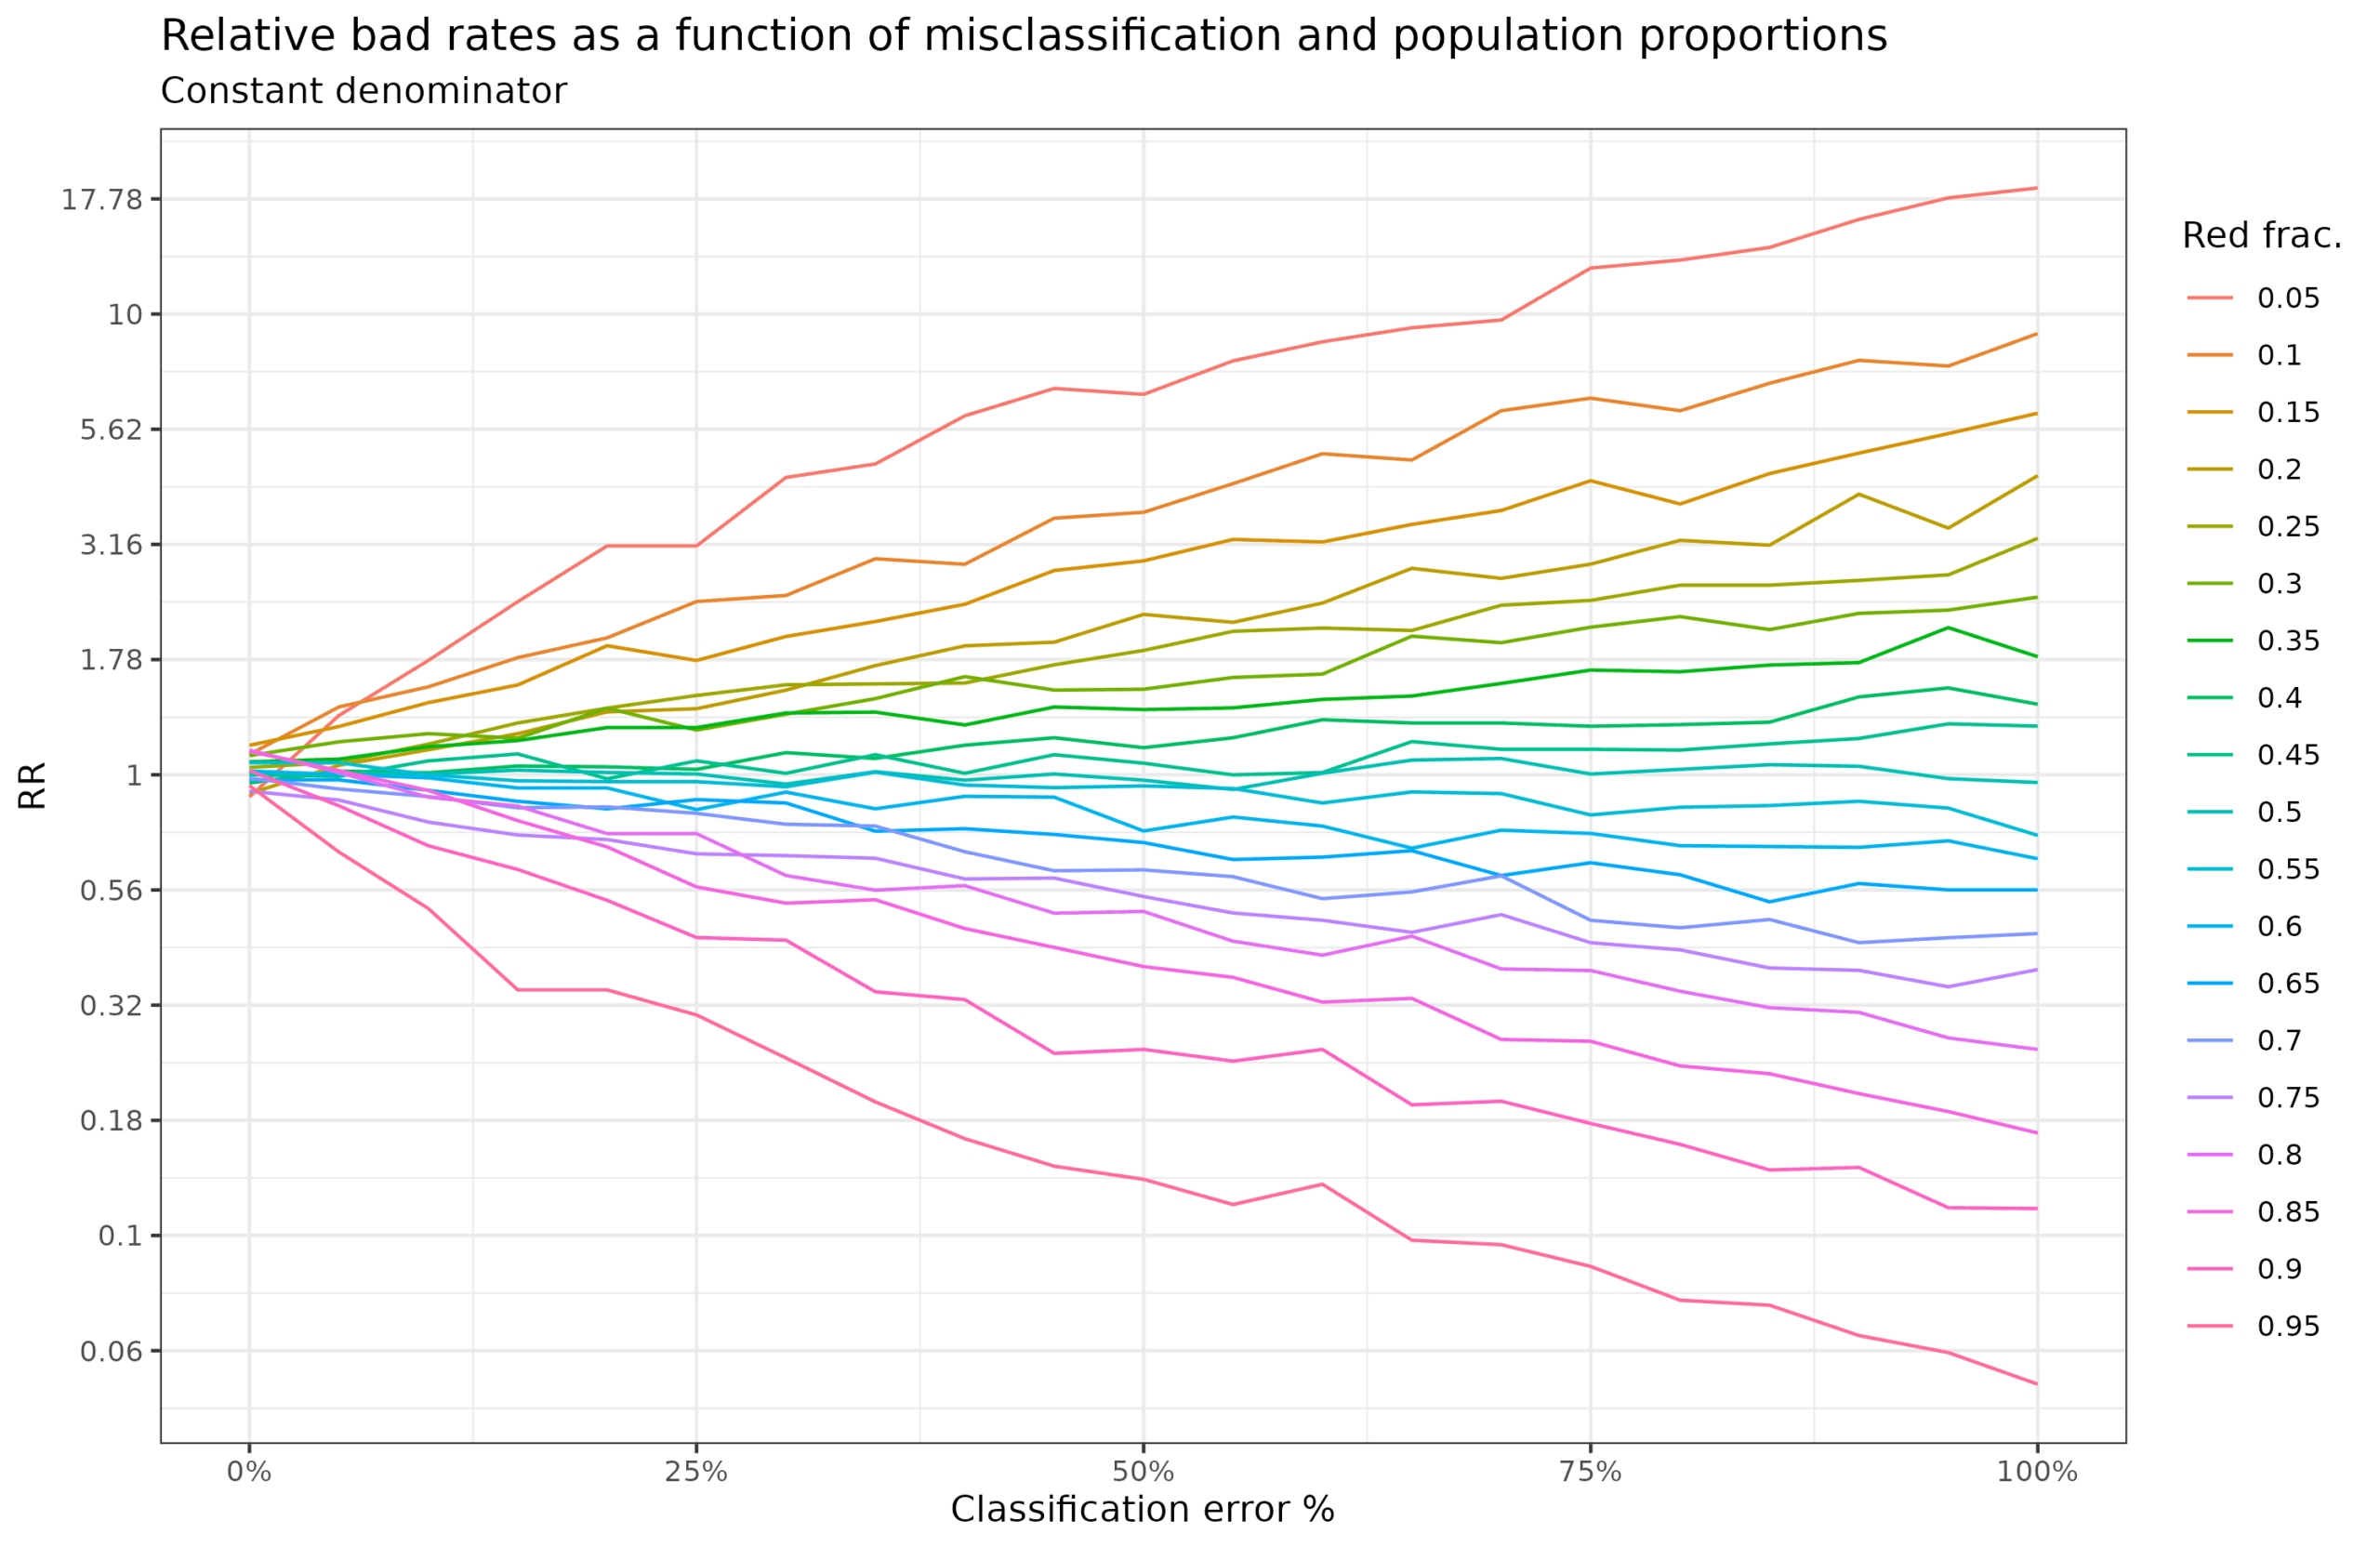
In this case, the red rate is the same as the blue, so true RR = 1. When red is a minority in the population their fraction among the bads becomes much larger as a function of random classification error, and the reverse when it is a majority. We can work out the expectations again and compare with simulation results:
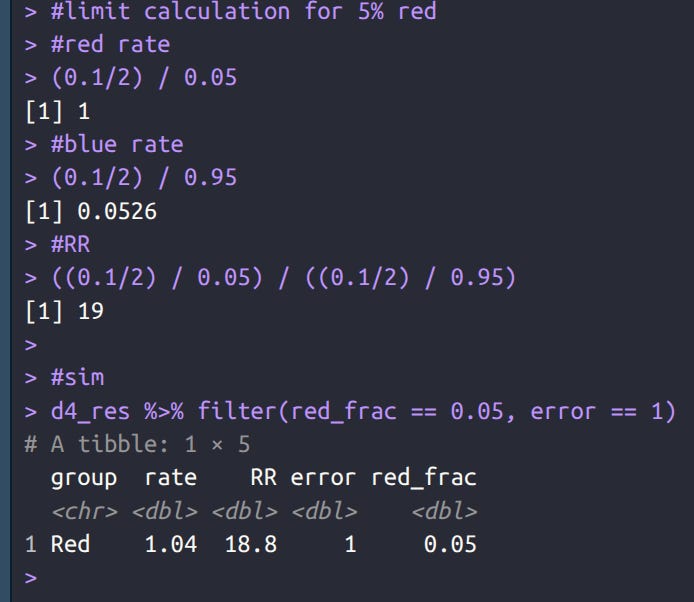
Again the results match, we expect an observed rate of about 1 (we see 1.04), and a RR of about 19 (we see 18.8).
So can we adjust the real life data correctly somehow? Well, the problem is that we don’t know the true error function. The simulations above used an unrealistic random assignment blind to population proportions. In reality, when police clerks book someone, they don’t roll dice to assign people’s races with equal probabilities of Black/White/Hispanic. Rather, the edge cases in that context have some chance to get assigned to one race or another. This is why the error rates are predicted well by the European% among the Hispanics across states with data:
The European% ancestry among Hispanics (self-id) comes from 23andme customers, which has elite selection. However, this probably doesn’t matter so much here (since the elite selection inflates European% in every state).
The fundamental problem here is that Hispanic is not a real racial cluster, since it is a (relatively) recently admixed group with mainly European and Amerindian ancestry, with a bit of African. Any objective classifier can attempt to find the centroid of this somewhat synthetic cluster and assign people accordingly based on their visual appearance and name. It will not achieve perfect accuracy in this task due to the data limitations (sample size, photo quality, name distinctness). It probably does better than the police’s own classifications, however, which is why it is preferred. It is probably not too biased, and thus the results should give us a more accurate view of crime rate differences between races. What the police data reveal is that the standards for what counts as Hispanic differ by US states presumably reflecting the kind of Hispanics they have in that state. It is not a coincidence that Florida has one of the highest error rates because Florida has a lot of relatively ‘White’ (European) Hispanics from Cuba.
In summary, we can conclude that:
There is a large amount of error in the racial classifications filed by US law enforcement.
There are some random errors, but most errors consist of classifying (what most people consider) Hispanics as Whites, which lowers their crime rates.
When population counts are not affected by random error, the errors inflate crime rates of smaller population groups and deflate those of larger groups, thus, this will deflate White rates and inflate Black and Hispanic ones, thus decreasing the observed RRs.
When errors are asymmetric, this deflates the rate for the group they are assigned away from (Hispanics) and inflates the rate of the group they are assigned towards (Whites). This is why the recalculation of RRs show that Hispanic crime rates is underestimated.
I don’t see a feasible way to attempt to adjust the results for any remaining random errors since the rate is unknown. Since it is probably small, the effects shouldn’t be too large except for very small population groups (e.g., Asians in Kentucky, not included in the study).
Water is wet
Grandpa had to choose whether to emigrate to the US or to Argentina. Unsurprisingly we can’t read his mind using a picture of his grandson.