

A decade ago I got into my first media circus by scraping the OKCupid dating site. The site uses (or used) a novel approach of having users answer 100s of questions and having them match with each other. It was the only dating site/app that embraced assortative mating as a fundamental aspect of finding the right mate. This also made it incredibly valuable from a scientific perspective. The questions were not the typical ones in scales made by academics, but covered uncouth topics like preferred sexual positions, and intelligence. We scraped data for some 60000+ users, which was only a fraction of the users who had filled out many questions. Specifically, we targeted those that had filled out 500+ questions. These are less representative but provide more data. There were millions of users who had filled out only a few, which wouldn’t be so useful for analysis.
If you are familiar with personality psychology you know that there are endless debates about how many and which dimensions to rank people on. The Big Five (OCEAN)/5-factor model has been winning this battle for some decades, but before that it was Eysenck’s 3-factor predecessor, and before that Cattell’s 16 factor. Eysenck’s model has been mostly incorporated into the 5-factor model (except for psychoticism). Instead now we have the 6-factor HEXACO model, the alternative 5-factor model, as well as various simplifications, the big 2 (E+O, C+A+N), and the general factor of personality (GFP). However, I wanted to redo this work using the OKCupid data. This presented some interesting issues:
There is a lot of missing data because not everybody filled out every question, and some users specifically skipped some questions, or answered them in private (you could hide responses from others, so the scraper would not get them either).
The data structure is mixed. Many items are binary, some are ordinal (the options can be ranked from most to least something), and some are nominal (can’t be ordered). Analyzing mixed items is possible for factor analysis but requires specialized item response theory (IRT) models.
The dataset is large, so it took a very long time to fit the models, or impute the data. Like over a week even on a strong computer.
I had done some of this work years ago, and found the first few dimensions, but it was taking too long and I wasn’t happy with my methods. Fortunately, with the power of AI, I was able to revisit this question and get more decisive answers. Claude was able to rewrite the IRT software to use GPUs, which greatly sped up the model fitting time (by like 50x in core-time comparison but I have 16 CPU cores, so on average GPU was about 3x faster assuming full use), to the point where it was feasible to try out many models.
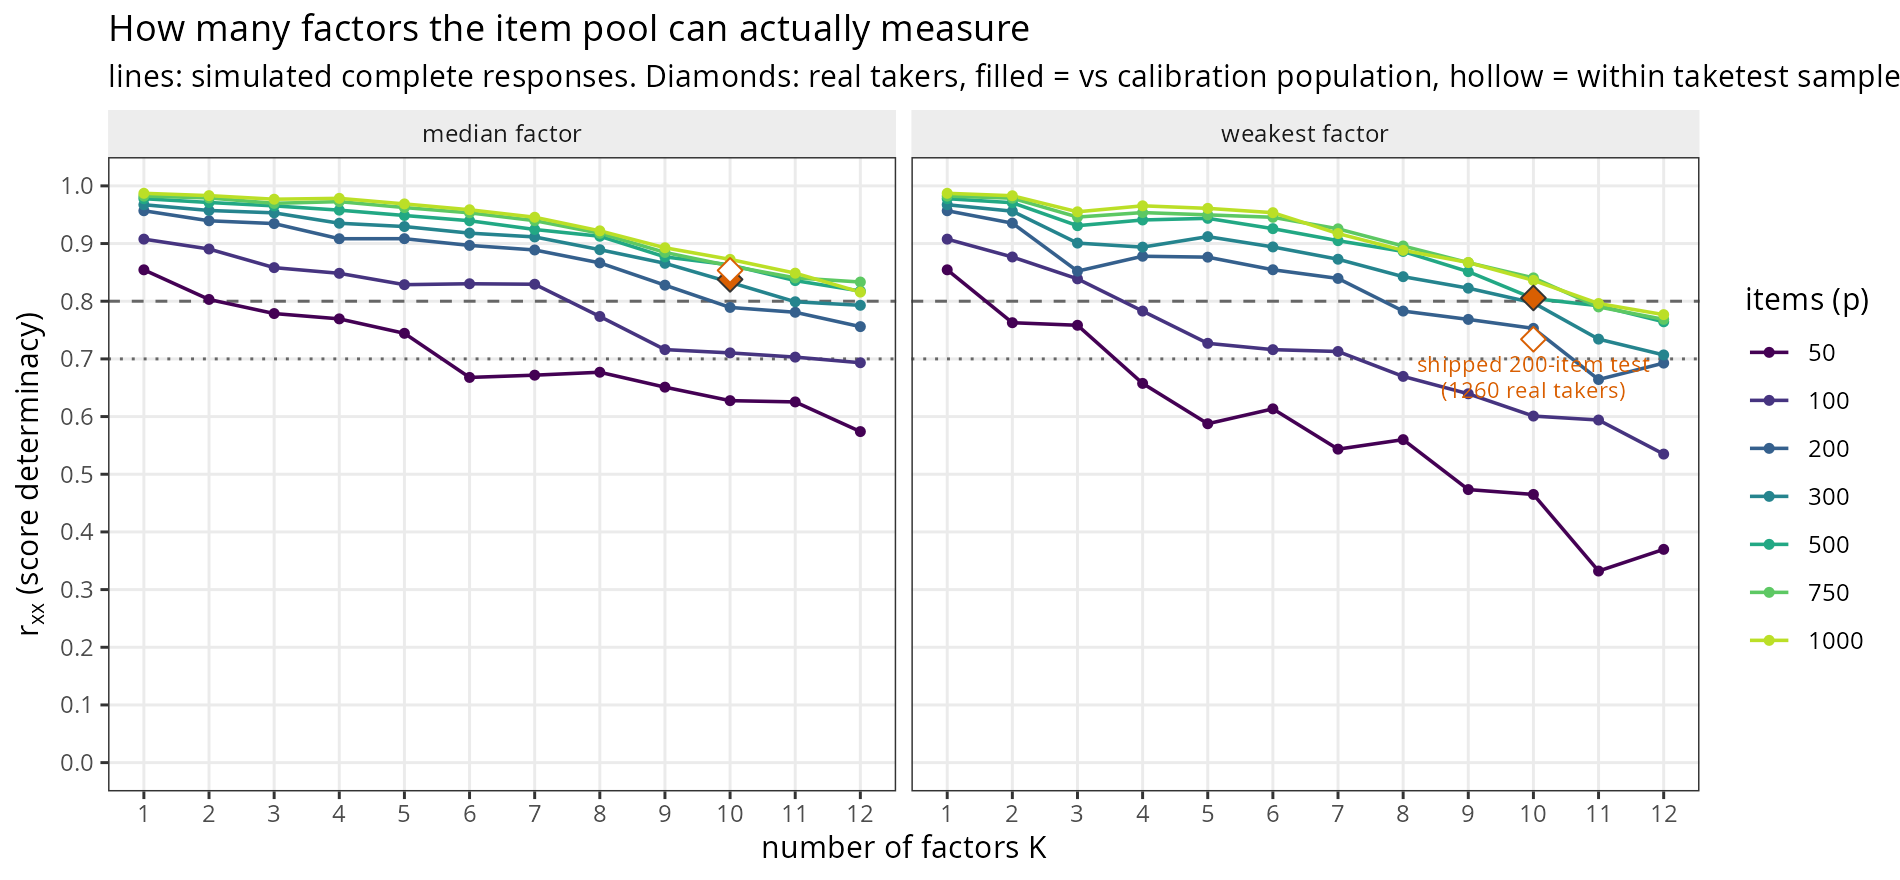
Generally speaking, we wish to know how many dimensions to extract. The standard answer in psychology is to use the various factor estimation methods with parallel analysis being the preferred option. The thing is that this always gives you a very large number when you have many cases because it is testing the actual seen structure vs. randomly generated responses. Just because parallel analysis or some other method says you should extract X factors (or the data supports it), doesn’t mean these are meaningful or reliably measured in that dataset. They may consist of just 2-3 items out of 100s. Since I wanted to make a practically useful test to put on the site, I wanted each dimension to be relatively reliable (at least .80) and rely on more than a few items. To figure this out, I explored 2 parameters: 1) the number of factors to extract (k), and 2) the number of items to use (p, in order of those with the most data in the database). Trying out the combinations of these values took a while (like 2 weeks on my strong computer even after changing to GPU fitting), but I am ready to present the results in brief. I guess I will eventually write up the full results, but building stuff with AI is much more interesting than writing academic papers, so I’ve been slacking off in that department (unlike the academics, I don’t have much financial motivation to write papers). So without further ado, these are the results for the estimated reliability of the least reliable factor as a function of those 2 parameters:
Alternatively, one can think of how adding another factor impacts the reliability metrics at a given item count:
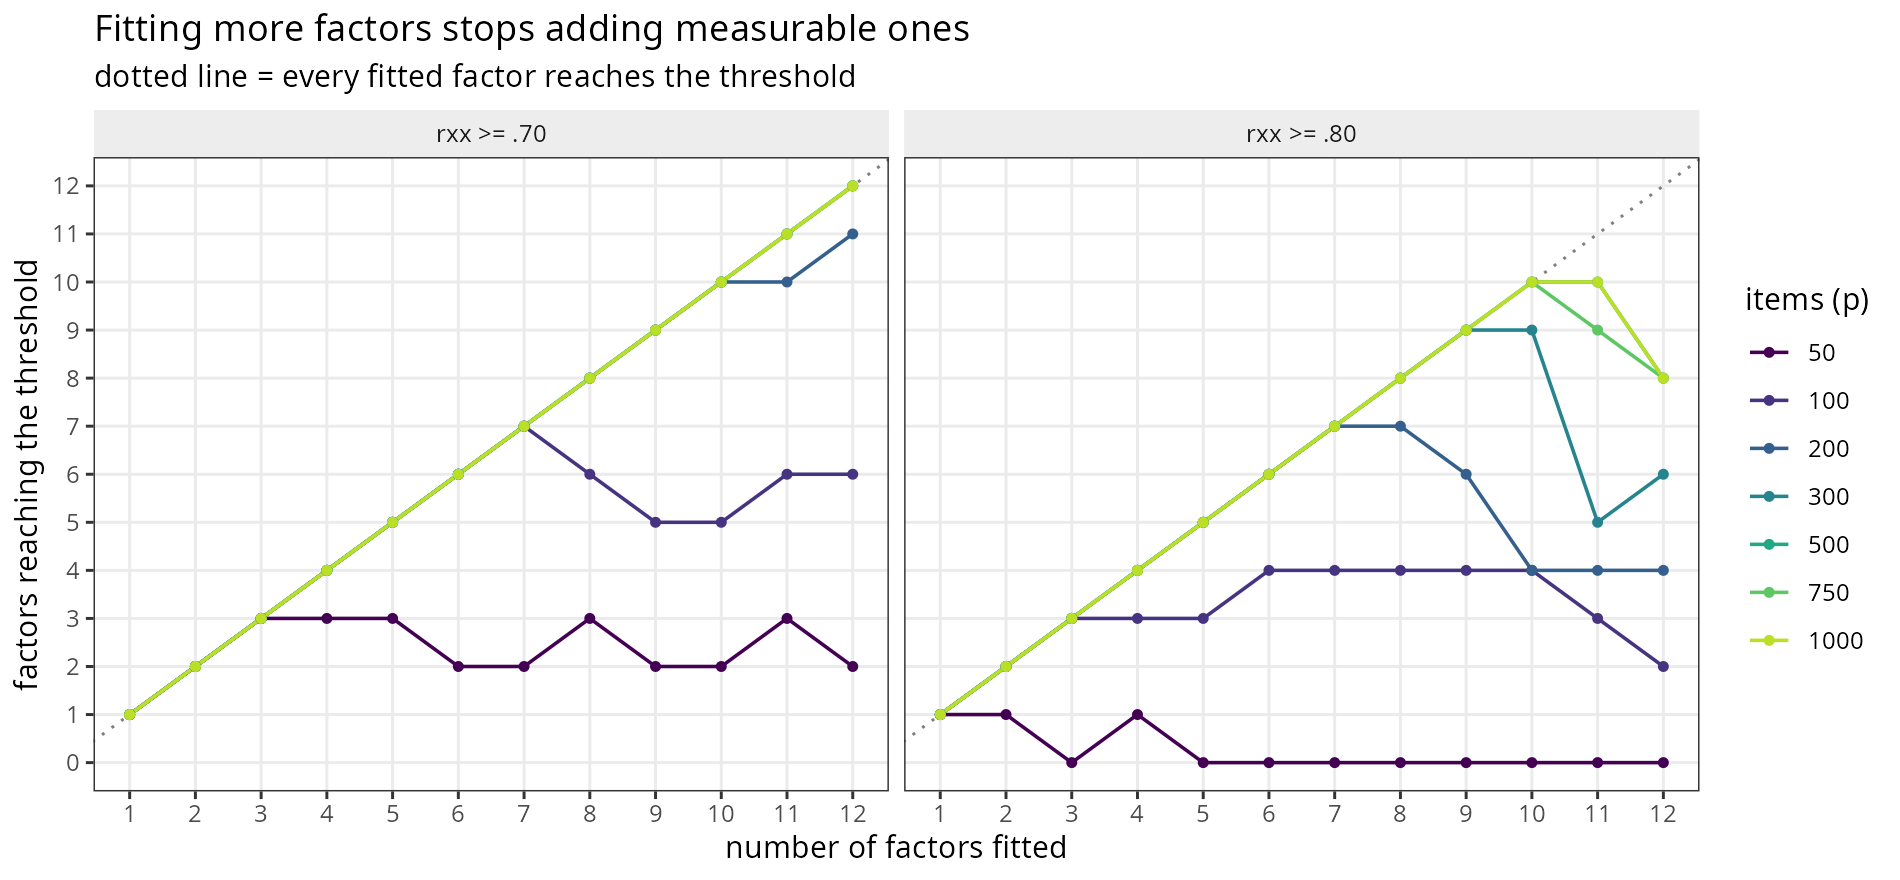
Thus, in these data, the breakpoint is k=10 factors which is what I used for the scale on the site.
However, one can go further with the optimization. One doesn’t have to use the first p items from the site, but one can explore a larger number of items and pick an optimal subset. Thus, it becomes a variable selection problem after the exploration stage. Using the same criterion as above, I found that one needs about 200 items to reach .80 reliability for the 10 factors of interest. This approach explicitly uses cross-loadings to boost reliability. Most personality scales avoid items with cross-loadings because the scales were (and are) optimized using a simple metric of internal consistency, Cronbach’s alpha. This metric becomes 1 when every question is essentially a duplicate, which is why so many scales have many duplicate questions. This is very inefficient from an information gathering perspective. One would prefer quite dissimilar items that measure multiple aspects of personality at once. (I got this perspective from this blogpost.) This is what the OKCupid scale implements. My results look like this:
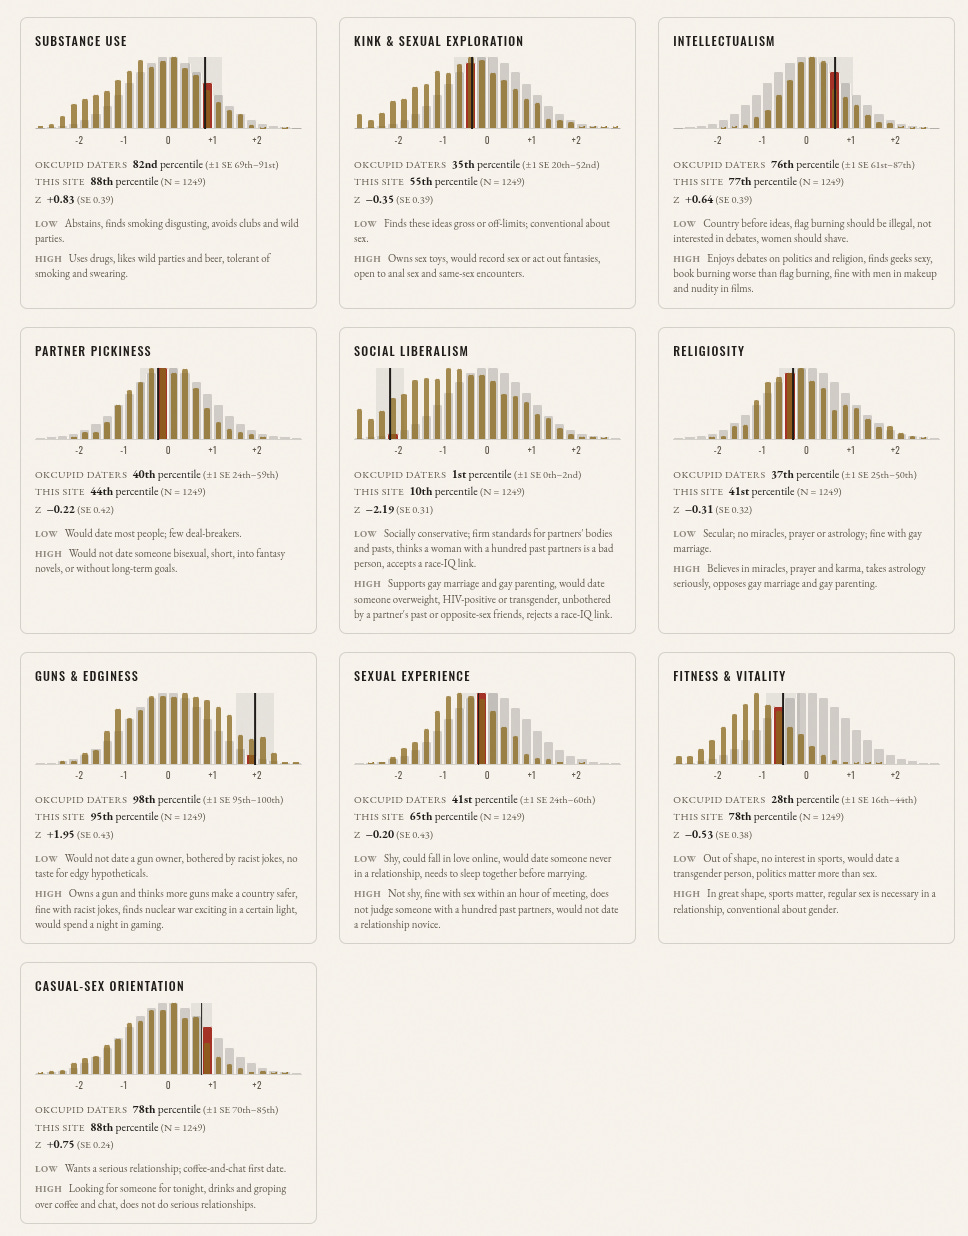
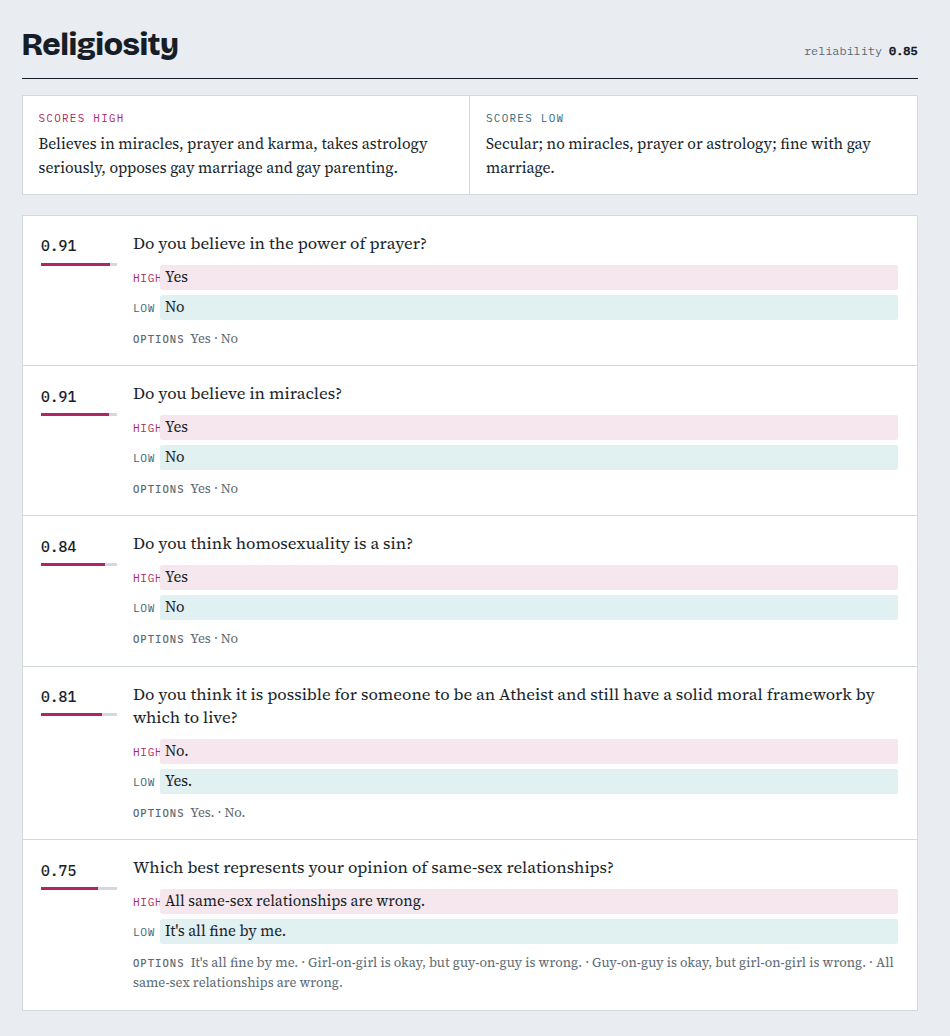
Some somewhat amusing results. This is largely because the scales are impure. There are multiple questions about guns -- this being an American test -- which tend to go with edginess. I’ve never even shot a gun, but still got a high score due to a fondness for inappropriate humor. Here are the top 5 most important questions for each dimension:
Casual-sex orientation:

Fitness & vitality:

2 questions are actually about transsexuals.
Sexual experience:
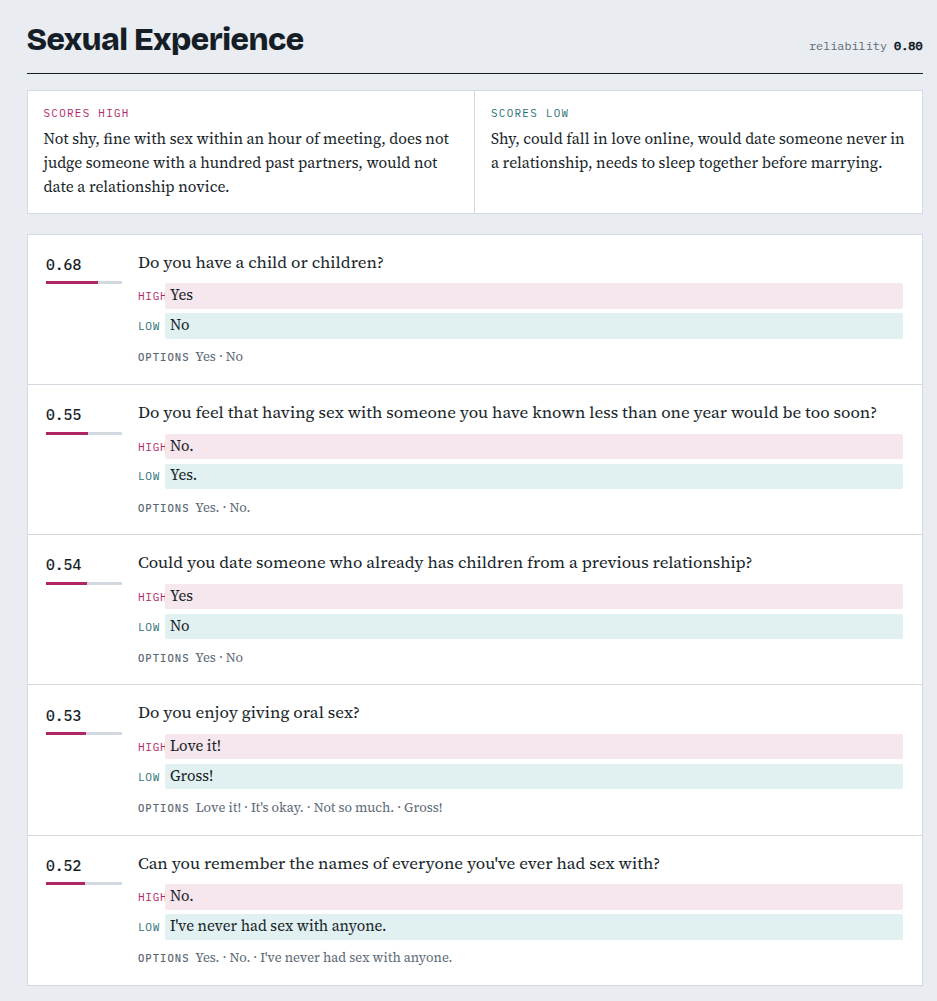
One question is actually about the user’s own fertility and another about potential partner’s fertility.
Guns and edginess:
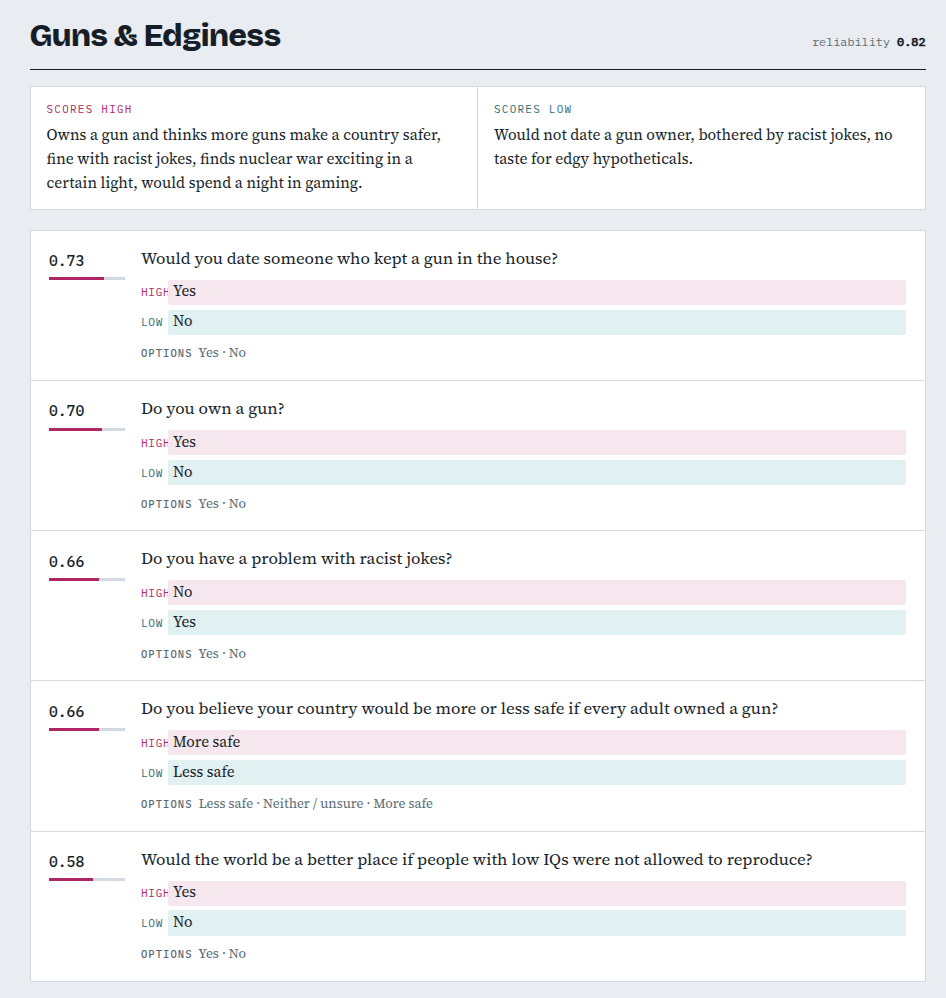
Notice how 2 questions are actually about race and eugenics, not guns or crude humor.
Religiosity:
Social liberalism:
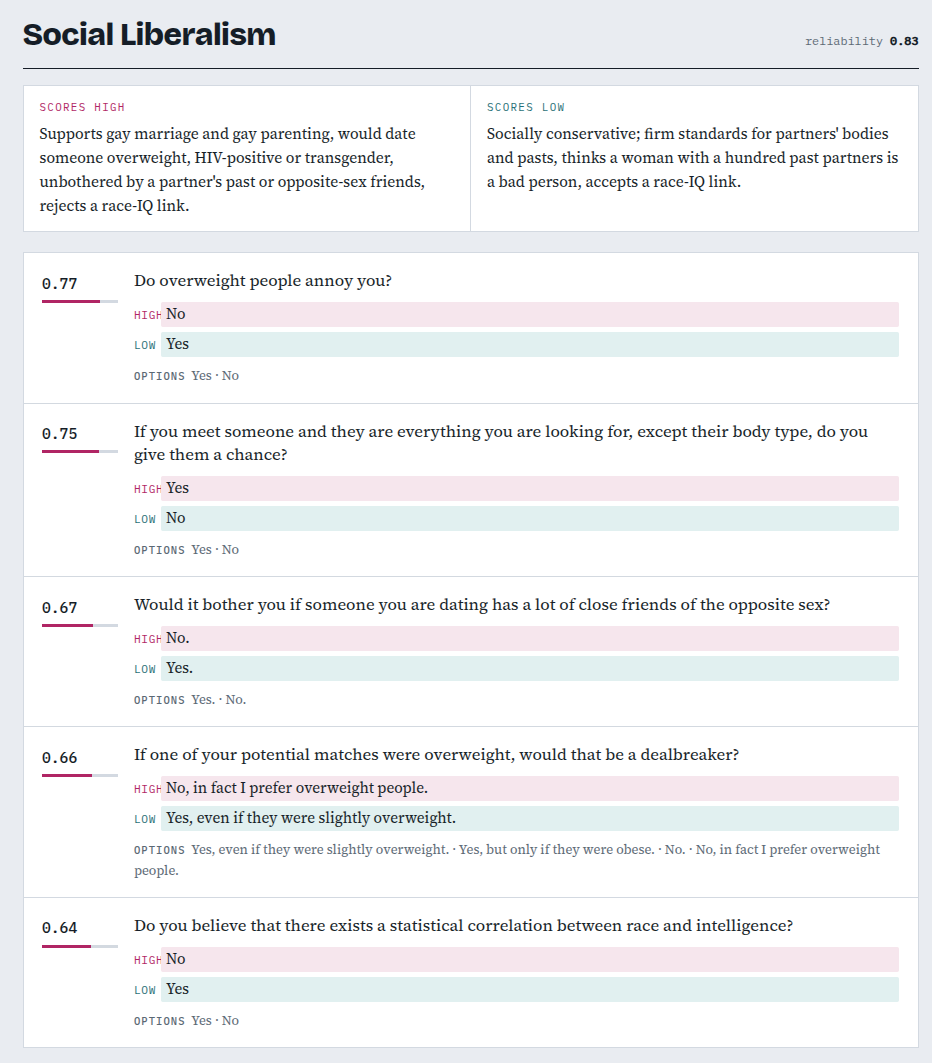
Yet another question about race.
Partner pickiness:
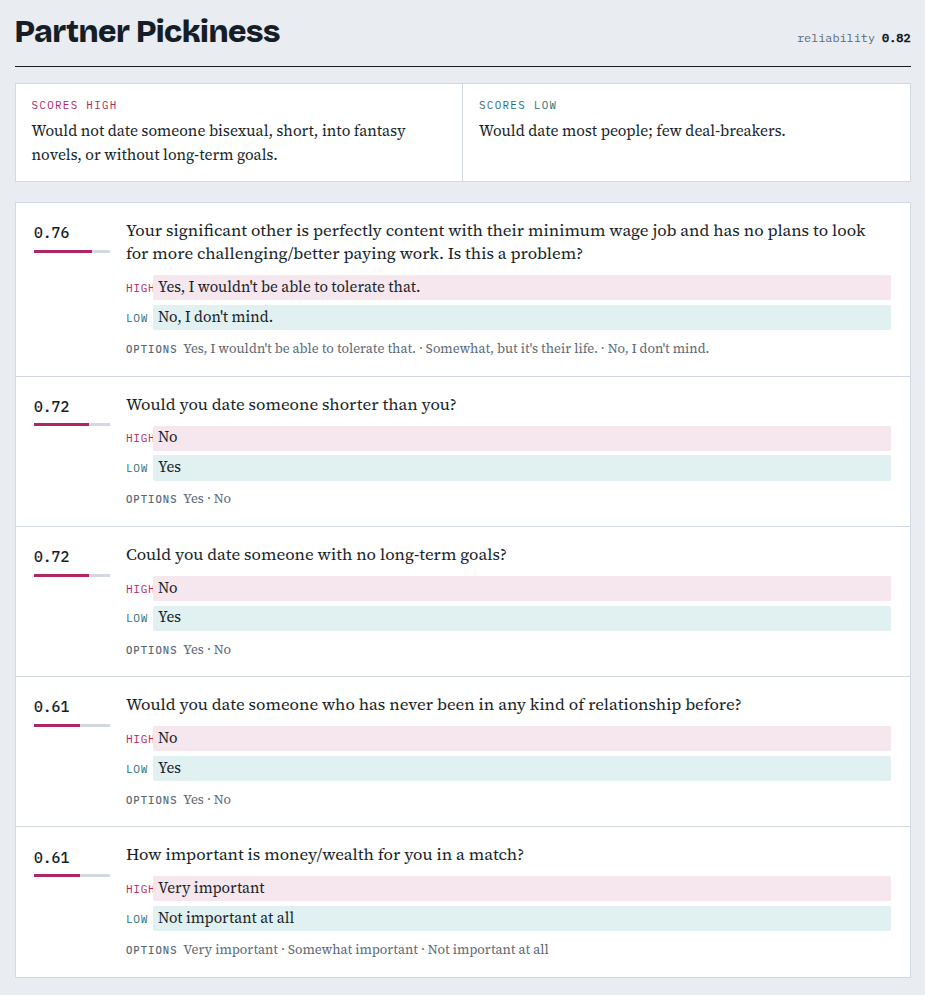
Some of these questions are quite sex-specific.
Intellectualism:
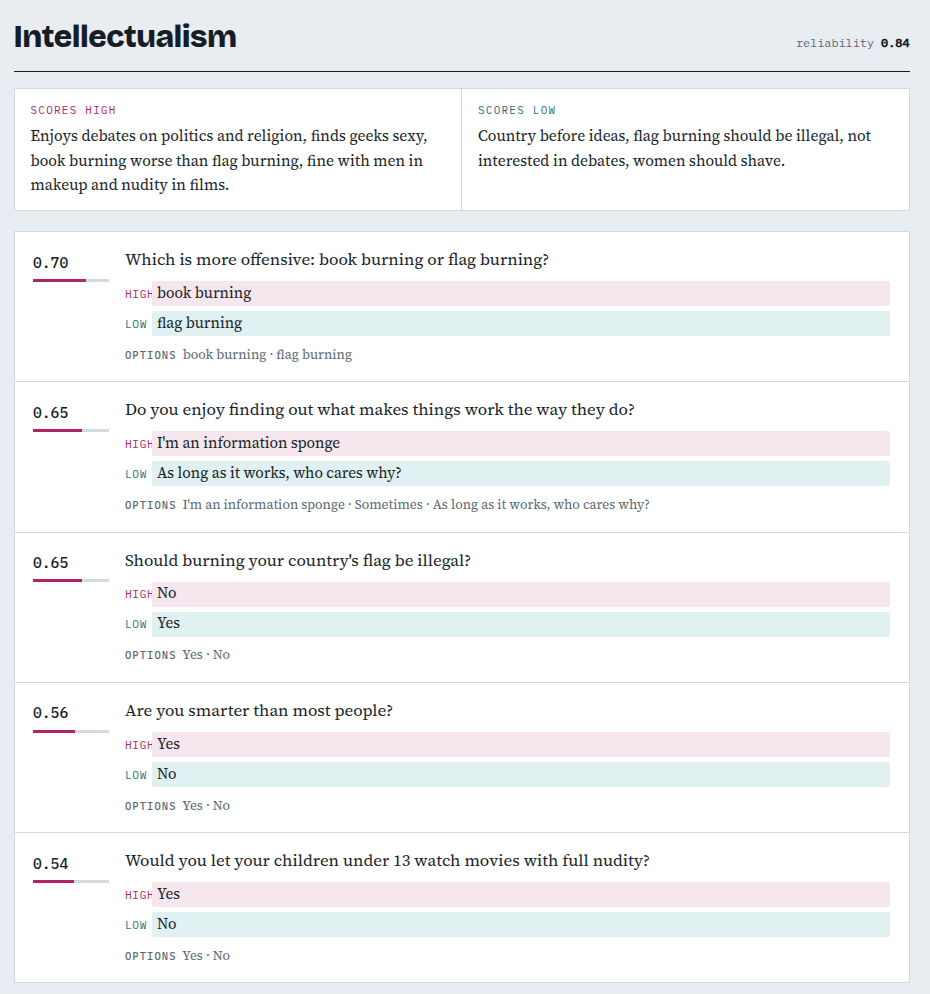
Questions concern sexual prudishness, self-rated intelligence, flag burning and so on. These items go together statistically speaking even if they measure seemingly independent things.
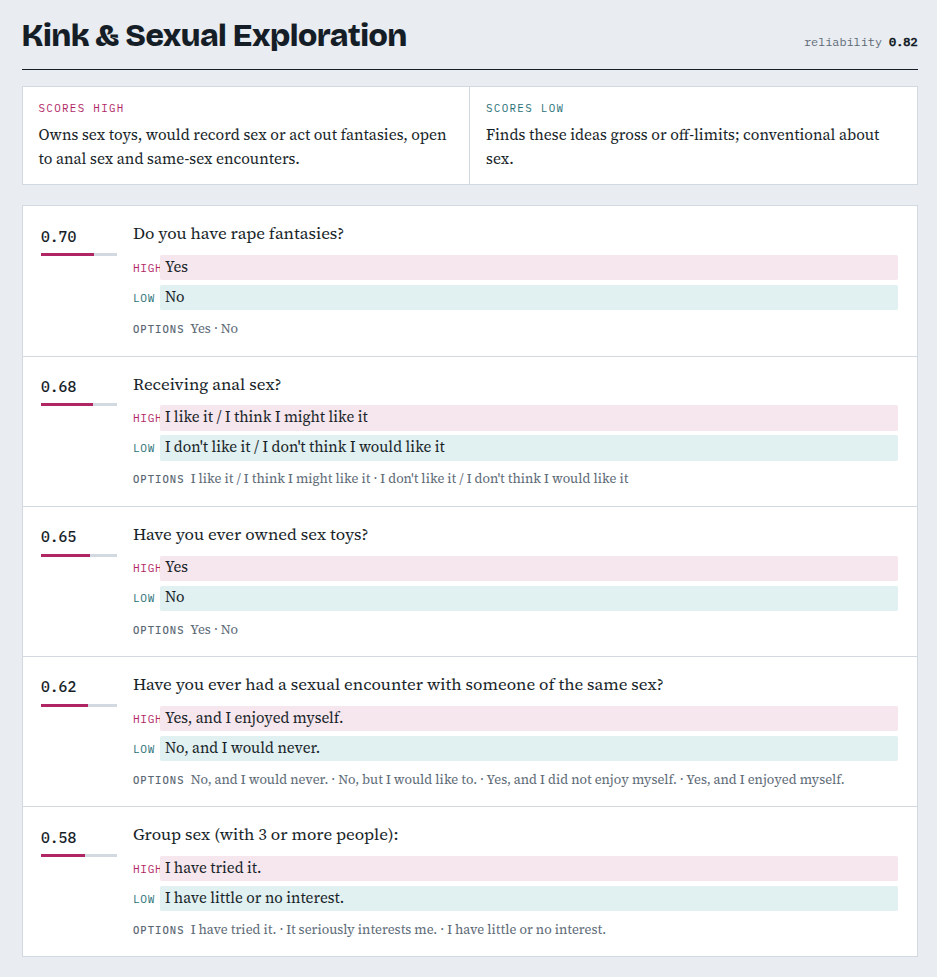
Kink and sexual exploration:
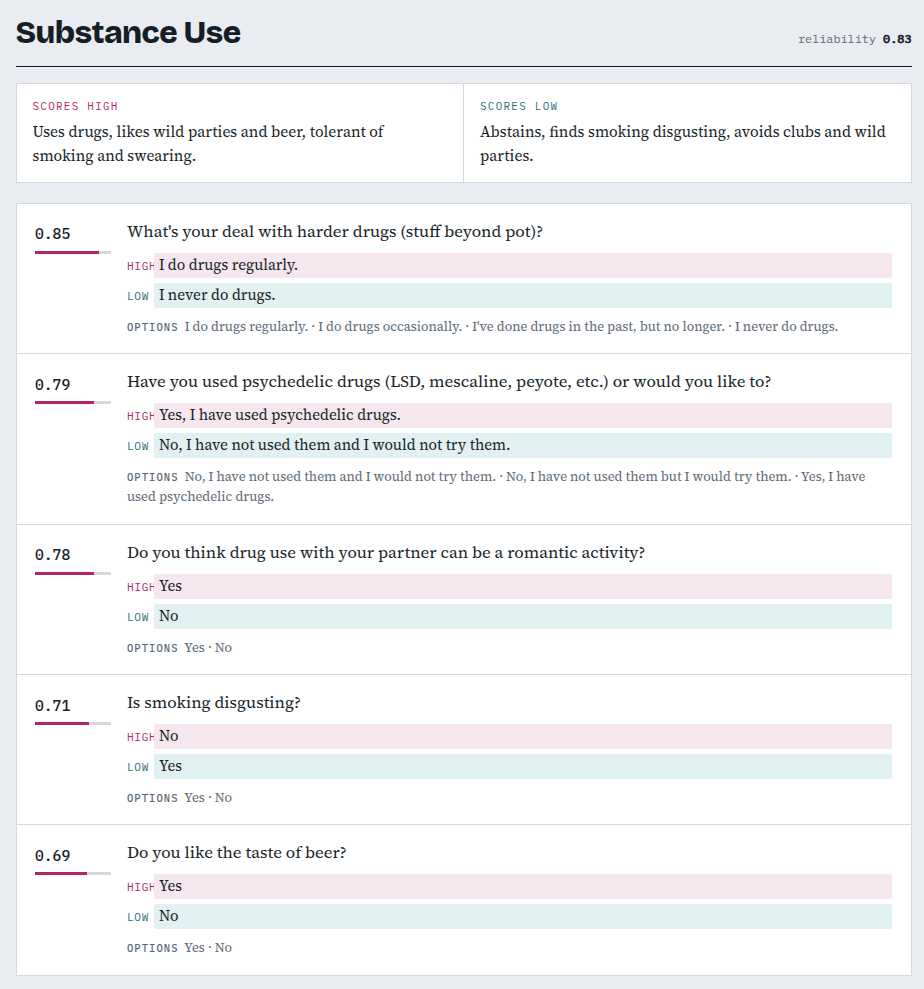
Substance use:
Overall we can say that these dimensions are somewhat unsatisfactory because they mix up different things. From this perspective, we should want to have more and more narrow dimensions. However, this conflicts with the goal of having reliable scales. A trade-off must be made here. You may have different standards than me. Factor analysis and scale construction remain somewhat of an art and not purely a scientific matter. The above is my best current attempt at getting useful dimensions out of the OKCupid data. Maybe in the future I will make another attempt. For now, let’s hope these dimensions are measuring important things and we will discover their correlations. If anything, they provide us with 200 questions from a larger pool, which could be analyzed in different ways for research purposes.