
Explaining Poland's fertility paradox
Abortions are a distraction to our fertility crisis

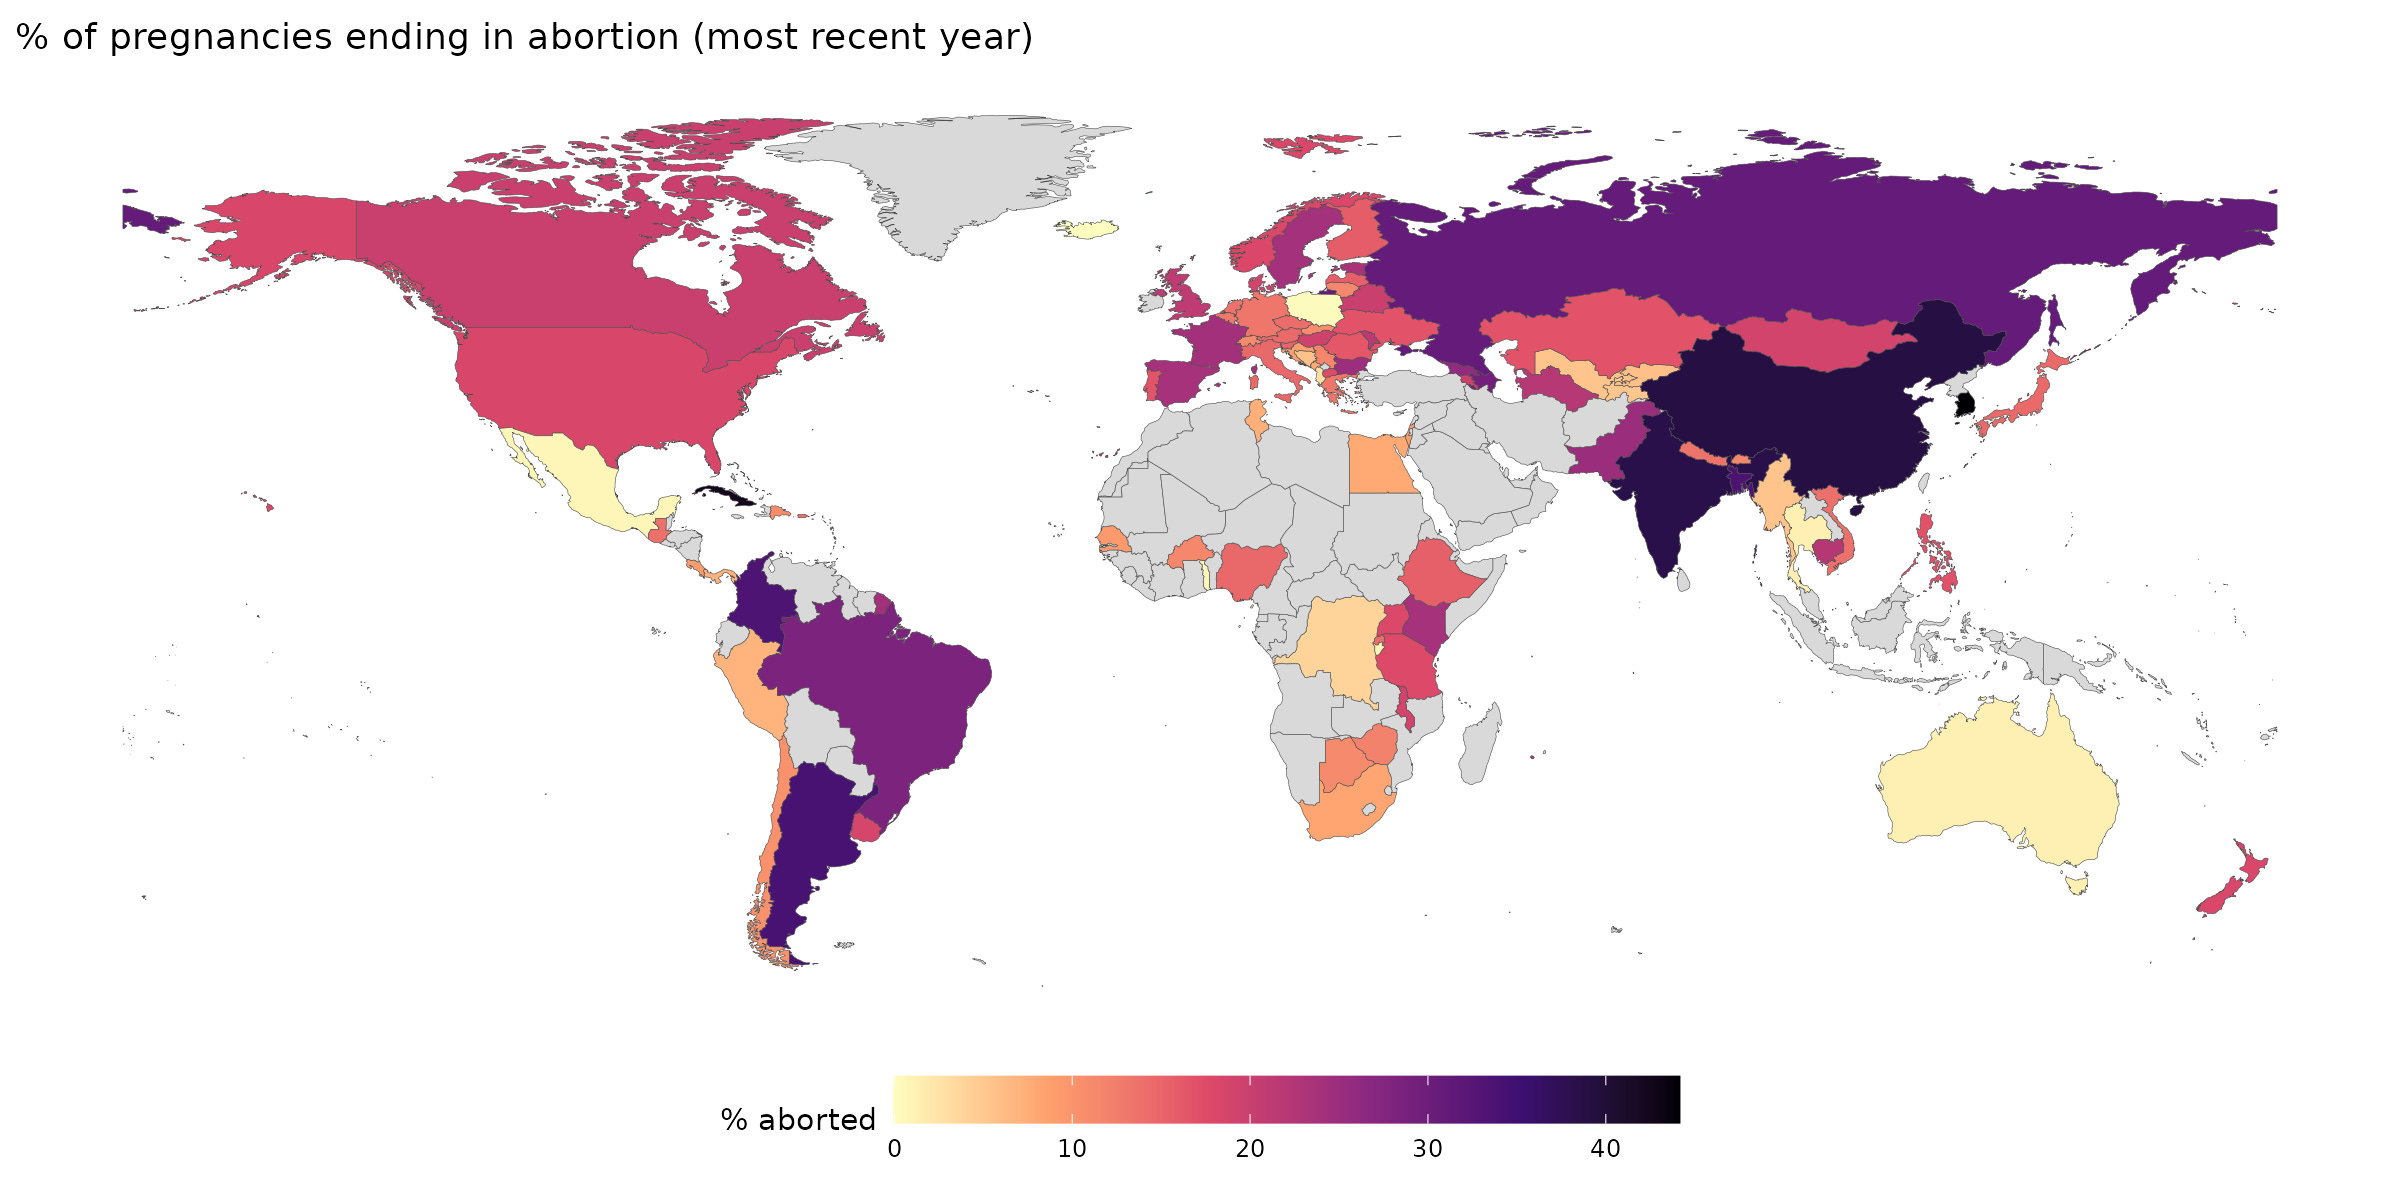
You have probably seen this map:
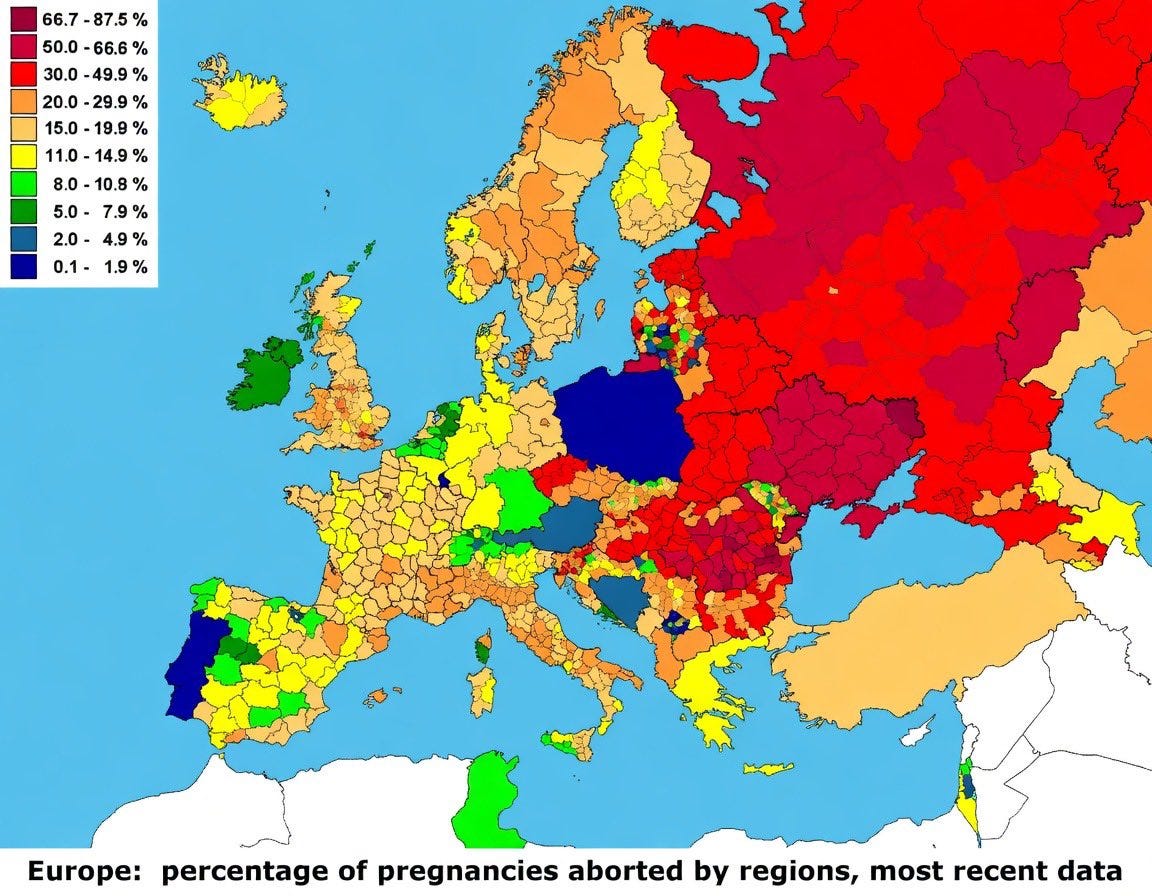
It regularly goes viral on X with the usual abortion debate to follow. The source is this site, where we can also learn that this plot is 15 years old. Here’s the newest one they have from 2022:
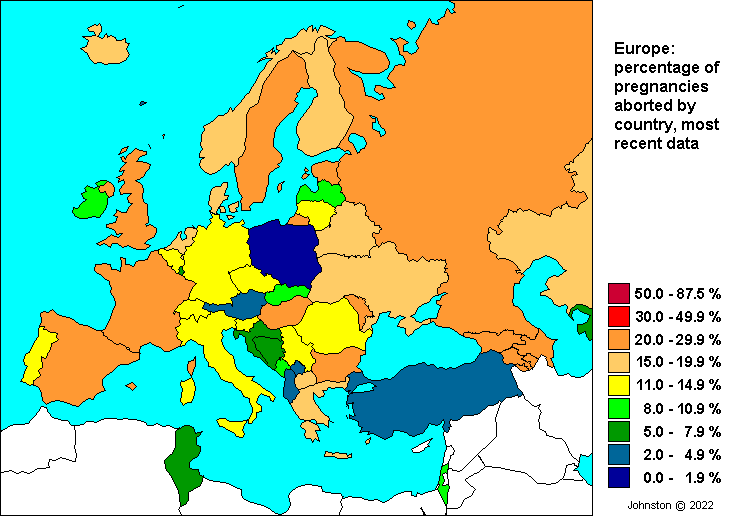
The newer map shows Portugal now has a higher rate, and Poland is still the big outlier together with Austria (in their data). I think these rates are based on abortions in that country, so does not include medical tourism, which is now very easy to do. Poland’s effective rate is thus much higher than the <2% seen here. Naturally, abortions lower the fertility rate, so you would expect that if we plot these together, we get a decent negative correlation:
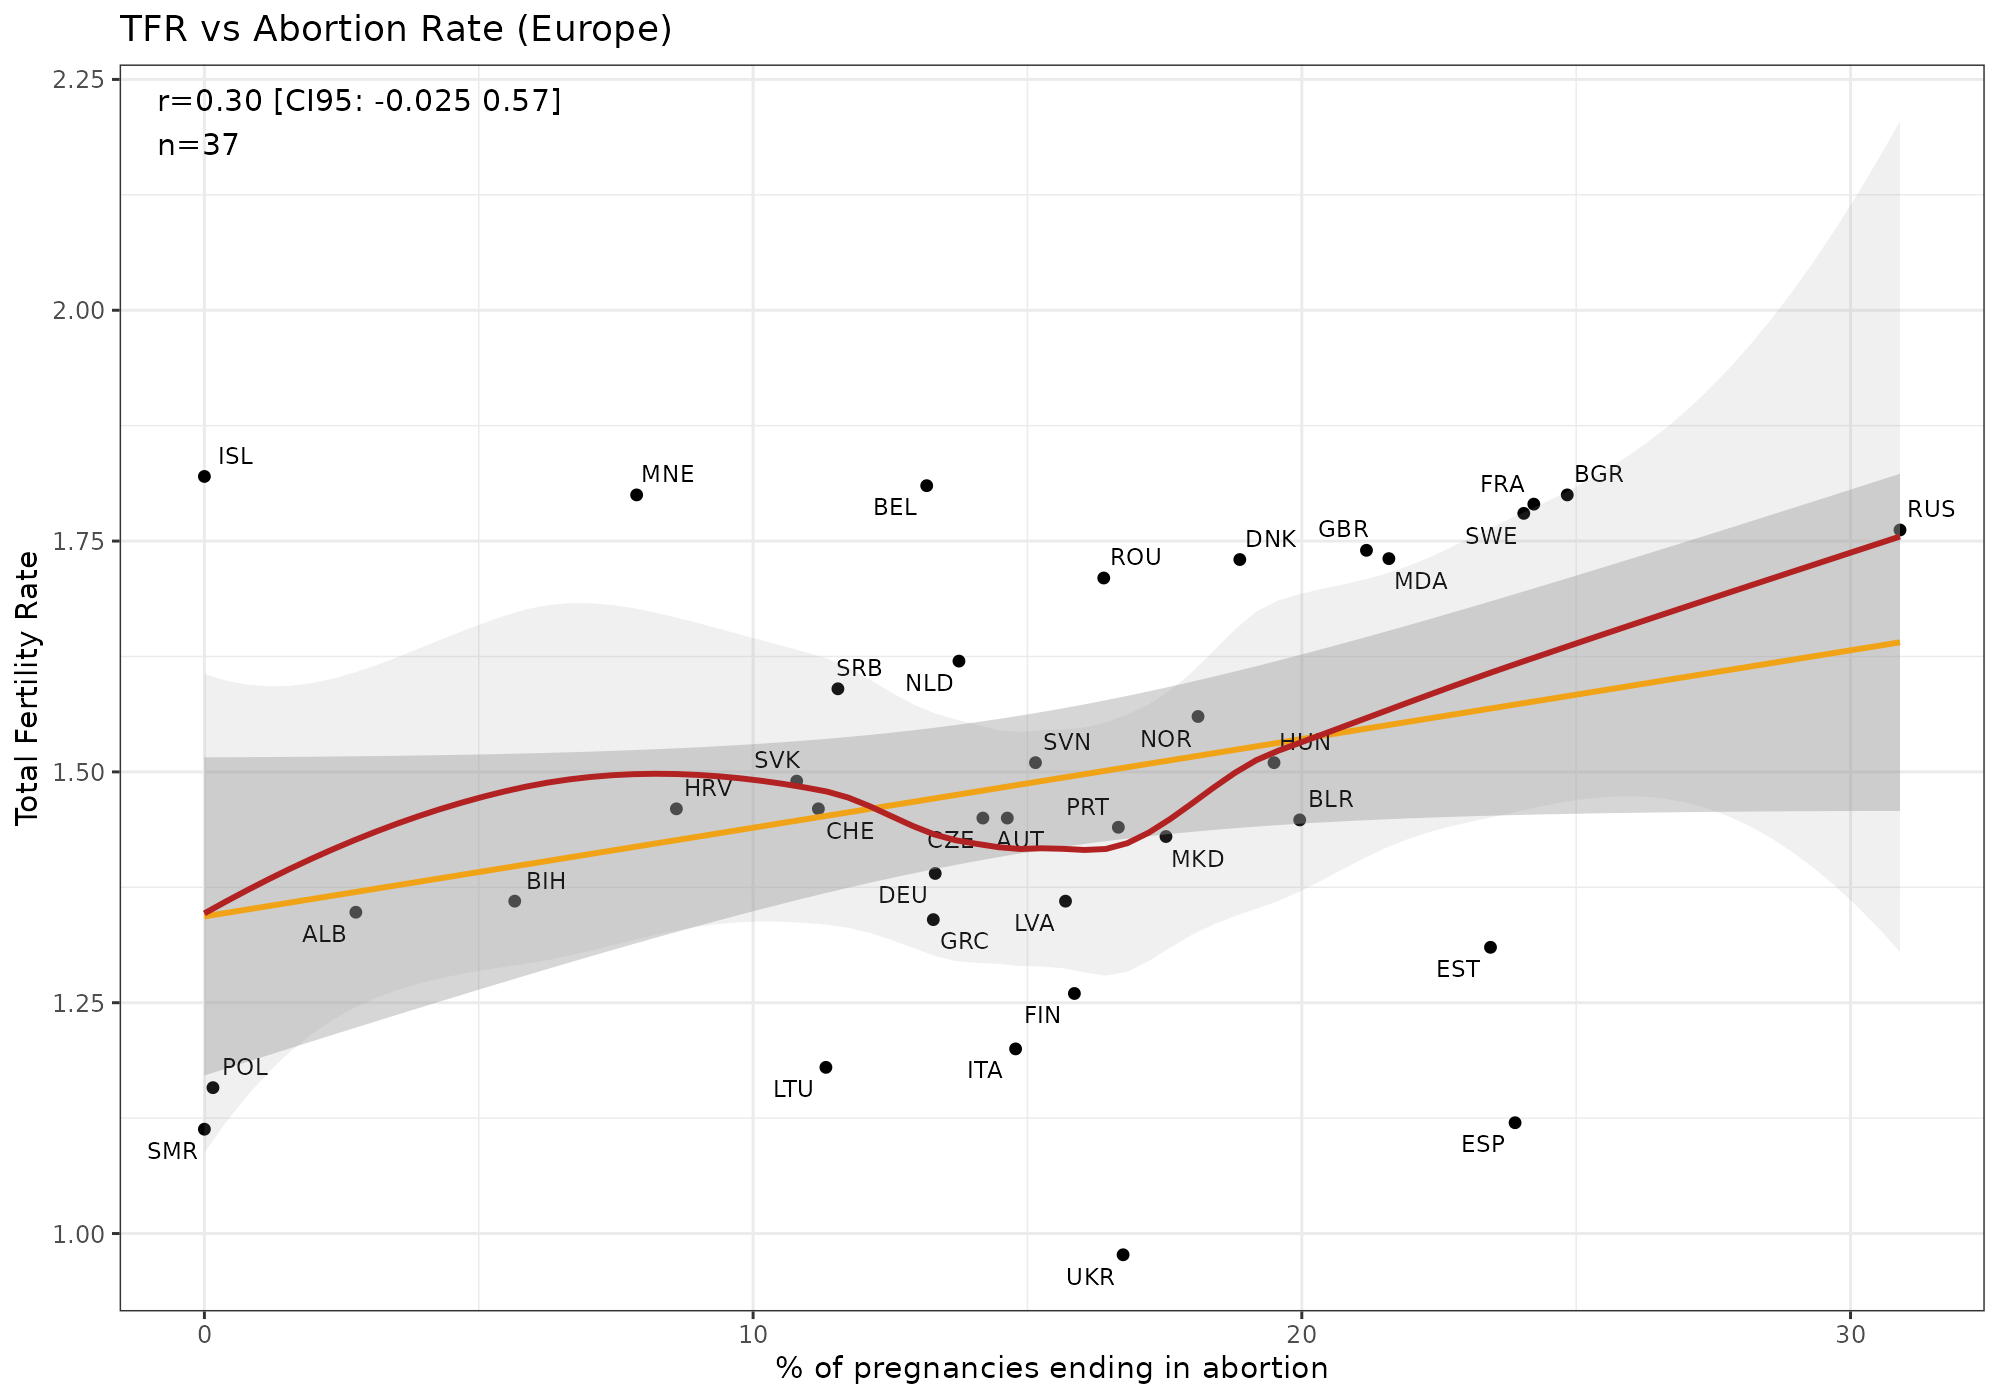
But that’s not what we see, instead it is positive for European countries, and worldwide it is:
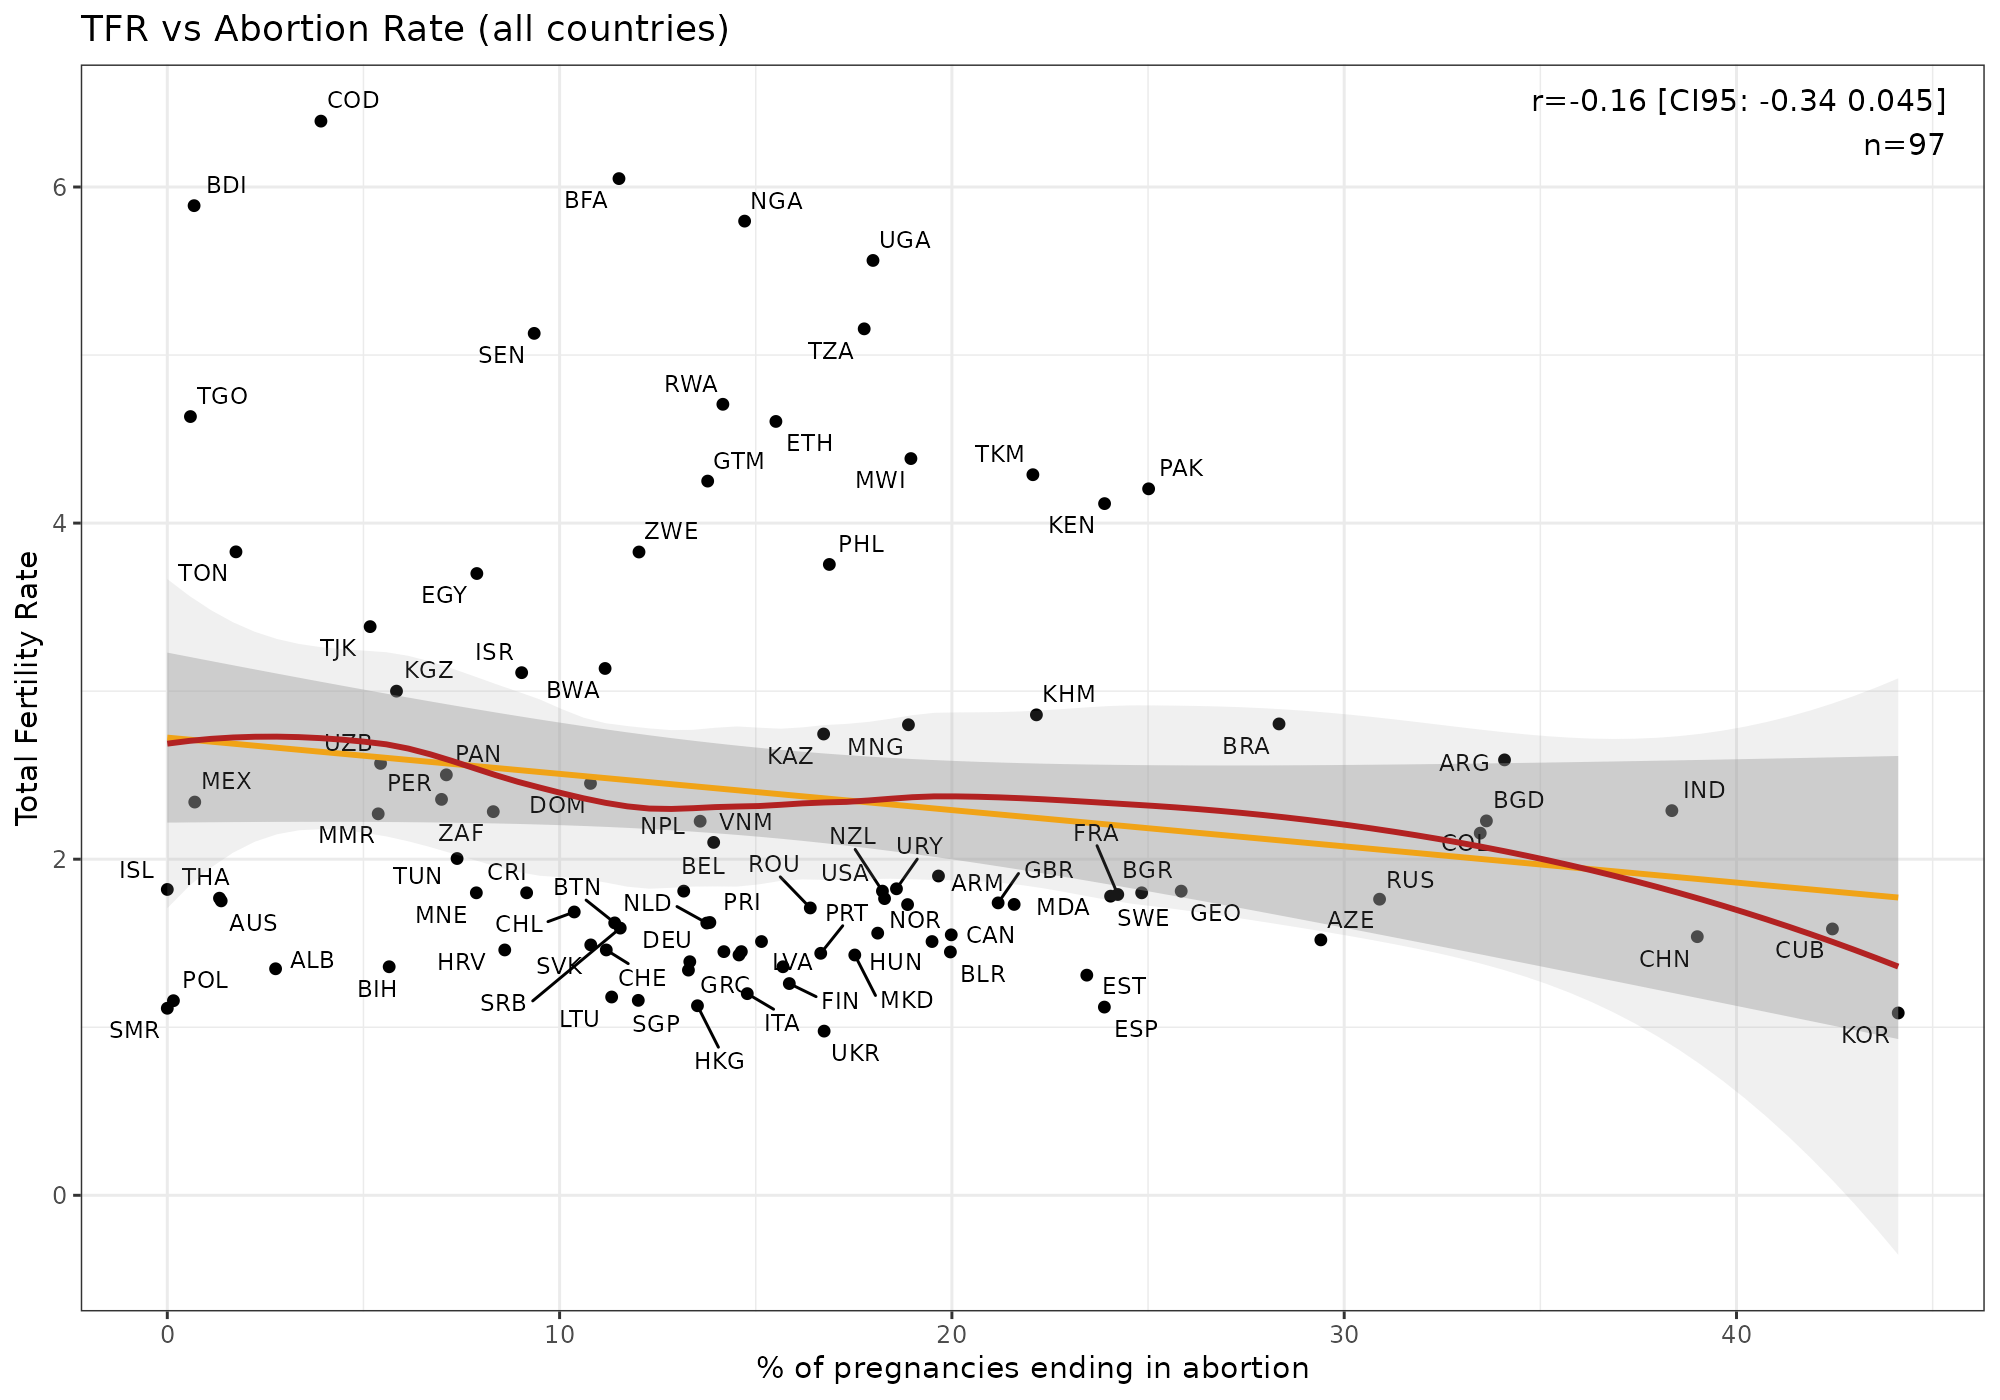
In neither case is the relationship stronger than chance level, despite we knowing that it has a causal effect. It tells us that abortion rates per pregnancy is not the cause of national differences taken as a snapshot (cross-sectional). Clearly, what matters must be the other part of the equation, the pregnancy rate:
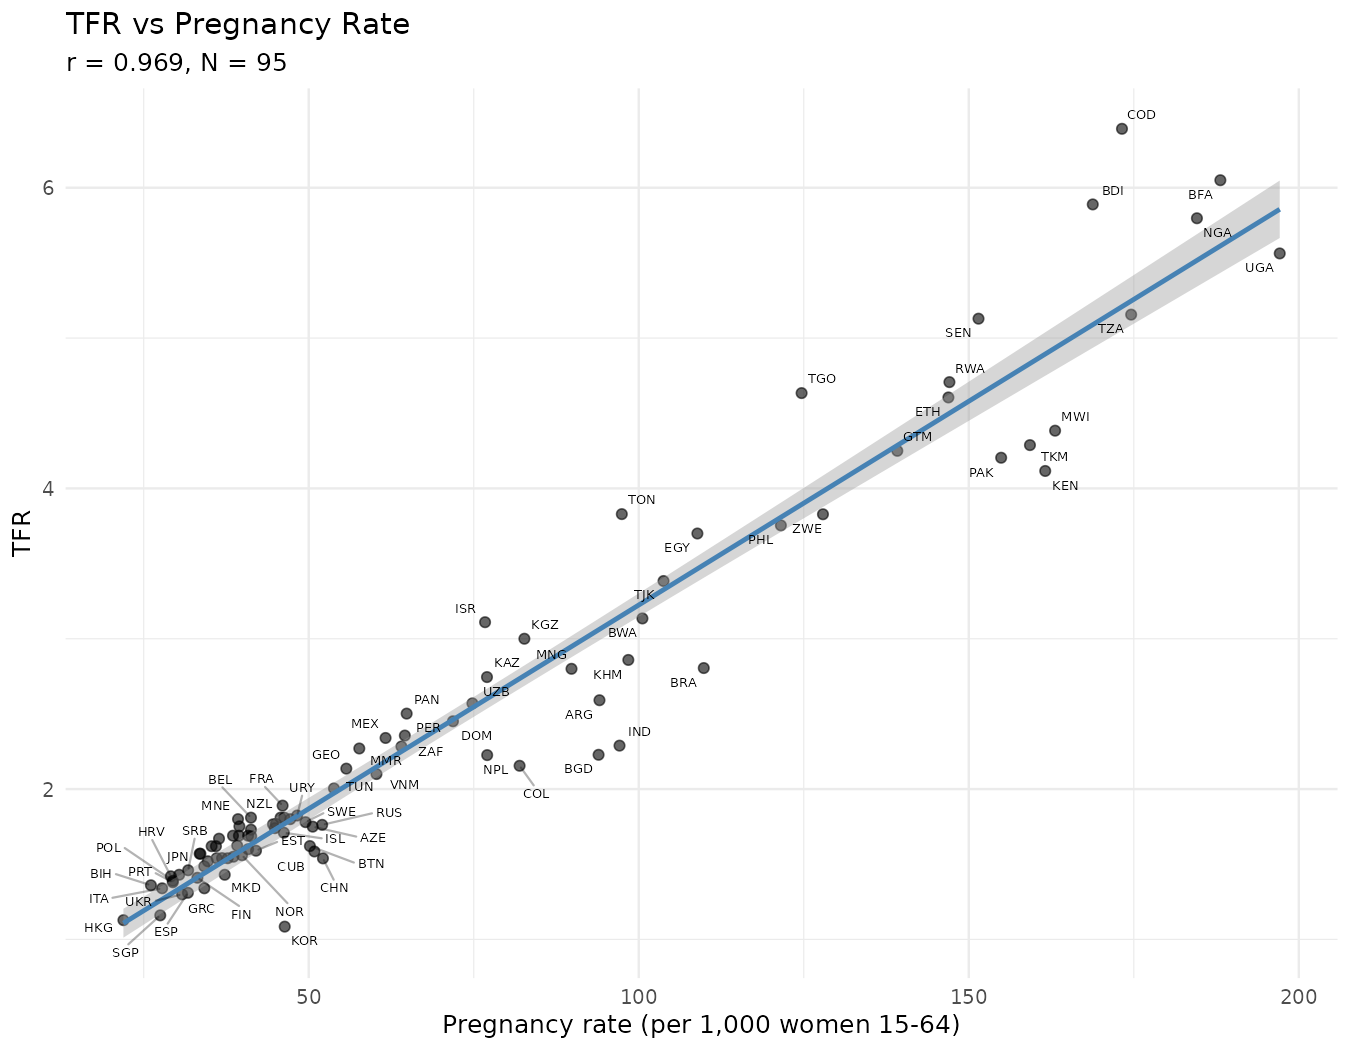
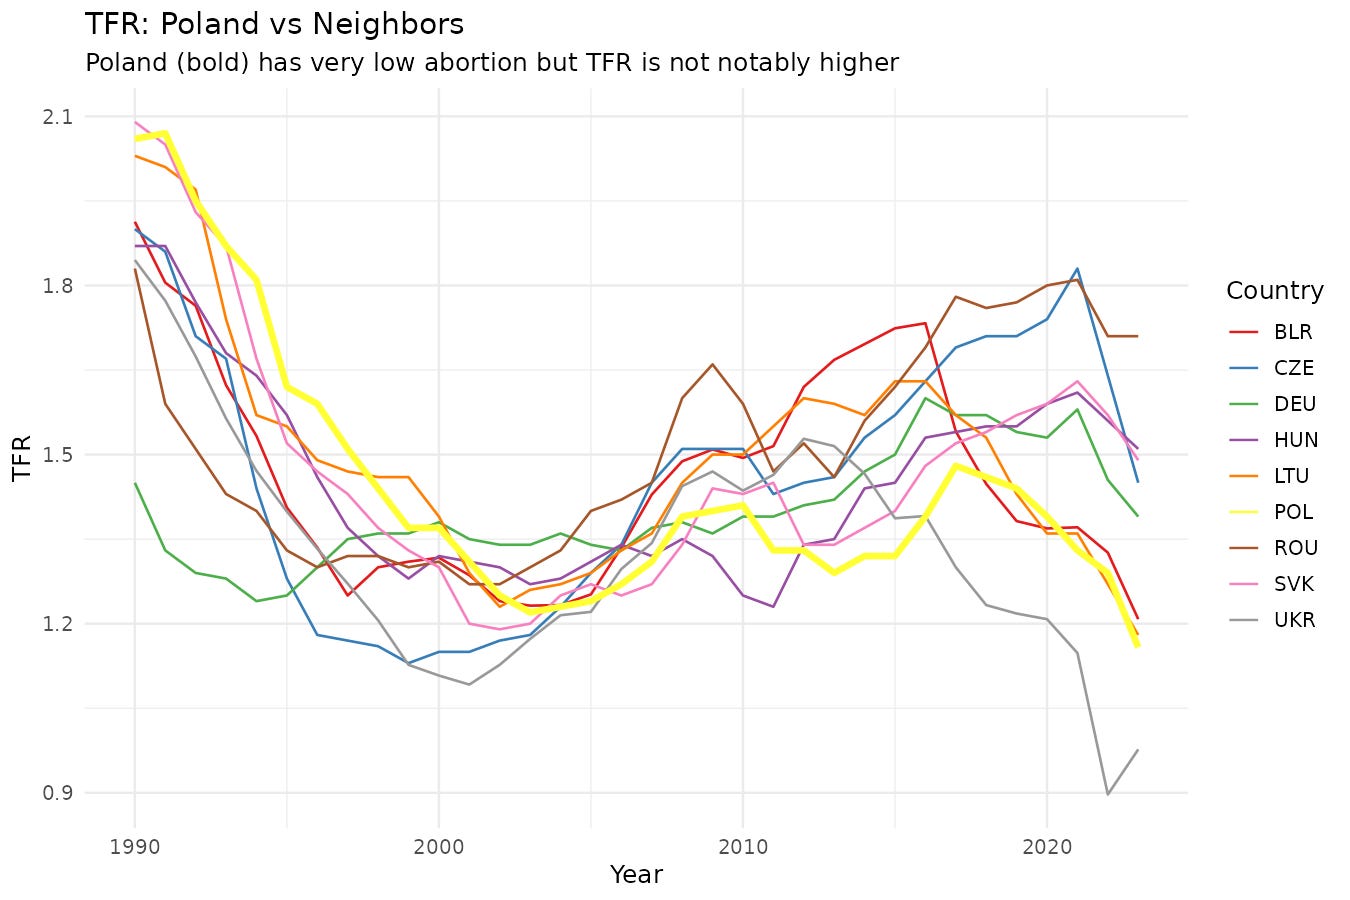
Countries above the regression line are those with few failed pregnancies, whether from abortion or miscarriage. If you look closely you can see that Poland is a bit above the line. And in general, Poland does not have higher TFR than its neighbors:
The issue with the focus on abortion is that it is not the only way women can control fertility. If you ban abortion, they will just take more care to not get pregnant in the first place and not rely on abortion as a backup solution This is what Polish women do:
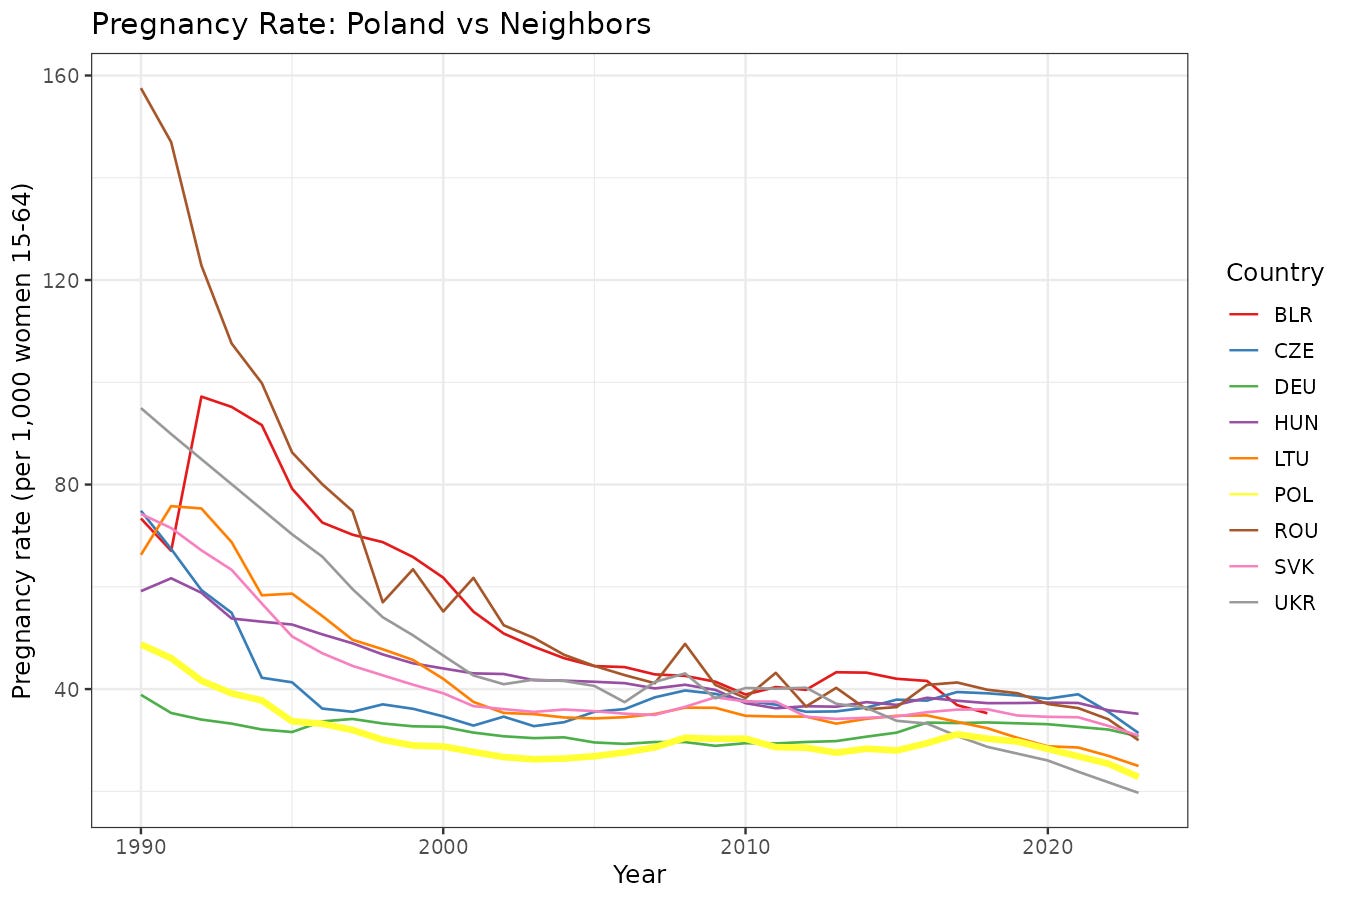
Only Ukraine has a lower pregnancy rate.
We have time series data, so we can also try the country fixed effect model, which controls for anything that doesn’t change for a given country (geography, neighbors). Using this, can we show that changing the abortion rate per pregnancy boosts fertility? No, within country variation in TFR is not much linked to %aborted either, 1.4% variance explained, and with the wrong sign. Fitting the more correct model -- TFR = pregnancy rate * (1 - abortion_rate_pp) -- explains 90% of the variance and change is almost entire due to changes in the pregnancy rate, not the aborted%. Abortions are a distraction, communist Romania aside. The model doesn’t fit perfectly because the pregnancy rate is given in per 1000 women, and the TFR is a metric that attempts to predict the lifetime fertility of a woman using the current age specific birth rates. This forecasting model implicitly assumes that these rates do not change, which of course we know they do. There is also a minor effect of the age and sex composition of countries, but these are minor compared to the main cause, the pregnancy rate. To boost fertility rates, countries must focus on this variable, not having religious or quasi-religious arguments about abortion. You must make women want to have children. Make Motherhood Great Again.
Some more maps for those interested. Aborted% by country:
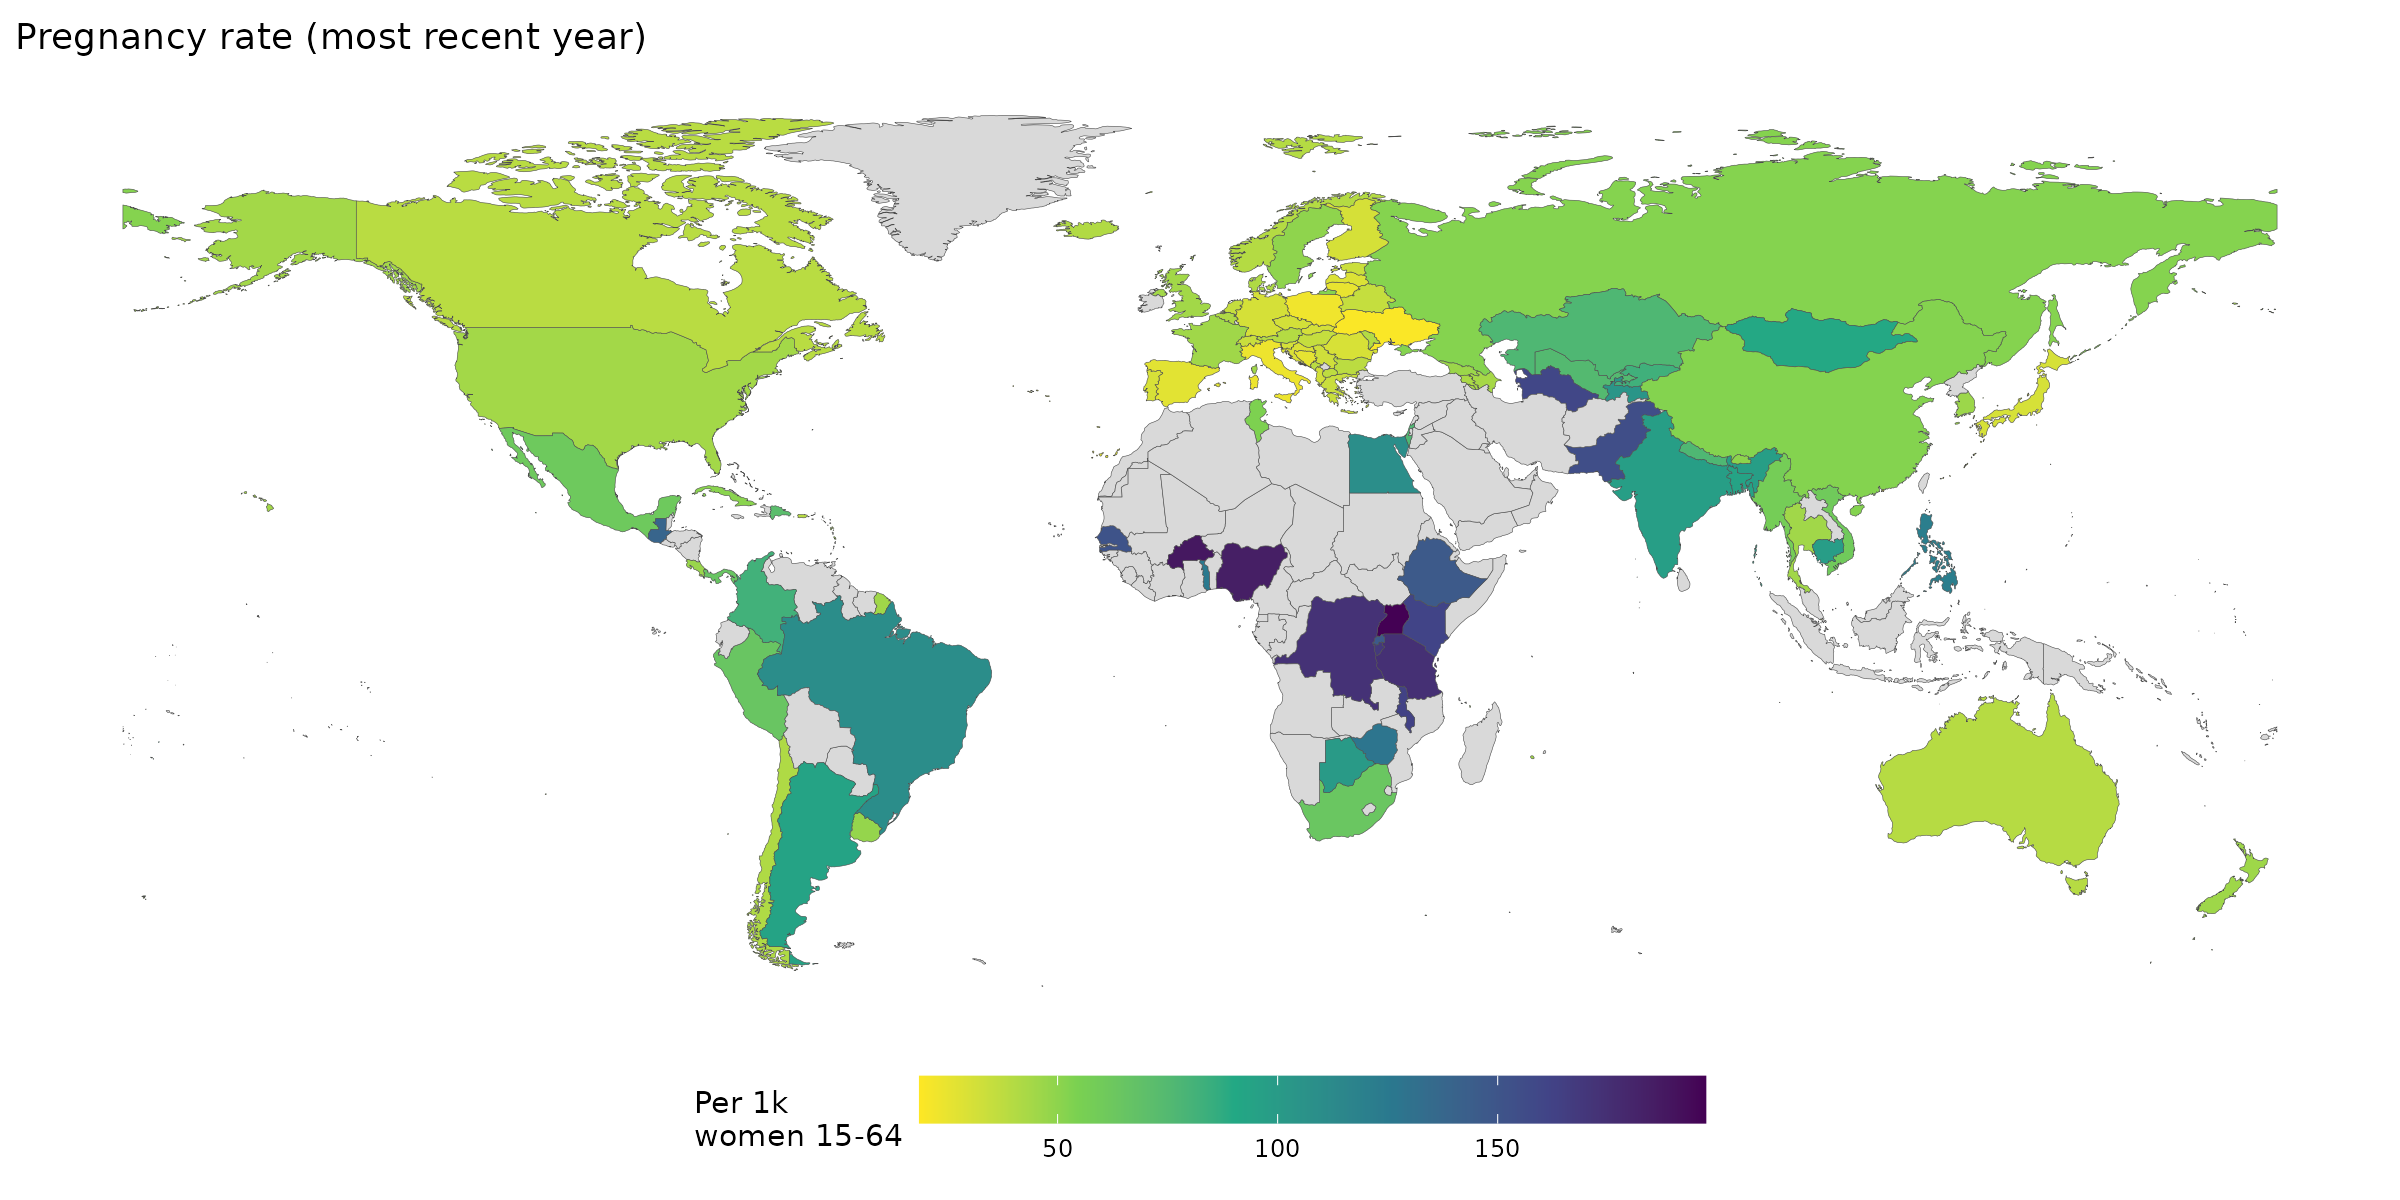
Pregnancy rate map:
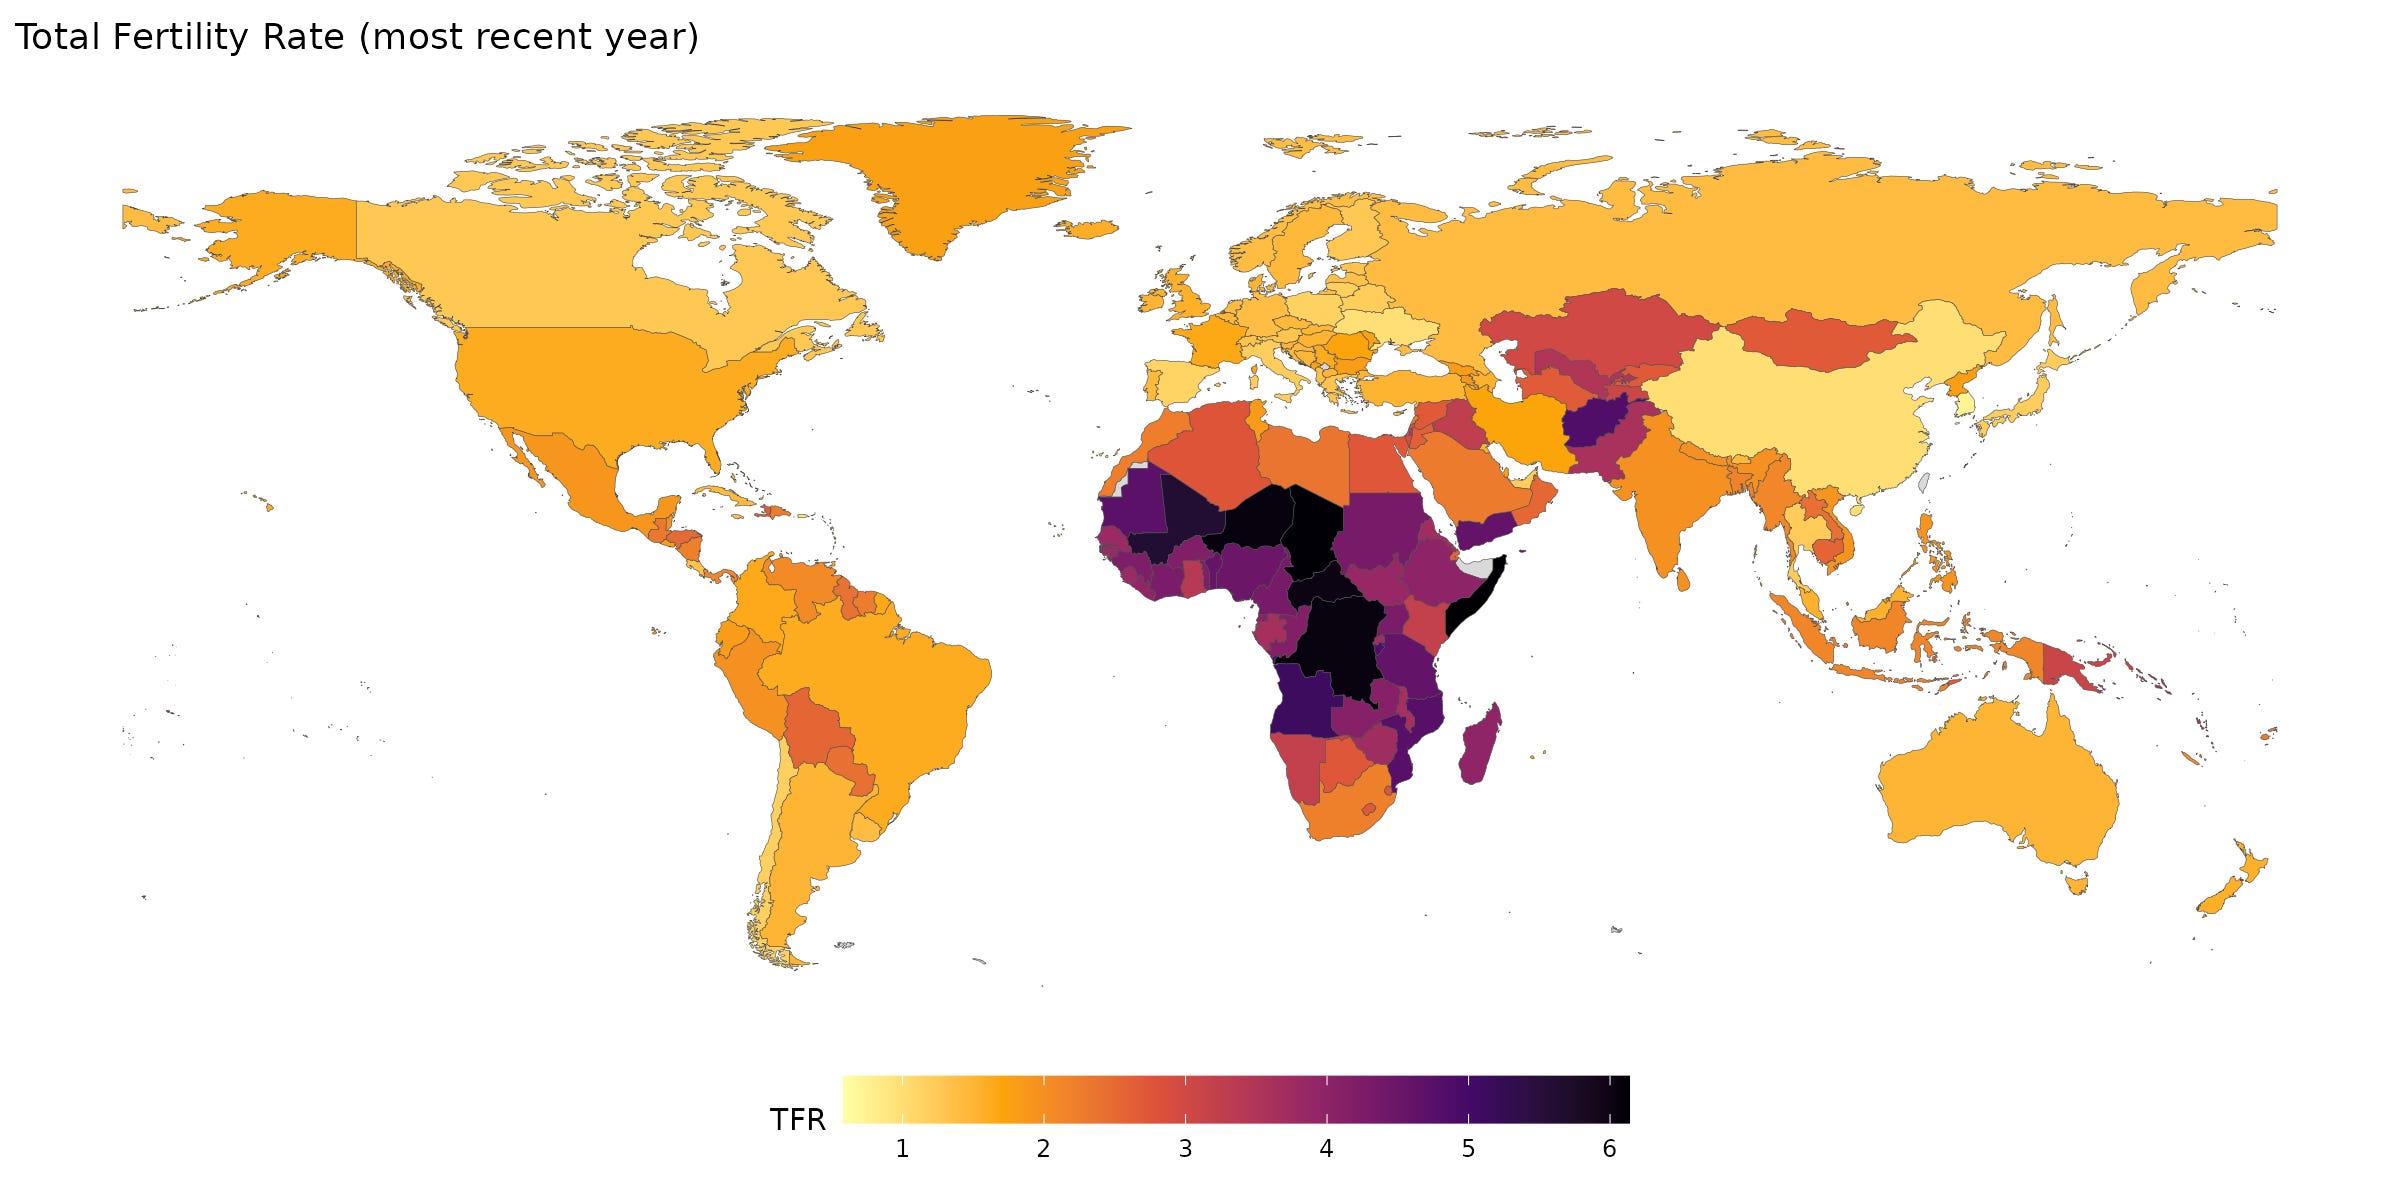
TFR map:
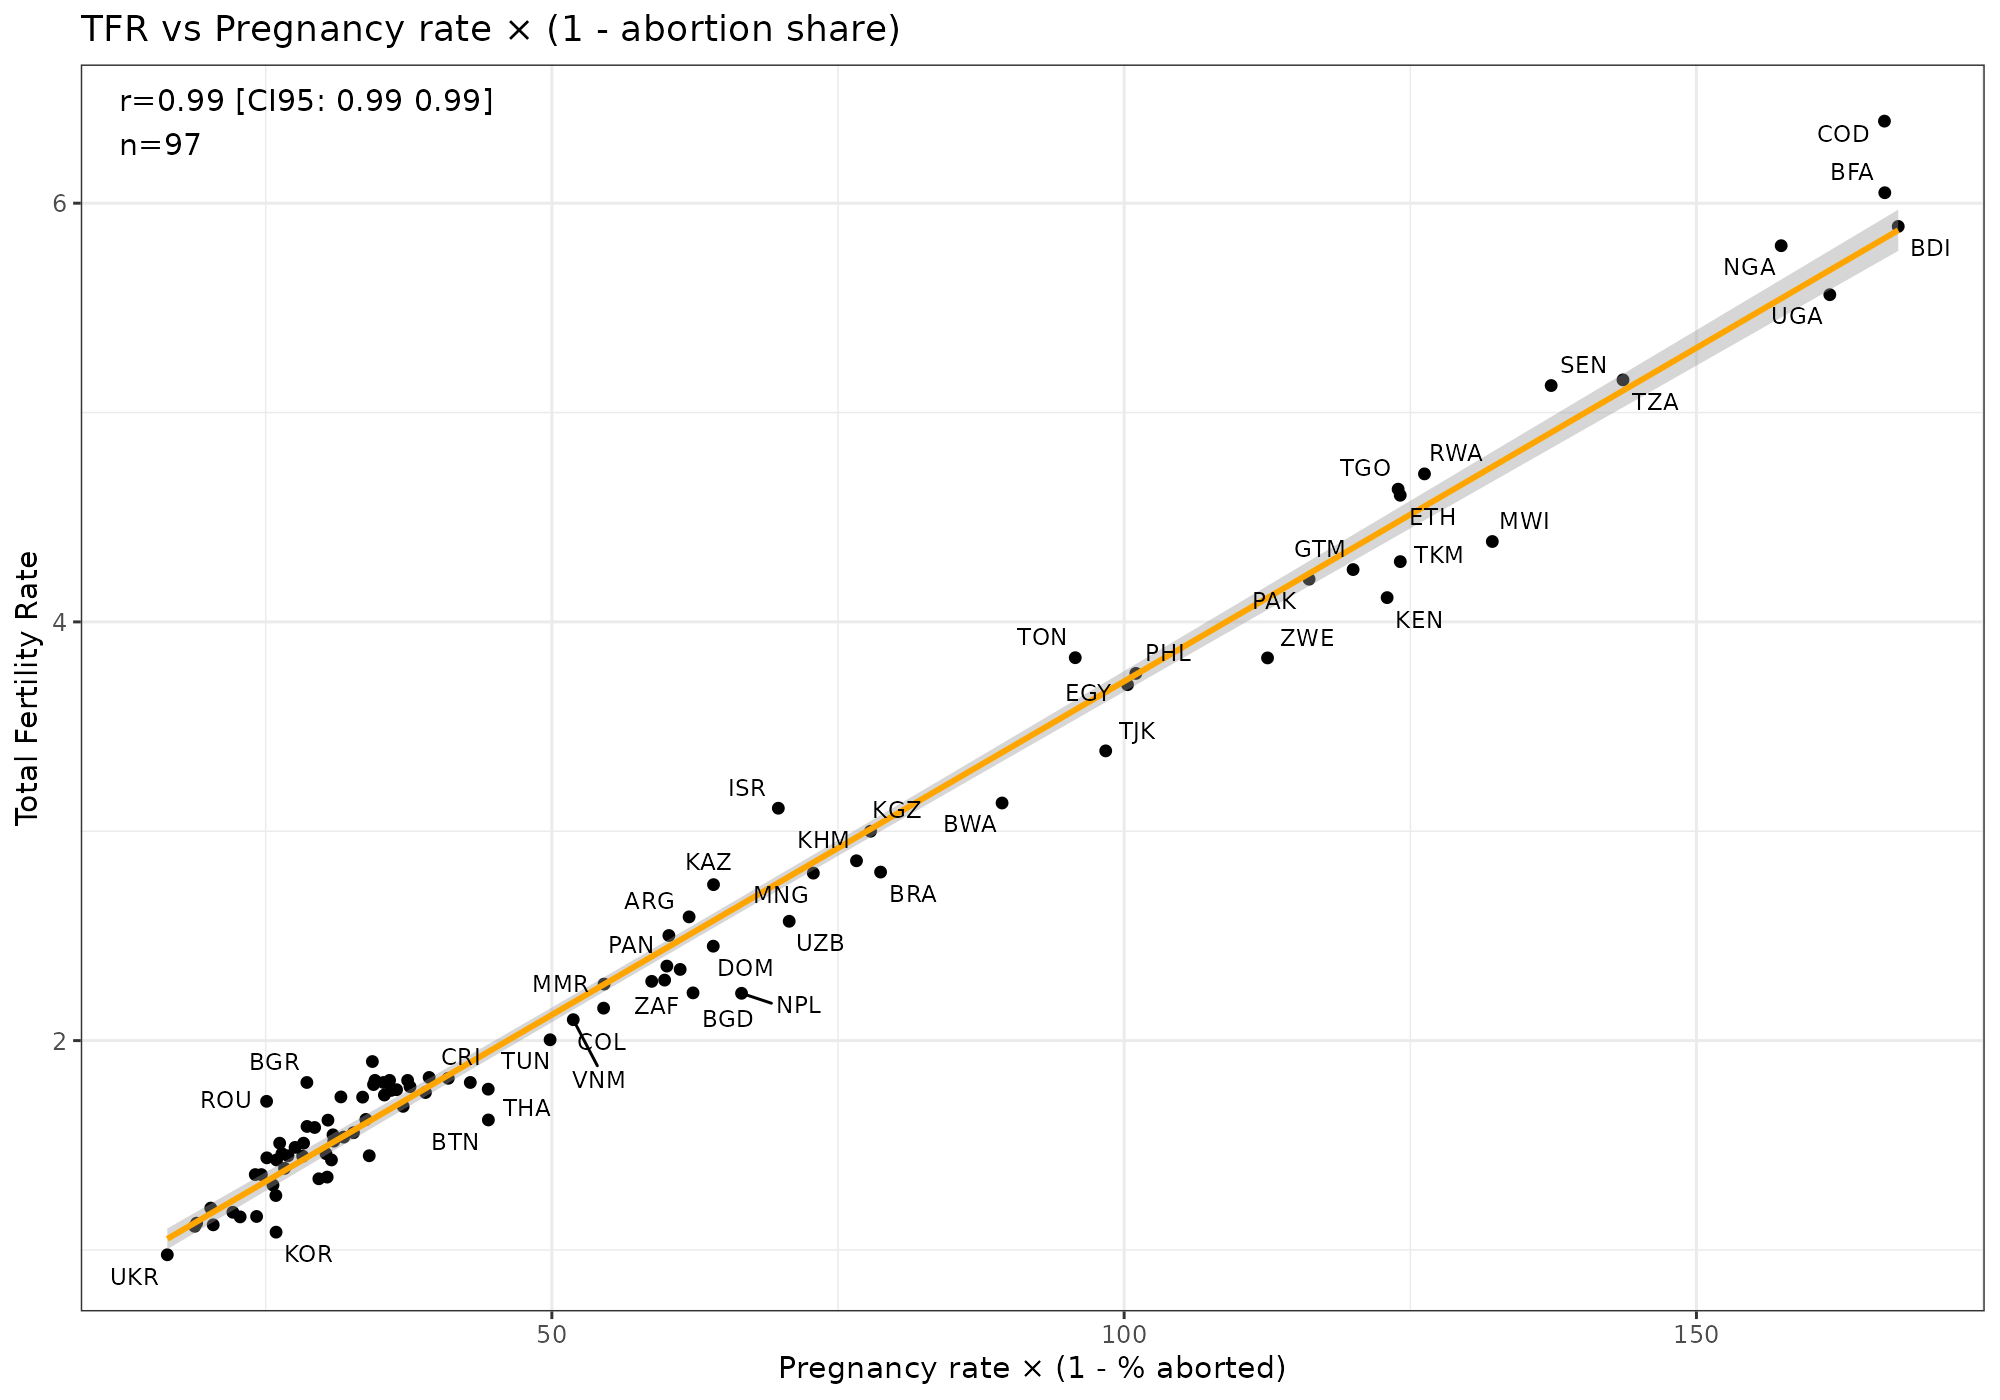
Cross-sectional fit of TFR ~ pregnancy_rate * (1-aborted%):
Notes on the data (Claude)
1. World Bank World Development Indicators (WDI)
Variables: Total Fertility Rate (
SP.DYN.TFRT.IN), crude birth rate (SP.DYN.CBRT.IN), total population (SP.POP.TOTL), female population 15-64 (SP.POP.1564.FE.IN), female population total (SP.POP.TOTL.FE.IN)Coverage: 215 countries, 1960-2024 (annual)
Download: Bulk CSV from https://databank.worldbank.org/data/download/WDI_CSV.zip (the API was down at time of download)
Quality: High. Originates from UN World Population Prospects. Interpolated/modeled for years without census data.
File:
data/raw/wdi_panel.csv
2. Guttmacher Global Abortion Incidence Dataset (GAID)
Reference: Popinchalk, Beavin & Kwok, hosted at https://osf.io/5k7fp/
Variables: Number of abortions, abortion rate (per 1,000 women 15-44), % of pregnancies ending in abortion, data source type, completeness classification
Coverage: 108 countries, 1989-2018 (annual where available, gaps common)
Quality: Variable. Compiles official statistics, surveys, and study estimates. This is the input data for the Bearak et al. modeled estimates.
File:
data/raw/guttmacher_abortion_incidence.csv
3. Eurostat - Legally Induced Abortions (demo_fabort)
Variables: Number of legally induced abortions, by age of mother
Coverage: 41 European countries, 1960-2024 (varying by country)
Quality: Official statistics from national agencies. Used to gap-fill countries missing from GAID (added 30 country-year series not in GAID).
File:
data/raw/eurostat_abortions.csv
4. WHO Global Health Observatory - Modeled Abortion Rate
Reference: Based on Bearak et al. (2020, 2022)
Variables: Abortion rate per 1,000 women 15-49, with 80% and 95% uncertainty intervals
Coverage: 144 countries, single period (2015-2019 average)
Quality: Modeled estimates (Bayesian hierarchical model). Wide uncertainty intervals for countries without official statistics. Cross-sectional only - not usable for panel analysis.
File:
data/raw/who_abortion_rate.csv
5. Bearak et al. 2022 (BMJ Global Health) - Supplementary Data
Reference: Bearak et al., “Country-specific estimates of unintended pregnancy and abortion incidence”
Variables: Country-level modeled abortion rates, % of pregnancies aborted, with uncertainty intervals
Coverage: ~150 countries, 2015-2019 average
Quality: Modeled estimates. Cross-sectional only.
File:
data/raw/bmjgh-2021-007151supp001.xlsx
Constructed Variables
In data/panel.csv, the following are computed from the raw sources:
live_births = (birth_rate / 1000) * pop_totalabort_rate = (n_abortions / female_pop_15_64) * 1000— abortions per 1,000 women 15-64abort_per_birth = (n_abortions / live_births) * 1000— abortions per 1,000 live birthspregnancies = live_births + n_abortions— does NOT include miscarriages/stillbirthspreg_rate = (pregnancies / female_pop_15_64) * 1000— pregnancies per 1,000 women 15-64pct_abort = n_abortions / pregnancies * 100— % of (known) pregnancies ending in abortion
Known Issues
Systematic undercount of abortions
Official statistics systematically undercount abortions, especially where abortion is legally restricted. Countries with restrictive laws (most of Latin America, Africa, Middle East) either don’t report or report implausibly low numbers. Of the 97 countries in our cross-section, only 12 are classified as “Complete” in the GAID; 31 are “Incomplete” and 54 have no completeness rating (mostly Eurostat-sourced, which reports only legal abortions).
Poland’s reported numbers are almost certainly too low
Poland reports ~1,100 legal abortions per year. Estimates of actual abortions (including travel to neighboring countries and underground pill use) range from 80,000-150,000. This means Poland’s pct_abort of 0.3% is a massive underestimate; the true figure may be 10-15%.
Stale data for some countries
14 countries in the cross-section have their most recent abortion data from before 2010. Austria’s data is from 1988 (the last year Eurostat has Austrian abortion statistics — Austria stopped reporting). Other notably old: Turkmenistan (1990), Brazil (1991), South Korea (2005). Median year of most recent observation is 2017.
“Study” estimates vs official statistics
23 of 97 countries in the cross-section use abortion counts from academic studies or surveys rather than official government statistics. These are often one-off estimates with different methodologies, making cross-country comparison difficult. Countries relying on study data are predominantly in Latin America, Africa, and Asia — precisely the places where official reporting is weakest.
Pregnancy rate denominator mismatch
Our pregnancy rate uses women aged 15-64 as the denominator (from WDI), while TFR sums age-specific fertility rates over ages 15-49. This creates a systematic wedge: countries with older/younger age structures will have different ratios of TFR to our computed pregnancy rate. The multiplicative model TFR ~ preg_rate * (1 - pct_abort) achieves R² = 0.98 cross-sectionally and within-R² = 0.90 in the panel, with the residual largely attributable to this age-structure mismatch.
Pregnancies exclude miscarriages and stillbirths
Our pregnancies variable = births + abortions, omitting spontaneous pregnancy losses (miscarriage, stillbirth), estimated at ~10-20% of recognized pregnancies. This doesn’t bias the pct_abort calculation much (it affects both numerator composition and denominator equally), but it means our “pregnancy rate” is better described as “recognized pregnancy rate resulting in birth or induced abortion.”
Eurostat gap-filling
For 30 European countries, GAID had no data but Eurostat did. We filled these gaps with Eurostat counts. Eurostat reports only legally induced abortions, which may undercount where clandestine abortion exists (though this is minimal in most of the EU).
I have been saying this for more than a decade. Conservative social programs, including abortion bans, don't raise TFRs, and on net, if anything, probably depress them (e.g. if it results in ostracism towards single mothers). If you want to raise fertility through radical politics you have to pretty much go full Taliban/Caesar's Legion.
I have some anecdata on Austria. The Catholic Church learned they are not winning this one, so they switched to supporting pregnant women. They have ads everywhere, "pregnant? need help? call here".