
Female education and fertility rates
This is not the cause you are looking for

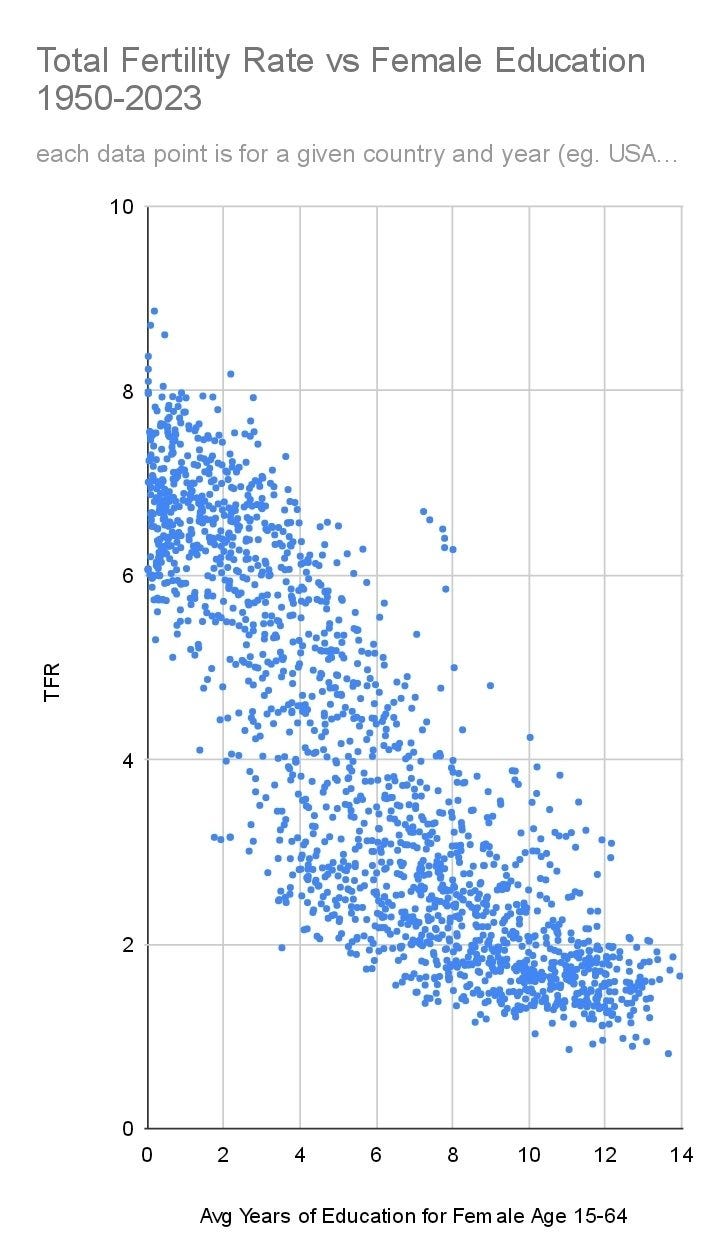
This figure has been floating around on X the last few days:
As in my own example, the copycat gained more attention than the earlier post (July 3rd 1.2M views, and a literal quote post of this with 3M views 10 minutes later). X incentivizes just looking around all day for good content ADHD-style, the reposting it with your own spicy comment and hoping your followers are better at reposting than the other guy's.
Anyway, I couldn't find any clearly original source or any details about the data, but it seems to just come from OWID's page about the same two variables. The problem from a causal perspective here is that treating every datapoint across the same countries and slightly different years as independent data may not be a good idea. The pattern could have something to do with between country variation instead of causal effects of female education duration. Or it may have something else to do with temporal changes.
So let's check. Statistically, what we need here is a multi-level model so we can account for these dependencies and also exploit the within country variation in the variables. A causal effect should also result in statistical relationships within countries, but confounding maybe not.
First, let's just replicate the above simple plot:

The correlation is very strong (0.87), but it also confounds any changes since 1950 to 2023. Notice also the nonlinear effect by comparing the orange and blue lines. So let's try OLS regression models:

The variables are in raw units. So in the bivariate analysis, an addition year of female education is associated with 0.48 lower fertility rate. If we control for year (model 2), this doesn't do anything. Models 3-5 control for regional fixed effects of progressively smaller size (e.g. Ethiopia is Africa, Sub-Saharan Africa, and Eastern Africa). The regional dummies shrink the effect of female education to 0.36. Finally, the last model tries a natural spline for the effect, and this improves the model (R² 0.819 to 0.857). Visually, it looks like this:

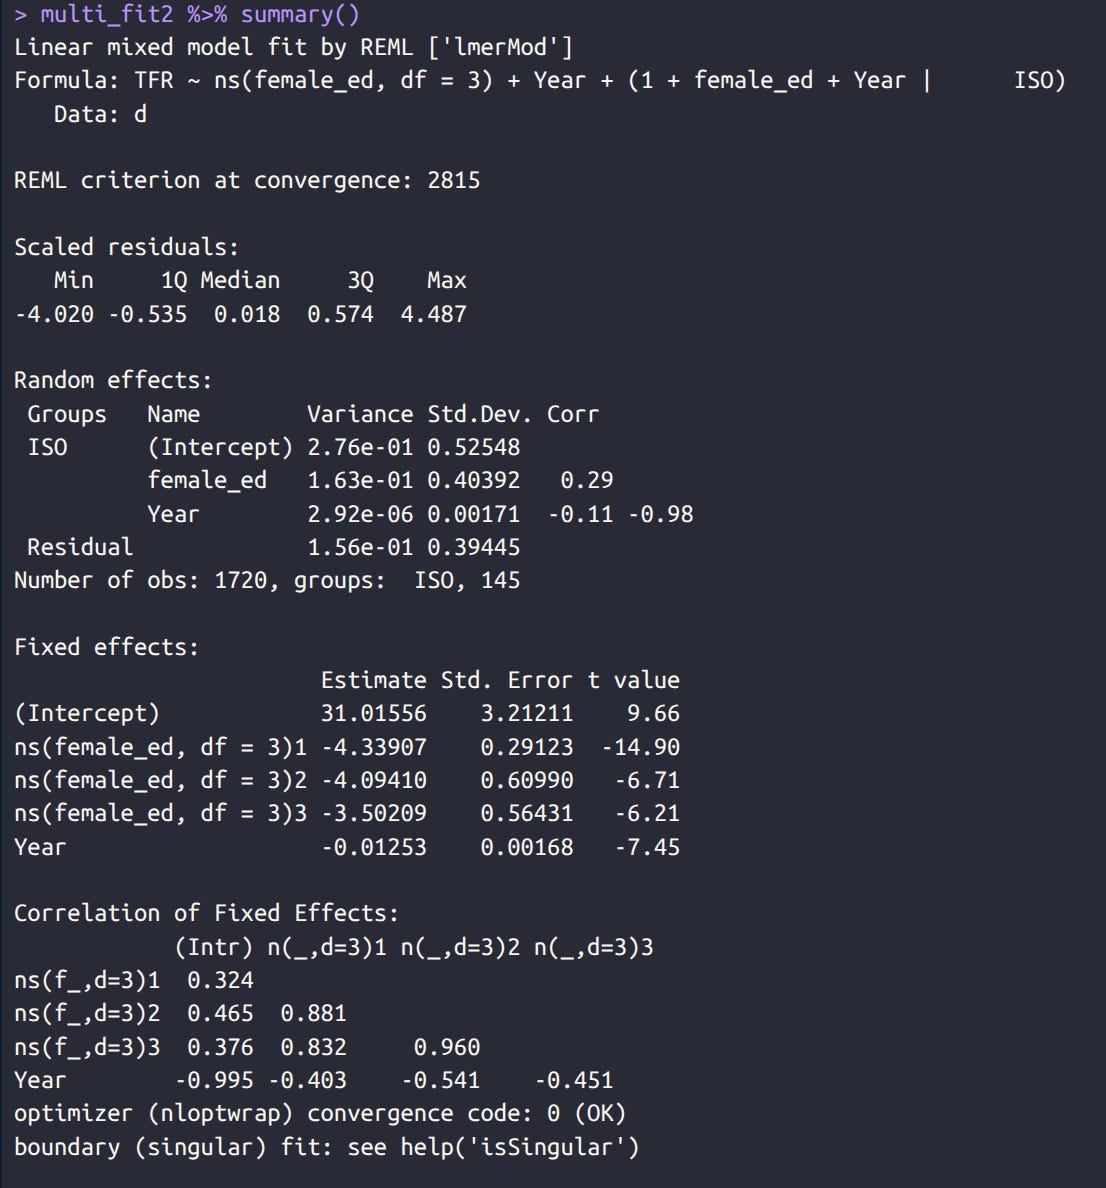
Amusingly, the curve flattens out and even turns slightly upwards around 10 years of female education. Thus, the common view of college education being the big problem since it delays family formation is contracted by the results. This may be due to between country variation, or it may be real. So let's move on to a multi-level model with random intercepts and slopes. What this means is fundamentally just that we fit the regression model inside each country, and then we average the values in a clever way noting also how much variation there is in the intercepts (baseline fertility rate) and the relationship (slope):

The linear effect from using the fancy approach is 0.41, which is in between the crude model (0.48) and the regional dummies (0.36). Clearly, between country confounding was not the problem here. The model complains about 'singularity' because within countries, year and female education length are almost perfectly correlated (0.996), and yet we are able to see an effect of both (t values > 2 = p < 5%). Since the variables are not on the same scale, we need to compare the model predictions to understand them:

This model predicts fertility should be around 0 given the amount of female education we have, something which is not real (not yet anyway). The effect of year is only 0.0065, so the 70 years of data covered here also associates with about 0.45 lower TFR compared to female education's effect of about 6.
The bigger problem is the nonlinearity we saw above, so we need a regression spline here as well (i.e., combine any spline function with lmer()). It was hard to find any example of someone doing this, but this example sort of works. I hope I did it right, but this is my result:

We see the same clear evidence of nonlinearity, or diminishing losses from the cross-country results. It seems keeping girls and teenagers in school lowers fertility, but keeping 20 year olds in school somehow doesn't. The model numerical results are kinda uninterpretable because of the splines:
Note that we do not, and cannot, control for any additional country variables that are constant because we already control for specific country effects. Thus, there is no point in adding in national IQ or regions or anything like that here. We could add in GDPpc or [your favorite variable], but I fear that we are already getting close to what is possible given that most of these variables are very strongly correlated across time within countries.
Another way to think about this is just looking at a particular country over time, say, Sweden:
 and the chart is published by Our World in Data.")
Beware that the total fertility rate is just an estimate of the eventual number of children per women (cohort fertility rate) with have based on current birth rates by age group, and then assuming these don't change in the future (known to be false). Sweden's values for older cohorts show that TFR fluctuate while cohort fertility rate is quite stable and in some recent years also higher. Clearly, trying to predict short term variation in TFR from putatively causal variables is probably not a good idea. However, we don't have much choice unless we want to make our own superior projections. Inquisitive Bird has done just that for more recent cohorts, and the interested reader could download these data and update the results.
The results are thus juicy because:
Female education does appear to be a likely cause of fertility decline, but the effect is restricted to 0-10 years of education, not the usual infinite university degrees usually discussed.
The time trend alone doesn't seem so important compared to female education, and this would appear to indirectly capture any other variable that increased linearly over time in each country.
The post COVID fertility collapse is clearly not due to female education or any linear effect of time. Such a global effect must have a global cause, which narrows it down dramatically. In my view, it must have something to do with internet and social media, which is the only thing that markedly changed in the last few years everywhere on the planet. I mean, unless you want to discuss the influence of sun spots, magic astrological, and distant gravity effects...
The effect within individuals is a lot weaker than the effect between nations, which suggests confounding or large group-level effects.
It’s just the prime time age range thing. It also lines up with the 10 yr estimate.
•Girl turns 18, goes to college for 10 years, now she’s 28.
•Amish girl or whatever culture turns 18, starts having kids at peak fertility. At 28 yrs old she might have 4 kids already.
The question and ‘mystery’ gets a lot simpler if you use the analogy of elite male sportsmen, let’s call them football players. The prime time for them is 20-30 and they’re basically washed up starting from 31 and getting geometrically more severe with each additional year. It’s just the biology. No one argues it. When it’s women though people lose their minds.