
Fertility of immigrant groups in Denmark by generation

It's somewhat of an alt right myth that immigrant groups come into the country, and then continuously outbreed the original population even if no more immigration happens. While this maybe have happened historically, it does not generally happen in Western countries because the immigrant groups quickly reduce their fertility levels to the level of the host country (demographic transition). Some years ago, I was curious about this fear, so I obtained some Danish data from directly from Danish Statistics (gov stats body). They are shown below, by generation. I left the names in Danish, but they are pretty readable (I added a new pointers in [brackets]). I included only those with at least 10 births in the period to avoid excessive sampling error, and I lined up the countries that match across generations. The correlation between the fertility rates is .57 (n = 15). Original Danish file. These data cover years 2008-2012 (average). First generation Second generation Origin Births Fertility rate Origin Births Fertility rate Tyrkiet 681 2,073 Tyrkiet 398 1,679 Polen 501 1,635 Polen 34 1,683 Irak 459 2,248 Somalia 409 3,531 Libanon 347 2,553 Libanon 81 1,542 Pakistan 302 2,732 Pakistan 171 1,772 Tyskland [Germany] 300 1,486 Tyskland 20 1,616 Norge 266 1,713 Norge 15 1,596 Bosnien-Hercegovina 258 1,529 Afghanistan 243 2,506 Thailand 242 1,562 Sverige 239 1,826 Sverige 16 1,445 Vietnam 226 1,989 Vietnam 18 1,050 Island 210 2,112 Island 10 2,201 Filippinerne 201 1,050 Kina 195 1,372 Ukraine 183 1,693 Litauen 164 1,567 Rumænien 153 1,317 Rusland 148 1,737 Iran 143 1,290 Marokko 143 2,861 Marokko 64 1,993 Sri Lanka 135 1,744 Jugoslavien (eks.) 130 1,763 Jugoslavien (eks.) 94 1,783 Storbritannien [Great Britain] 100 1,762 Storbritannien 12 1,898 Indien 90 1,444 Indien 14 1,445 USA 84 1,396 Syrien 82 3,073 Letland 81 1,444 Nederlandene 77 2,027 Brasilien 73 1,559 Makedonien 64 2,050 Makedonien 15 2,166 Frankrig 60 1,450 Bulgarien 53 1,280 Myanmar (tidl. Burma) 53 3,458 Finland 51 1,485 Spanien 43 1,088 Ghana 41 2,191 Jugoslavien. Forb. Rep. 38 2,285 Kuwait 37 2,937 Ungarn 34 1,123 Estland 33 1,605 Uganda 33 1,655 Nigeria 32 2,972 Peru 31 1,972 Canada 30 1,511 Italien 29 941 Jordan 27 3,228 Jordan 23 2,721 Japan 26 1,114 Indonesien 25 1,706 Congo. Demokratiske Republik 22 3,421 Nepal 22 1,221 Etiopien 22 2,117 Hviderusland [Belarus] 22 1,655 Kenya 22 1,449 Kosovo 22 3,353 Mexico 21 1,451 Australien 21 1,564 Serbien og Montenegro 21 1,852 Serbien 20 2,856 Israel 20 2,370 Egypten 20 2,417 Tanzania 19 1,932 Tjekkiet 19 1,279 Burundi 19 2,530 Cameroun 19 2,343 Bangladesh 19 2,617 Tunesien 19 2,815 Congo 18 3,005 Slovakiet 18 1,214 Argentina 17 1,966 Sudan 17 2,805 Chile 16 1,578 Algeriet 16 2,814 Belgien 16 1,592 Sydafrika 15 1,980 Elfenbenskysten [Ivory coast] 15 3,351 Venezuela 15 2,010 Colombia 15 1,176 Østrig [Austria] 14 1,432 Zambia 13 2,198 Irland 13 1,446 Cuba 13 2,070 Statsløs 13 2,492 Gambia 12 1,778 Schweiz 12 1,192 Portugal 12 981 Mellemøsten uoplyst [unknown middle east] 11 3,414 Moldova 11 2,093 Malaysia 11 1,371 Armenien 11 1,632 Sovjetunionen (eks.) 11 1,613 Usbekistan 11 3,108 Kroatien 10 1,744 Sierra Leone 10 2,911
If one avoids breaking down by country, one can also get some neat longitudinal data that gives useful perspective with updated data (FERT1 table).
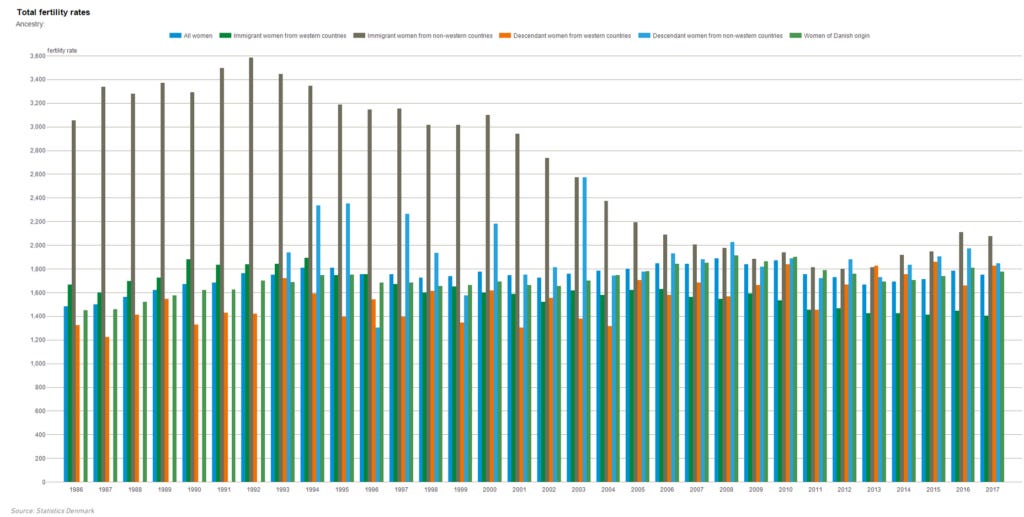
So, current 'Danish origin' (some partial foreigners in this group) fertility sits at ~1.8, which is good by comparison with developed countries in general. It can be seen that non-western 1st generations had a large decline since the 1980s and now roughly matches the other groups, though with a slight increase since 2012 or so. Immigrant women from western countries do not have many offspring. These probably represent a lot of power women who come to Denmark to work, and then neglect family life. 2nd generation non-westerns do not have particularly high fertility. This is surprising considering the relative low IQ of this group (85-90), and the known relationship between lower IQ and fertility (r = -.11 according to recent meta-analysis). In this case, the group level factors seem to overwhelm the expectation based on the individual level differences.