
Figlio et al 2017 race Scarr-Rowe results

Figlio, D. N., Freese, J., Karbownik, K., & Roth, J. (2017). Socioeconomic status and genetic influences on cognitive development. Proceedings of the National Academy of Sciences, 114(51), 13441-13446.
Accurate understanding of environmental moderation of genetic influences is vital to advancing the science of cognitive development as well as for designing interventions. One widely reported idea is increasing genetic influence on cognition for children raised in higher socioeconomic status (SES) families, including recent proposals that the pattern is a particularly US phenomenon. We used matched birth and school records from Florida siblings and twins born in 1994–2002 to provide the largest, most population-diverse consideration of this hypothesis to date. We found no evidence of SES moderation of genetic influence on test scores, suggesting that articulating gene-environment interactions for cognition is more complex and elusive than previously supposed.
Main result:
But they also tested Scarr-Rowe by race. Not reported in the paper, but we requested it. Described this way in our recent meta-analysis (which I will cover later):
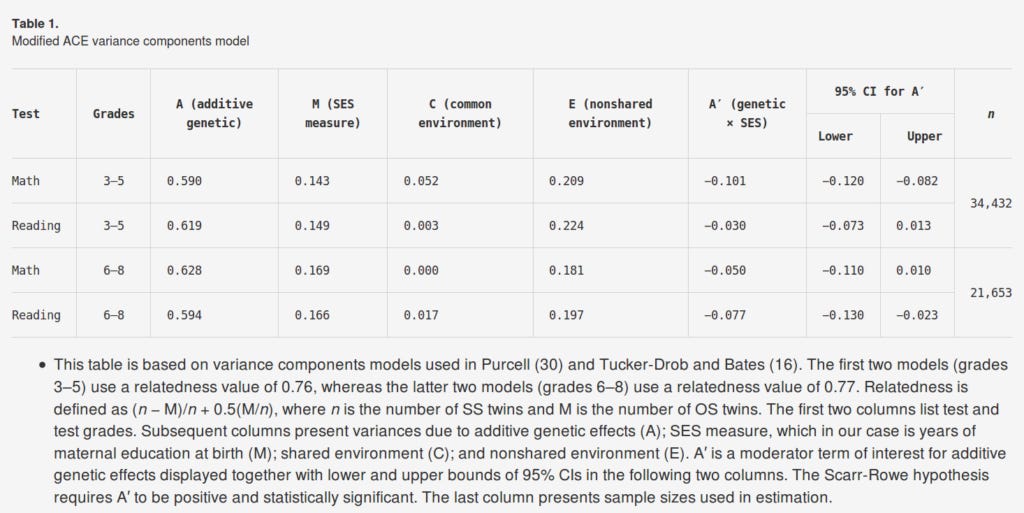
Figlio, Freese, Karbownik, and Roth (2017) investigated the Scarr-Rowe hypothesis for SES using administrative data from the Florida Public School System. The sample comprised 24,640 twins born between 1994 and 2002. The authors did not have information on zygosity, so they estimated heritabilities using a method similar to that employed by Scarr-Salapatek (1971). Multilevel mixed-effects linear regressions were used in the analysis, and results were computed separately for grades 3 to 5, and grades 6 to 8, for both the FCAT Math and Reading tests. The authors reported the absence of Scarr-Rowe interactions for SES in all comparisons. Figlio (2019, personal communication) provided “ABCE” estimates decomposed by race/ethnicity. The B in the model here is the variance explained by SES, and B is also a sub-component of C. We condensed these results into ACE estimates (i.e., by adding B and C) and standardized the results. We also added average math and reading ACE estimates per grade (third to fifth and sixth to eighth). These values are shown in Tables S3-S4. For Grades 3 to 5, the Black and White heritabilities (averaged for math and reading) were nearly identical: h2White= .57, S.E. = .05; h2Black = .56, S.E. = .09. However, the Hispanic heritability was substantially higher (h2Hispanic= .72, S.E. = .10). For Grades 5 to 6, the Black heritabilities were reduced somewhat compared to the White (h2White= .59, S.E. = .07; h2Black = .48, S.E. = .11), while the Hispanic heritability was again substantially elevated (h2Hispanic = .73, S.E. = .12). Means and standard deviations for this sample were not reported. Nonetheless, Figlio et al. (2017) reported math and reading FCAT averages for the 1994 to 2002 cohort from which the twins were sampled. Scores were not broken down by age. Using these data, the d-values were .96 (White-Black), .40 (White-Hispanic), and .57 (Hispanic-Black).