
From riches to rags to riches
What comes with difficulty, also comes back easily if lost

One of the interesting lines of evidence about the importance of human capital in wealth disparities comes from examples of how groups can recover from setbacks. There's several examples to draw upon.
Losers of World War 2
The most obvious example are the losers of World War 2, that is, Japan, Germany, and Italy. Japan and Germany suffered extreme damage to their infrastructure in the later stages of the war but were quickly able to recover. Graphically:

Notice the declines for war torn Germany, which declined more than 50%, and about 40% for Japan. Another way to look at the same idea is to look at their relative GDPpc to some neutral countries relatively less affected by WW2. I chose large Latin American countries, though of course they suffered from poor trade issues during the war. The recovery looks like this:
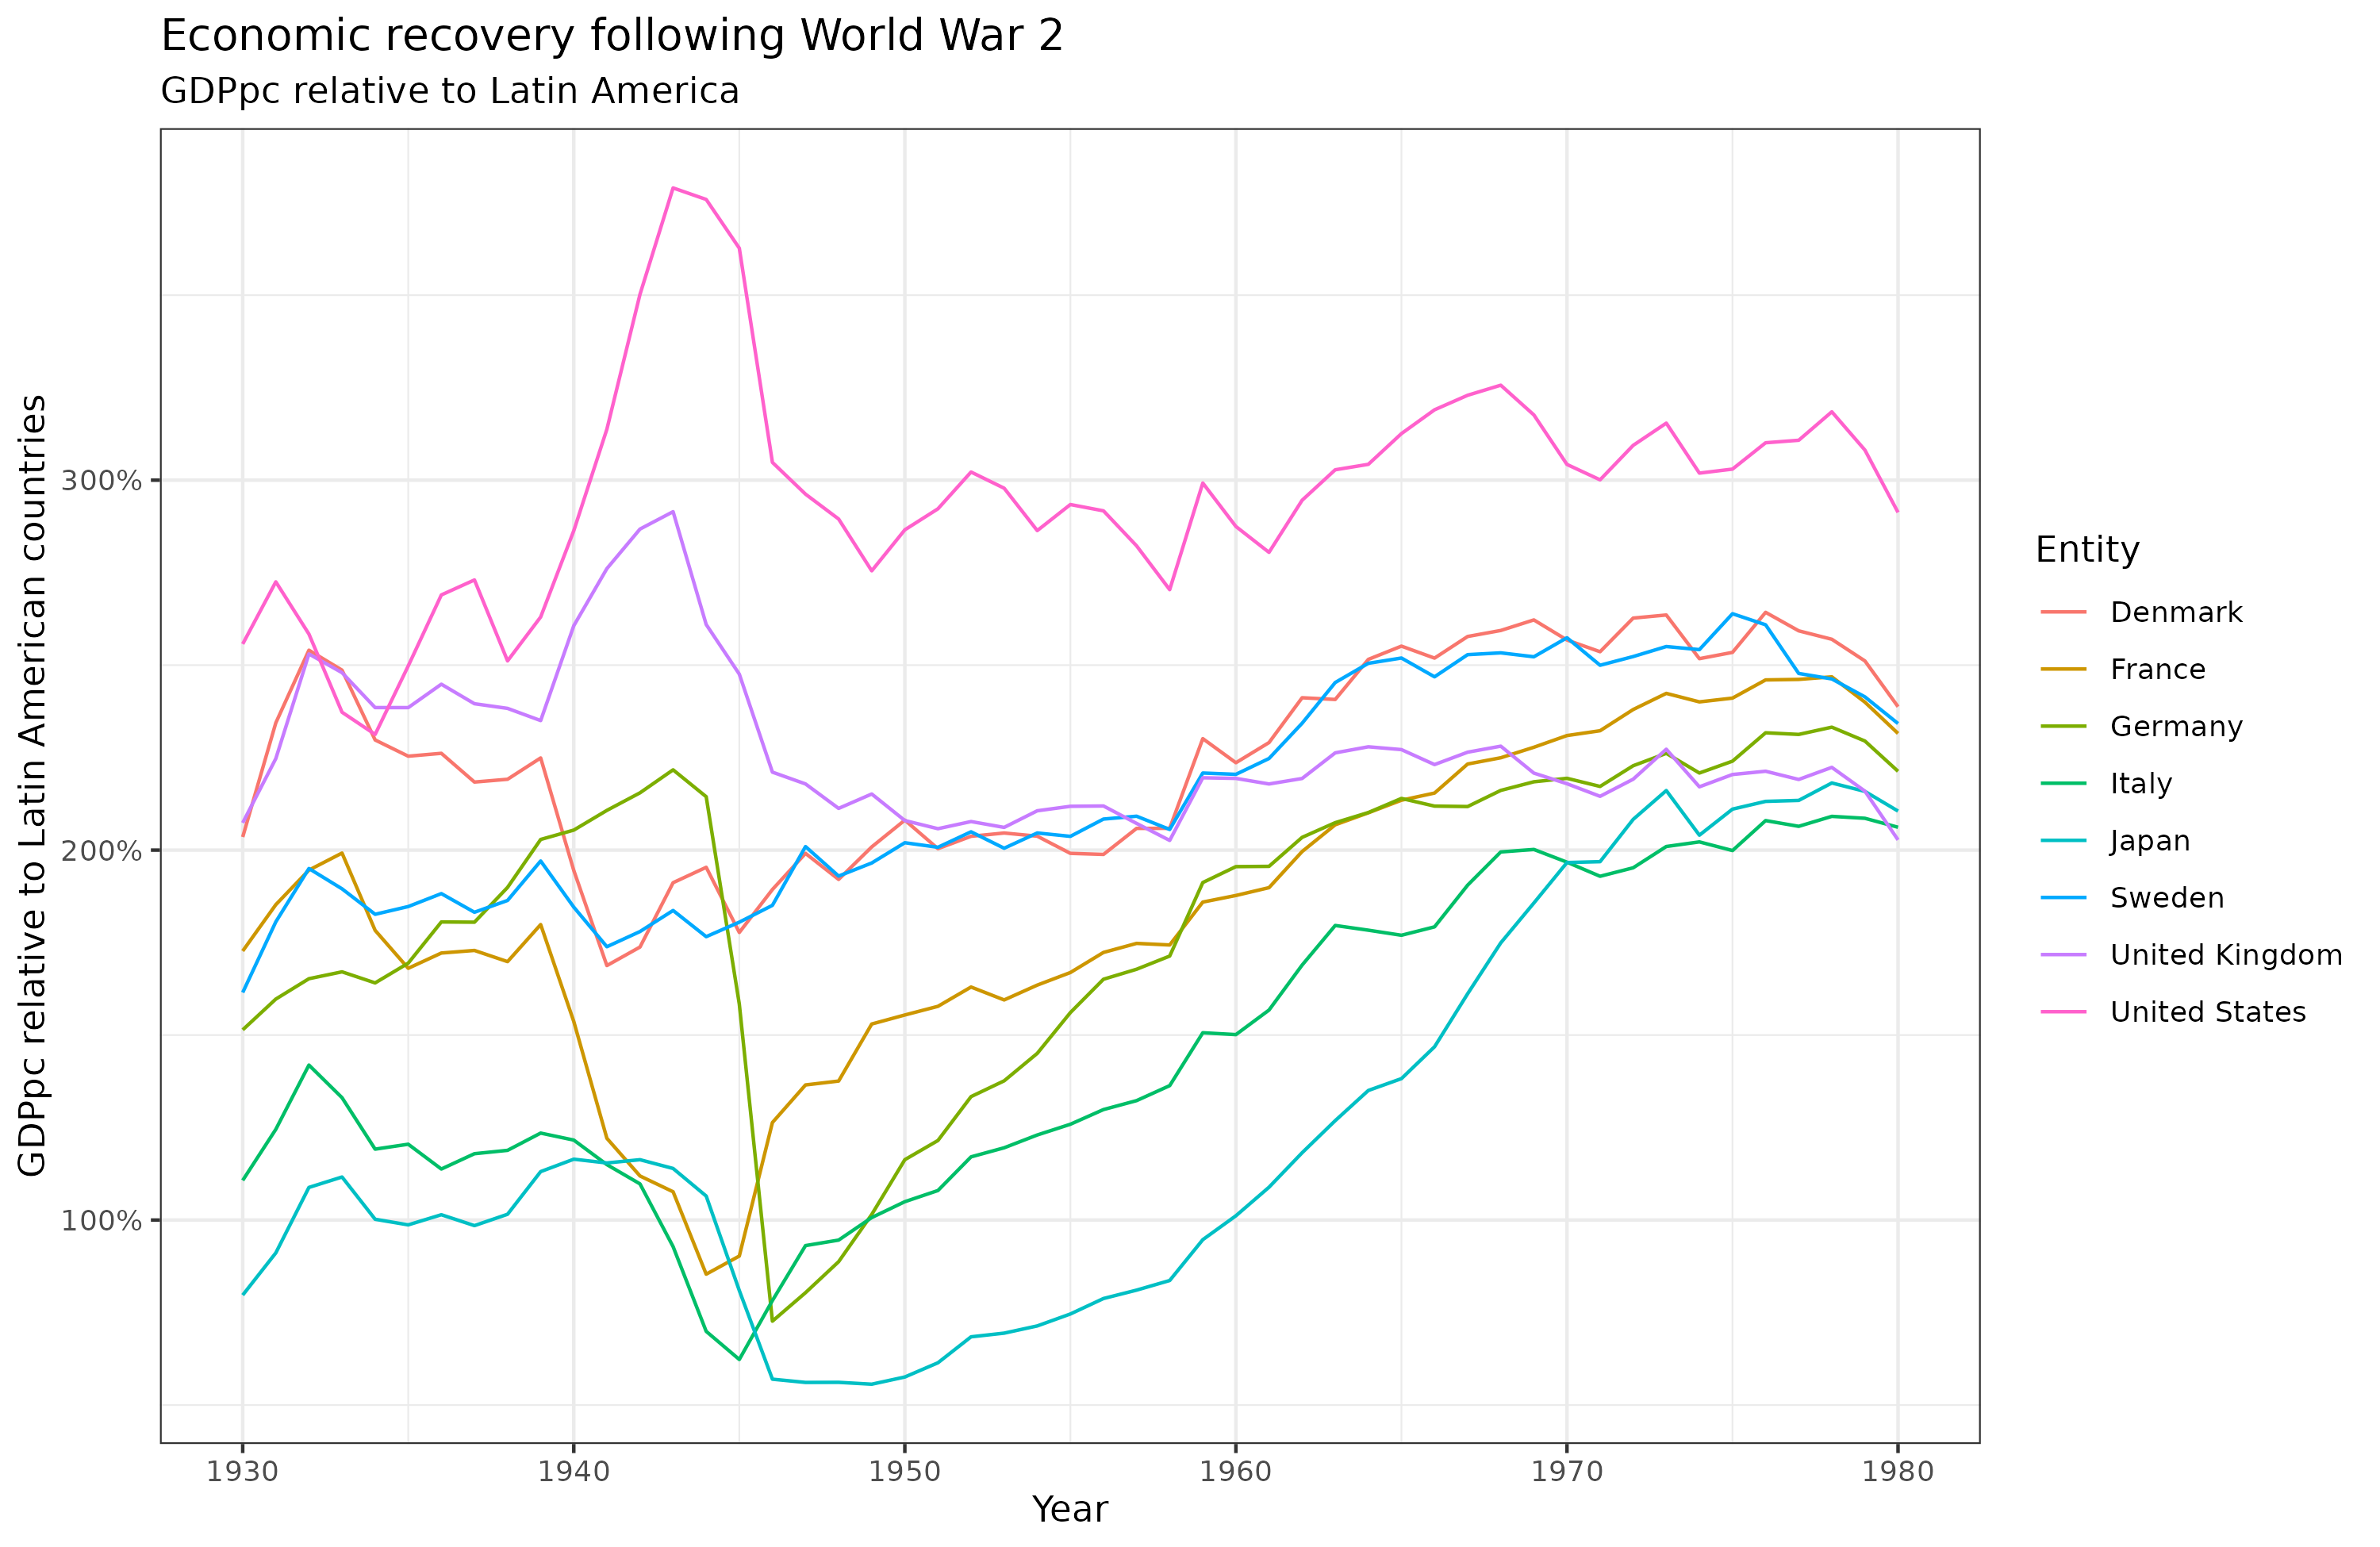
There's a massive downward spike for the Axis powers around 1943, as they started losing the war. Germany (what was left of it), however, only took about 20 years until it reached the same GDPpc, and afterwards its growth tapered off. Italy returned to its former level after only about 12 years, Japan took just short of 20 years.
Vietnam bombing
During the Vietnam war (1955-1975), America bombed a lot of cities in Vietnam to try to defeat the communists (backed by China). Because the cities hit had a somewhat random distribution compared to their pre-war wealth levels, one can look at the effects of the bombing and how long it took to return to their prior levels. There's a neat study on this:
Miguel, E., & Roland, G. (2011). The long-run impact of bombing Vietnam. Journal of development Economics, 96(1), 1-15.
We investigate the impact of U.S. bombing on later economic development in Vietnam. The Vietnam War featured the most intense bombing campaign in military history and had massive humanitarian costs. We use a unique U.S. military dataset containing bombing intensity at the district level (N = 584) to assess whether the war damage led to persistent local poverty traps. We compare the heavily bombed districts to other districts controlling for district demographic and geographic characteristics, and use an instrumental variable approach exploiting distance to the 17th parallel demilitarized zone. U.S. bombing does not have negative impacts on local poverty rates, consumption levels, infrastructure, literacy or population density through 2002. This finding indicates that even the most intense bombing in human history did not generate local poverty traps in Vietnam.

The amount of bombing was rather extreme:
discussed in Blattman and Miguel, 2010), and this is so for several reasons. One important issue is the difficulty of convincingly identifying war impacts on economic growth in the presence of dual causality between violence and economic conditions, and possible omitted variable biases (Miguel et al., 2004). But a perhaps even more fundamental constraint for empirical work is the lack of data on war damage and economic conditions in conflict and post-conflict societies. In this paper we exploit a data-rich historical episode to estimate bombing impacts on long-run economic performance, the U.S. bombing of Vietnam (what Vietnamese call “the American War”). The Indochina War, centered in Vietnam, was the most intense aerial bombing episode in history (Clodfelter, 1995): “The United States Air Force dropped in Indochina, from 1964 to August 15, 1973, a total of 6,162,000 tons of bombs and other ordnance. U.S. Navy and Marine Corps aircraft expended another 1,500,000 tons in Southeast Asia. This tonnage far exceeded that expended in World War II and in the Korean War. The U.S. Air Force consumed 2,150,000 tons of munitions in World War II — 1,613,000 tons in the European Theater and 537,000 tons in the Pacific Theater — and 454,000 tons in the Korean War.” Vietnam War bombing thus represented at least three times as much (by weight) as both European and Pacific theater World War II bombing combined, and about fifteen times total tonnage in the Korean War. Given the prewar Vietnamese population of 32 million, U.S. bombing translates into hundreds of kilograms of explosives per capita, more than the entire weight of the Vietnamese nation. For another comparison, the atomic bombs dropped at Hiroshima and Nagasaki had the power of roughly 15,000 and 20,000 tons of TNT, respectively (Grolier, 1995). Since general purpose bombs – by far the most common type of bomb used in Vietnam – are approximately 50% explosive material by weight, each atomic bomb translates into roughly 30,000 to 40,000 tons of such munitions. Measured this way, U.S. bombing in Indochina represents roughly 100 times the combined impact of the Hiroshima and Nagasaki atomic bombs.
In discussing their findings, the authors note that researchers who studied World War 2 using formal methods also found quick catch-up:
In related work, Davis and Weinstein (2002) show that the U.S. bombing of Japanese cities in World War II had no long-run impact on the population of those cities relative to prewar levels, and Brakman et al. (2004) find a similar result for postwar Germany. 6 Organski and Kugler (1977, 1980) find that the economic effects of the two world wars tended to dissipate after only 15–20 years (similar to our postwar timeframe of roughly 25 years), for both capitalist and socialist economies, after which there was a return to prewar growth trends. Przeworski et al. (2000) similarly find rapid postwar recovery in a cross-country analysis.
Confederate USA slave holders
The above studies looked at cities or regions, but it is also possibly to look at individuals. Some of this research has been done using slaveholders in the former Confederacy, who lost the US civil war (1861-65). These were wealthy people who owned slaves, but lost this wealth. If they were wealthy because of human capital reasons, we would expect them to regain some fraction of this, and their children to markedly catch-up towards their long-term trend. Cremieux has a related, useful review on Black Economic Progress After Slavery, but here will be looking at:
Ager, P., Boustan, L., & Eriksson, K. (2021). The intergenerational effects of a large wealth shock: white southerners after the Civil War. American Economic Review, 111(11), 3767-94.
The nullification of slave wealth after the U.S. Civil War (1861-65) was one of the largest episodes of wealth compressions in history. We document that white Southern households holding more slave assets in 1860 lost substantially more wealth by 1870, relative to households that had been equally wealthy before the war. Yet, the sons of former slaveholders recovered relative to comparable sons by 1900, and grandsons surpassed their counterparts in educational and occupational attainment by 1940. We find that social networks facilitated this recovery, with sons marrying into other former slaveholding families. Transmission of entrepreneurship and skills appear less central.
In a figure:

For people who had a lot of wealth from slave owning in 1960, their wealth was still reduced in 1870. However, their sons had actually caught back up by 1900. Likewise with the grandsons.
With regards to the finding about the lack of a role of inherited ability. My guess as to why they find this conclusion is that wealth from slave owning was underestimated, and thus their matching procedures systematically underestimated the human capital level of slave owners and their descendants. But this is just my guess.
Chinese communism
In his book The son also rises economic historian Greg Clark tracked elite surnames to gauge social mobility across many countries. One of these was China, where the situation was dire:
In Sweden, there is debate about whether there ever was any political revolution. Thus, according to one author, “Conventional wisdom holds that Sweden’s transition to democracy was exceptionally gradual, stepwise and non-revolutionary.”2 In India, the British were expelled, and a new country was born in the violence of Partition and its mass population movements in 1947. Even so, in most parts of India the transition was smooth. The new rulers of India in the Congress Party were the same Brahmin elite who had governed as part of the Indian Civil Service under the British. In fifty of the sixty-six years of Indian independence, the prime minister has been a Brahmin.
China, by contrast, experienced in the twentieth century a revolution unparalleled in its ferocity, bloodlust, class hatred, and mass dispossession. The sclerotic Qing imperial regime collapsed by 1912. Although the Nationalist Party won the election of 1912, warlords remained in control of the central government in Beijing. The Nationalists by 1925 established a rival capital in the south. It took more than a decade of fighting for Chiang Kai-shek, leader of the Nationalists, to defeat his northern rivals and reunify China under Nationalist rule in 1928. But this unity was fragile, beset by continuing armed conflict with remnant warlords, the Communist Party, and in 1937 open conflict with the Japanese, who had previously seized Manchuria. The Communists came to power in 1949 after decades of social turmoil.
The final Communist victory produced a generation of unprecedented social dislocation. Perhaps a million mainland Chinese fled to Taiwan with the Nationalists, including many Nationalist functionaries and sympathizers from the middle and upper classes. Many Shanghai businesses transferred their operations to Hong Kong, which also received hundreds of thousands of refugees.
Under the agrarian reform of 1946–53, as much as 43 percent of the farmland of China was seized from the landlord class and redistributed.3 In the process, some 800,000 landlords were executed.4 This was because land reform was mainly a political movement to eliminate opponents and potential opponents of the revolution. These executions represented only perhaps one in a thousand of the rural population, but this figure represented a significant fraction of the old elite.5
The Cultural Revolution of 1966–76 saw another round of mistreatment and purges of “class enemies”—relatives of former landlords, businessmen, and anyone suspected of having a bourgeois background. Teachers and intellectuals, particularly those in positions of authority, were frequent targets. Thousands died at the hands of the Red Guards, the militant youth wing of the Communist Party. As many as half a million in the cities were shipped to the countryside for reeducation through labor. The institutions of society—universities, hospitals, government ministries—were paralyzed, placed under the control of erratic teenage revolutionary committees. But by 1967 the Cultural Revolution had dissolved into a bloody mess, into which the army entered both on the side of the Red Guards and in defiance of them. All across the countryside, alleged class enemies were being confronted, abused, and killed (figure 9.1). The total death toll from the chaos of the Cultural Revolution is unknown but has been estimated to be as high as ten million.
However, when looking up modern data for the elite surnames, these are still over-represented among the current elite, despite the efforts of the communists to eradicate their advantages:

Clark explains:
Assuming that the jinshi elite of 1820–1905 and the Nationalist officials of 1912–49 were also comparably elite groups, it is also possible to calculate the mobility rate between these two eras.11 The decline of the relative representation of the thirteen Qing elite surnames among the Nationalist officials implies an intergenerational correlation of status of 0.8.
These results are supported by data on student admissions to Tsinghua University from 2003 to 2011. As one of the top ten universities in China, Tsinghua again represents an elite at the pinnacle of the education distribution. The relative representation of the thirteen Qing elite surnames, even relative to the three regional surnames, was still 1.62. Since these students, entering university at age 18, are a full three generations removed from the Nationalist officials of 1912–49, this figure again implies an intergenerational correlation of 0.83. Despite the disruptions of civil war, land reform, and the Cultural Revolution, the data show a very slow decline in status of the Qing elite within Communist China.
These results are all subject to random errors, because the sample sizes of some of the elites are modest. The samples include 9,363 Qing jinshi, 26,738 Nationalist officials, and 26,429 elite university professors. Of these samples, only 39, 62, and 51, respectively, hold one of the thirteen Qing elite surnames. Just by chance, the number of Qing elite surnames could deviate significantly from the underlying trend in any of these samples. So none of the individual estimates of intergenerational correlations from these samples can be relied on. The true value of each could deviate substantially from the estimate.
Nevertheless, it is clear from these samples that these thirteen Qing surnames remain elite. And there is another sample so large as to give absolute confirmation of their continuing enhanced status: the household registration details of all 1.3 billion Chinese in 2008. This database records whether individuals have completed a university degree. There are 29,604 people with one of the Qing elite surnames who have a university degree. Now the sampling error is minuscule.
The household registrations reveal that in 2012, 2.6 percent of all Chinese held university degrees; for holders of the regional three surnames, the figure was 3.5 percent. Degree attainment is 58 percent higher for the Qing elite surnames than for the big three surnames and 30 percent higher than for the regional surnames. The relative representation of the Qing surnames is lower among university graduates than among professors, but this is exactly what we would expect given that university graduates in general are a much less elite population.
Degree attainment has expanded rapidly in the last ten years, and therefore the average date for the awarding of these degrees is 1998. Thus this population is three generations separated from the Nationalist elite of 1912–49. Allowing for this, and for the lower exclusivity of the pool of modern university graduates, the implied intergenerational correlation over these three generations is 0.78, very similar to what was implied by the smaller more elite samples.
There is still random error associated with the smaller sample of Nationalist officials. This could lead to under- or overestimation of the rate of social mobility between 1912–49 and 2008. Taking this into account, we can be 95 percent confident that the true intergenerational correlation of status for Communist China lies in the range 0.71–0.92. Even at the lower bound of this range of estimates, this is a remarkable degree of status persistence by the elite in a society that experienced the degree of turbulence and anti-elitist actions in the early years of Communist rule.
Discussion
These kinds of findings are relatively easy to make sense of when we think of social and economic outcomes from a mainly heritable, human capital perspective. In this model, the relative wealth of a polity is mainly caused by its average level of human capital (chiefly intelligence). Human capital is in turn mostly genetically determined. As such, if one gives a large negative effect from some temporary circumstance (war, famine, communism, revolution), the polity or individual is likely to experience rapid growth following its removal, and will return to its long-term trend line. This is what we see for Germany, Japan, and Italy after World War 2.
Here some will object that the recovery of the former Axis powers was due to US subsidies (Marshall plan in Europe). The problem with this idea is that wealthy countries have also tried doing the same kind of growth program in other regions of the world, and they have never worked very well. For instance, we might read:
Doucouliagos, H., & Paldam, M. (2009). The aid effectiveness literature: The sad results of 40 years of research. Journal of economic surveys, 23(3), 433-461.
The aid effectiveness literature (AEL) consists of empirical macroeconomic estimates of the effects of development aid. By the end of 2004, it comprised 97 econometric studies of three families of related effects. Each family has been analyzed in a separate meta-analysis. The AEL is an ideal subject for meta-analysis as it uses only a few formally similar models to estimate the same underlying effects. It is also an area with strong beliefs, often generated by altruism. When this whole literature is examined, a clear pattern emerges. After 40 years of development aid, the preponderance of the evidence indicates that aid has not been effective. We show that the distribution of results is significantly asymmetric reflecting the reluctance of the research community to publish negative results. The Dutch disease effect on exchange rates provides a plausible explanation for the observed aid ineffectiveness.
The reason economic aid doesn't work is that these countries are poor because of low average human capital. One cannot just boost economic growth by giving them money or trying to help them. Growth has to come from within.
The more you read history stories, the more you understand things get better in the end.
People forget that Germany, Japan, and Italy were among the most developed countries in the world in the 1930's and much of their wealth survived the war, not only infrastructure and human capital but also institutions. The Marshall Plan just got things rolling again.
Clarke's argument is weakened because he interprets the survival of the educated upper class as being representative of the fate of the actual elite. Intelligentsia is resilient because it controls stable institutions like universities and academies while the mercantile class is far more vulnerable to both the vagaries of the market and the shocks of revolutions. Plus the educated have credentials and intellectual skills which survived communist nationalizations better than capital. Intellectuals were also overrepresented in revolutionary movements and were often privileged by communist regimes as long as they kept the party line.
In Eastern Europe many pre-communist writers, artists and professors led cushy lives by praising the Party while the few who resisted met grim fates. The members of the aristocracy and the bourgeoisie were not that lucky being systematically targeted for repression and in the best case they were allowed to join the ranks of intellectuals or paper pushers but (almost) never did they remained in the elite.