

The reader survey for 2026 is currently ongoing, so don’t forget to take it here. Also, there’s an AMA-post here.
Ever since people started noticing that the GCSE results show substantial narrowing and even reversal of commonly found race gaps in test scores in the United Kingdom, the debate has been renewed about whether the UK gaps were actually closing or closed (The Guardian has an article from 2010). I guess from the egalitarian perspective it is seen as a success, this time affirmative action / amelioration / the programs finally worked. In the HBD circles, John Fuerst was the first to point it out in a post from 2012. Later Chisala (2015) wrote a post using the same results and quotes making the egalitarian case (without acknowledging Fuerst). This is now some years ago, and further posts have been made by Wright & Francis (dead link), Cremieux (2024), and Noah Carl (2026). Of course, the egalitarian results are commonly cited by the likes of Sasha Gusev. Academic attention has been relatively scant. There are 3 studies that published fresh meta-analyses of intelligence test scores by race in the UK: Pesta et al (2023), Nijenhuis et al (2024), and Lynn & Fuerst (2021). All three studies showed substantial gaps remain and that GCSE was anomalous. Of the above, Cremieux is the most thorough narrative report, and the academic papers the largest datasets. As far as I know, 100% of the original investigative work on the topic was done by hereditarian-aligned researchers, and 0% by the egalitarians. This is the normal pattern.
Some months ago, I stumbled upon another test that I think wasn’t covered in the above, so I want to summarize the results here. They come from the GIA: General Intelligence Assessment (results from the GIA Technical Manual which I can’t share here). This is a battery of tests used for hiring purposes in the UK. The publisher has a technical manual describing the test, its psychometric properties, and some results. It has 5 tests, which are:
Perceptual Speed (PS)
Reasoning (R)
Number Speed and Accuracy (NSA)
Word Meaning (WM)
Spatial Visualisation (SV)
These are rather normal. The innovative part is that all items are generated on the fly using an automatic item generation approach. As such, it is not possible to study for specific knowledge ahead of time since all of the items involve being rather fast at solving simple problems. For instance:
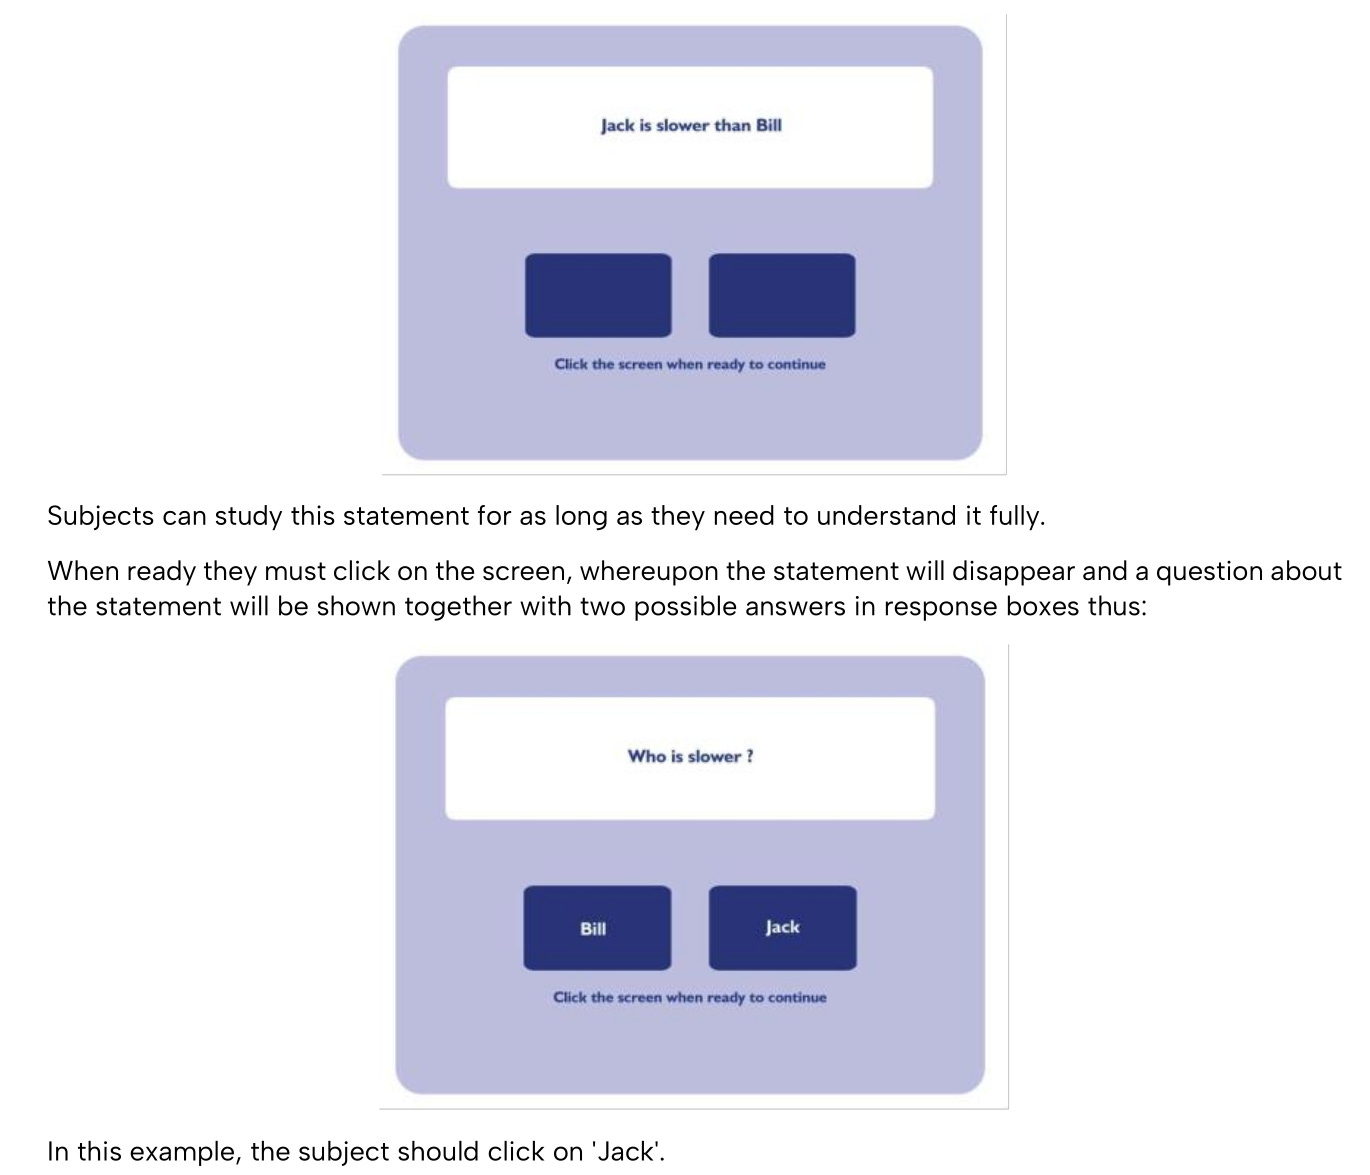
The questions don’t really involve much need for English aside from the ability to quickly understand basic sentences. So there should be only some but not much language bias against non-natives. Other tests don’t involve English words as such, but they do use Roman letters, so people raised with other scripts may be at some disadvantage:
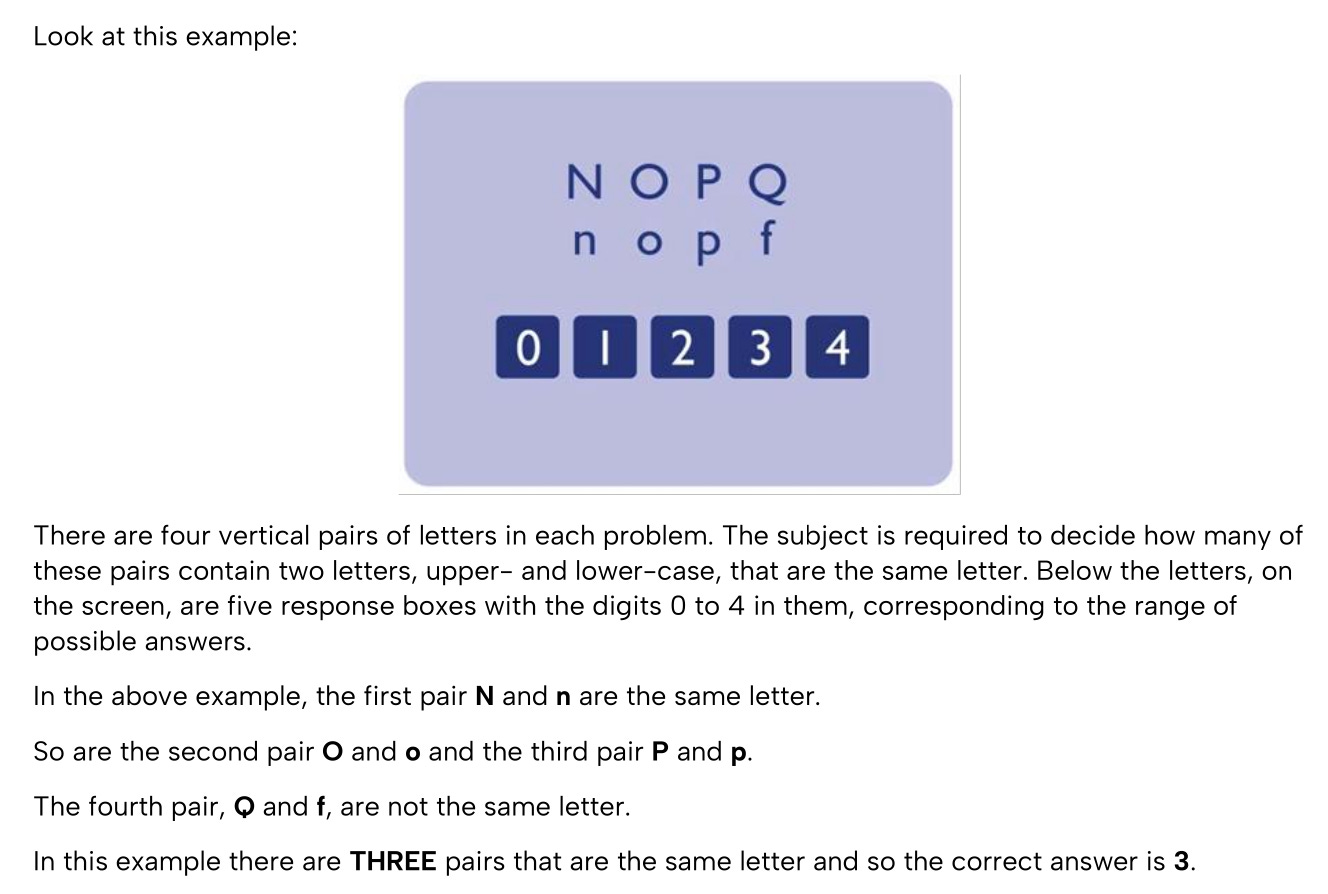
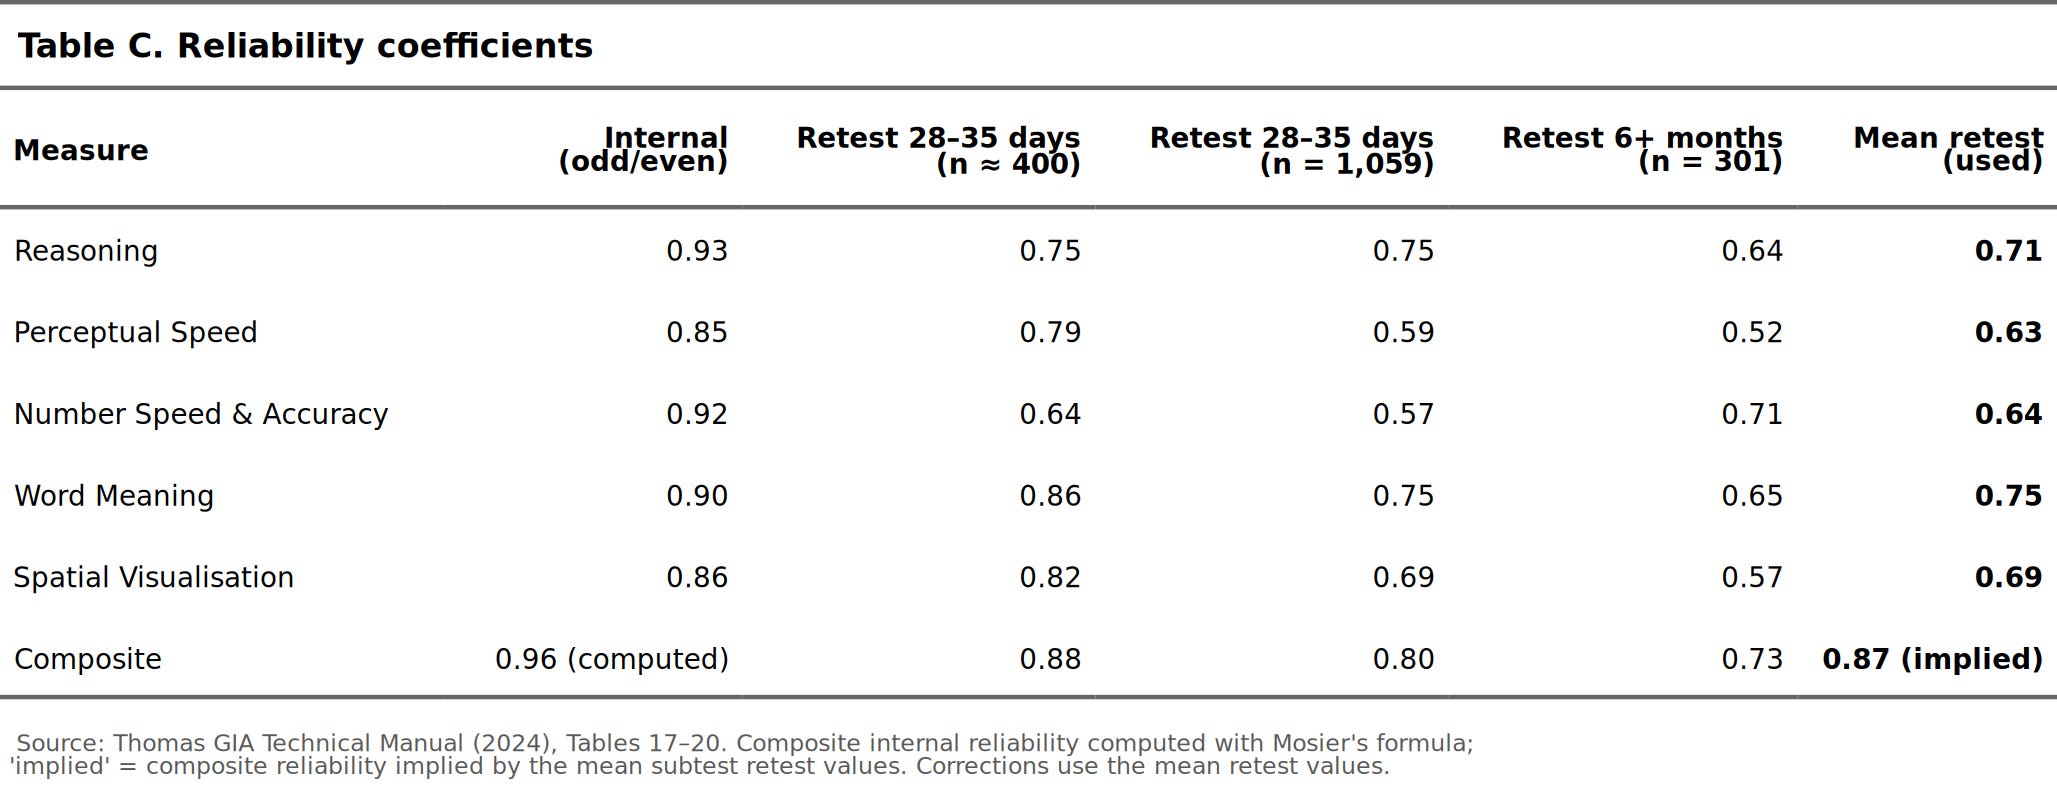
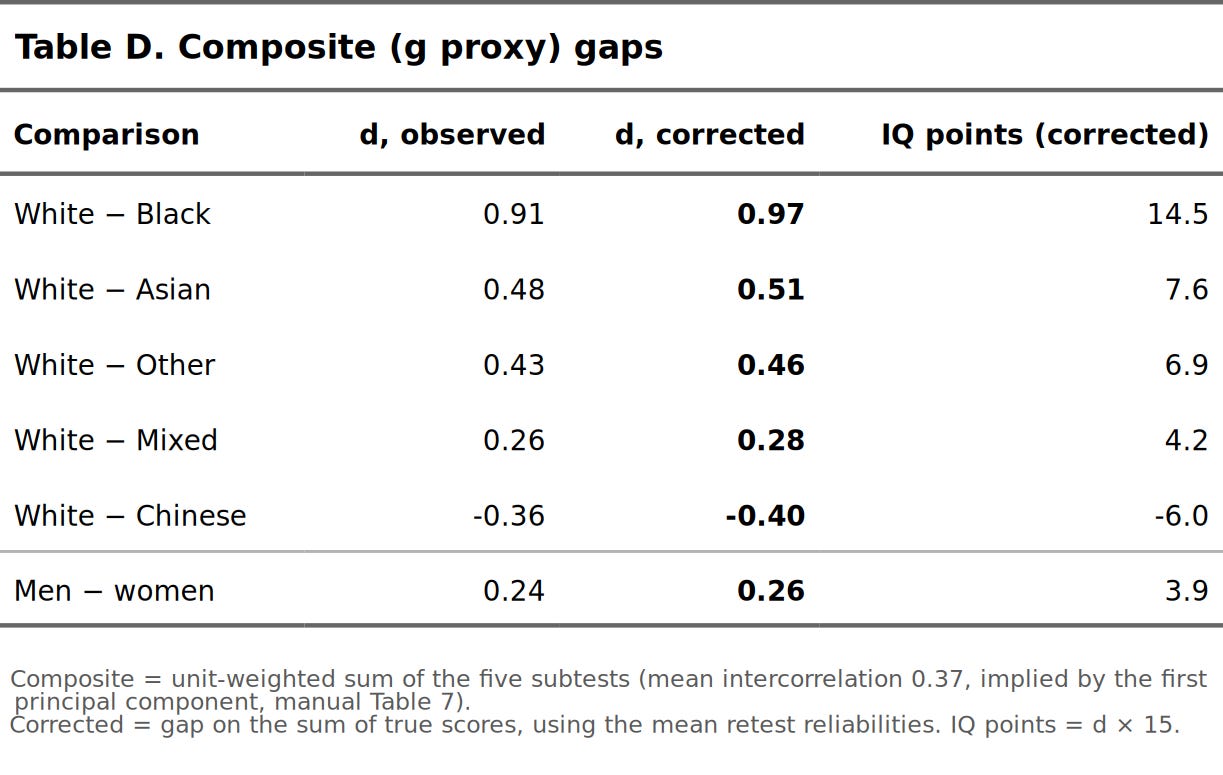
The psychometric properties were fine, e.g. test-retest reliability for the composite g score was about 0.84 after about a month (mean of the two one-month studies), while the implied internal reliability of the composite was 0.96. Using these values and the raw table of results (posted in the bottom of this post), we can compute these gaps on g:
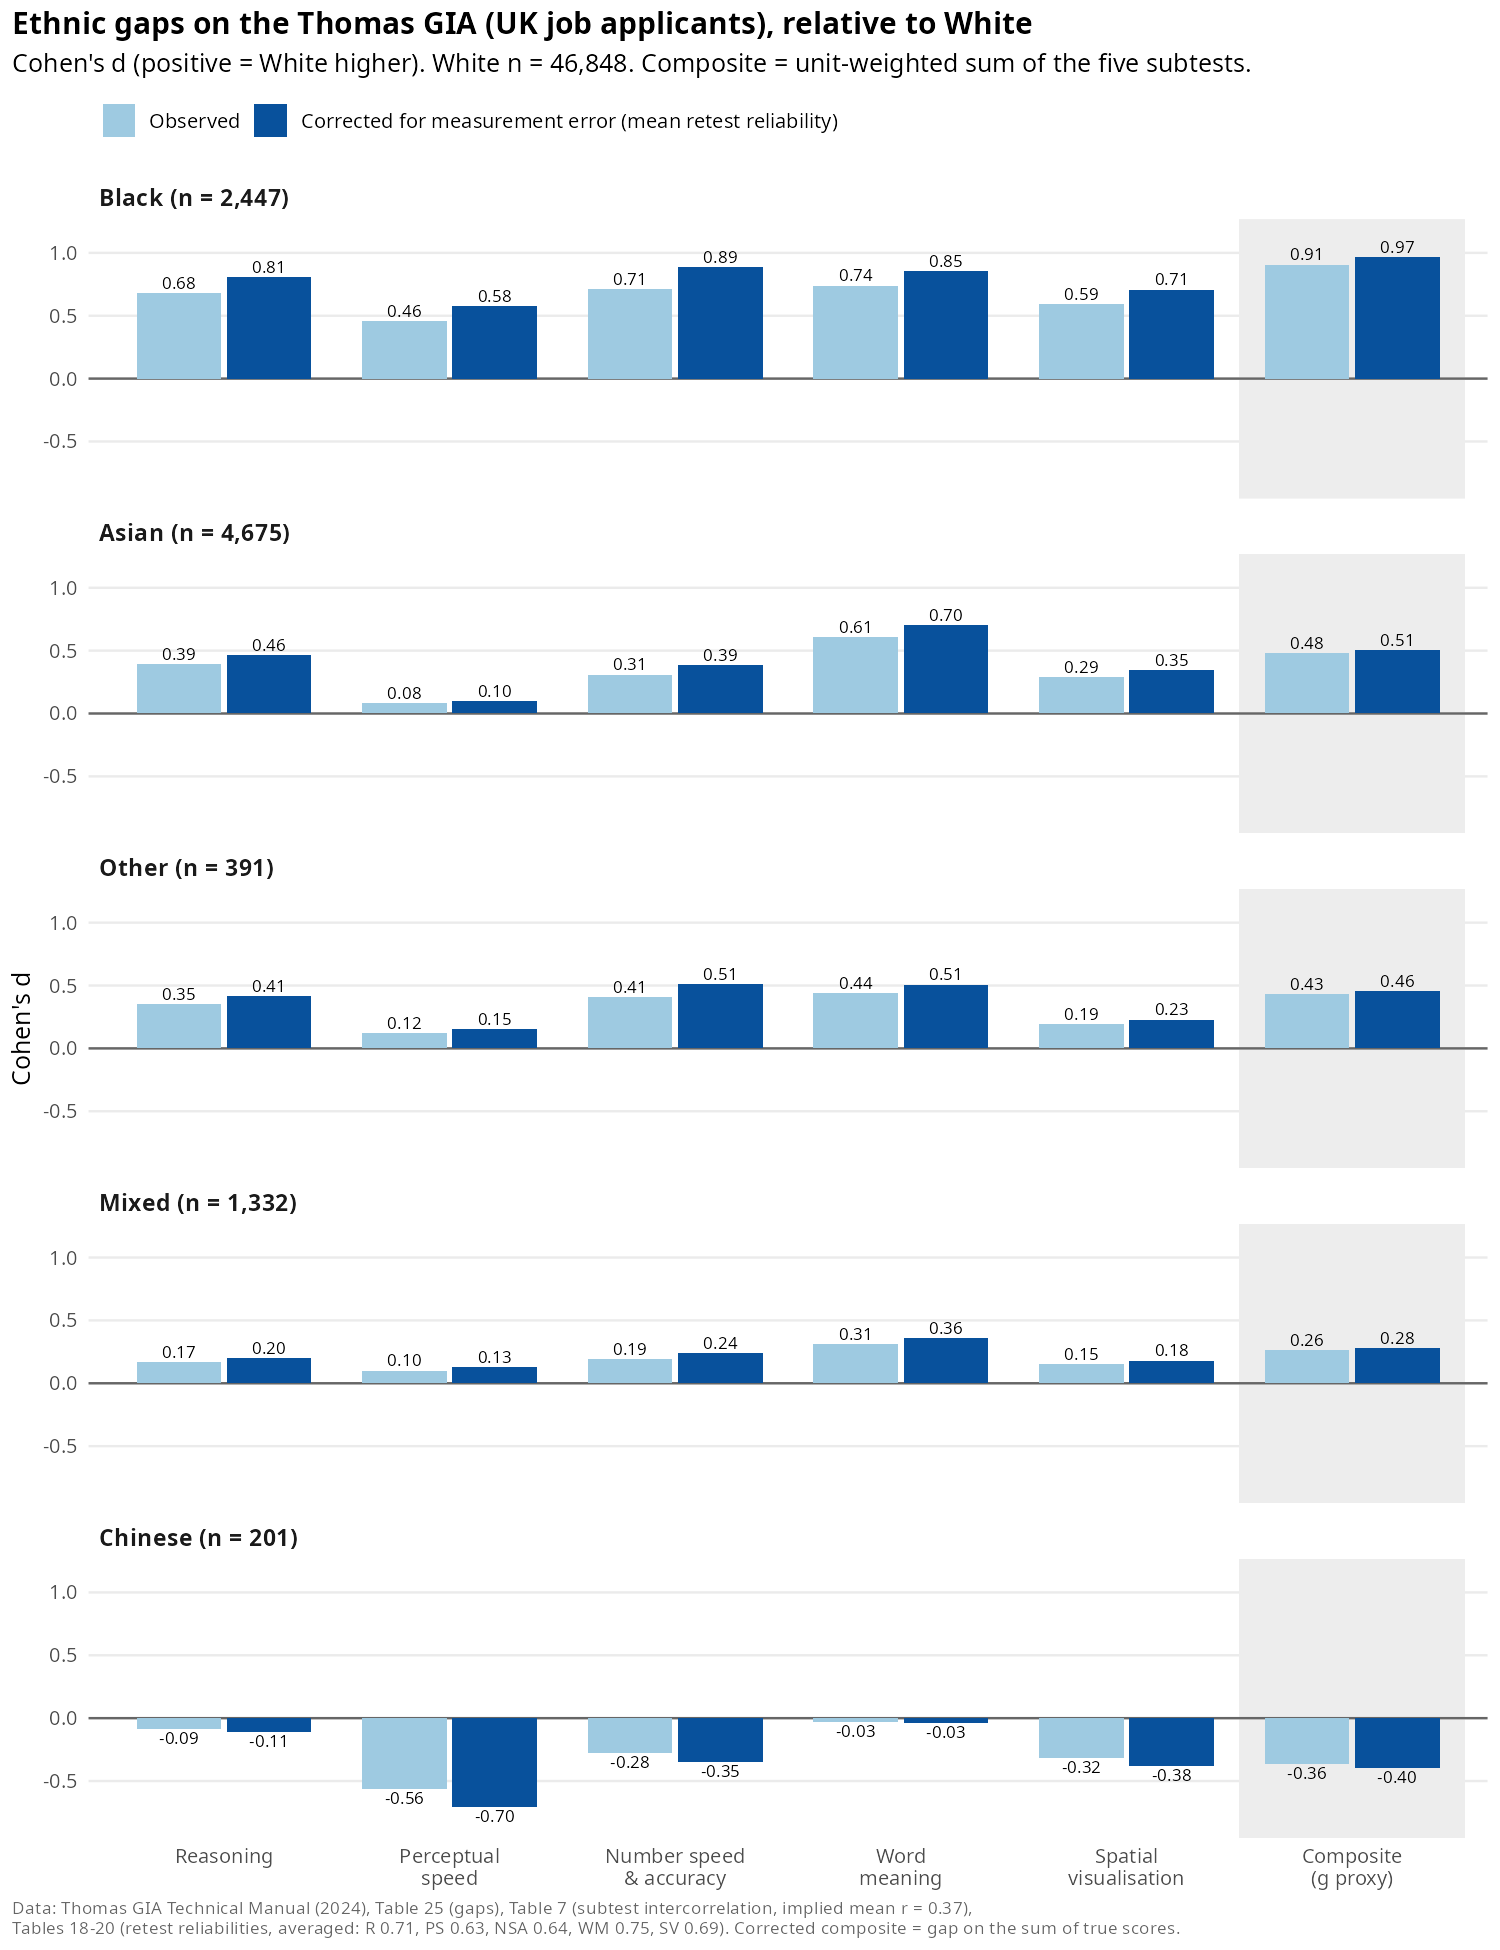
Thus, the GIA finds the same pattern as we see elsewhere. Chinese do better than UK Whites by about 0.40 d, and the other groups do worse, with Blacks scoring 0.97 d lower. The difference is not strongly affected by the choice of reliability correction, though it can become 1.06 d if one wants to use the lowest value (6+ months retest of r = .73). There did not appear to be any differences in variance related to selection, so no corrections were needed for that. These are mostly employees or job applicants, so they are not entirely representative of the adult population. Also keep in mind that these labels are based on the UK’s racial terminology, so “Asian” is not really Asian in the regular meaning but South Asian, that is, Indian, Pakistani, and Bangladeshi (Indian subcontinent). The manual doesn’t provide results for the finer breakdowns (White British, Black Caribbean etc.), so these are all we have to work with.
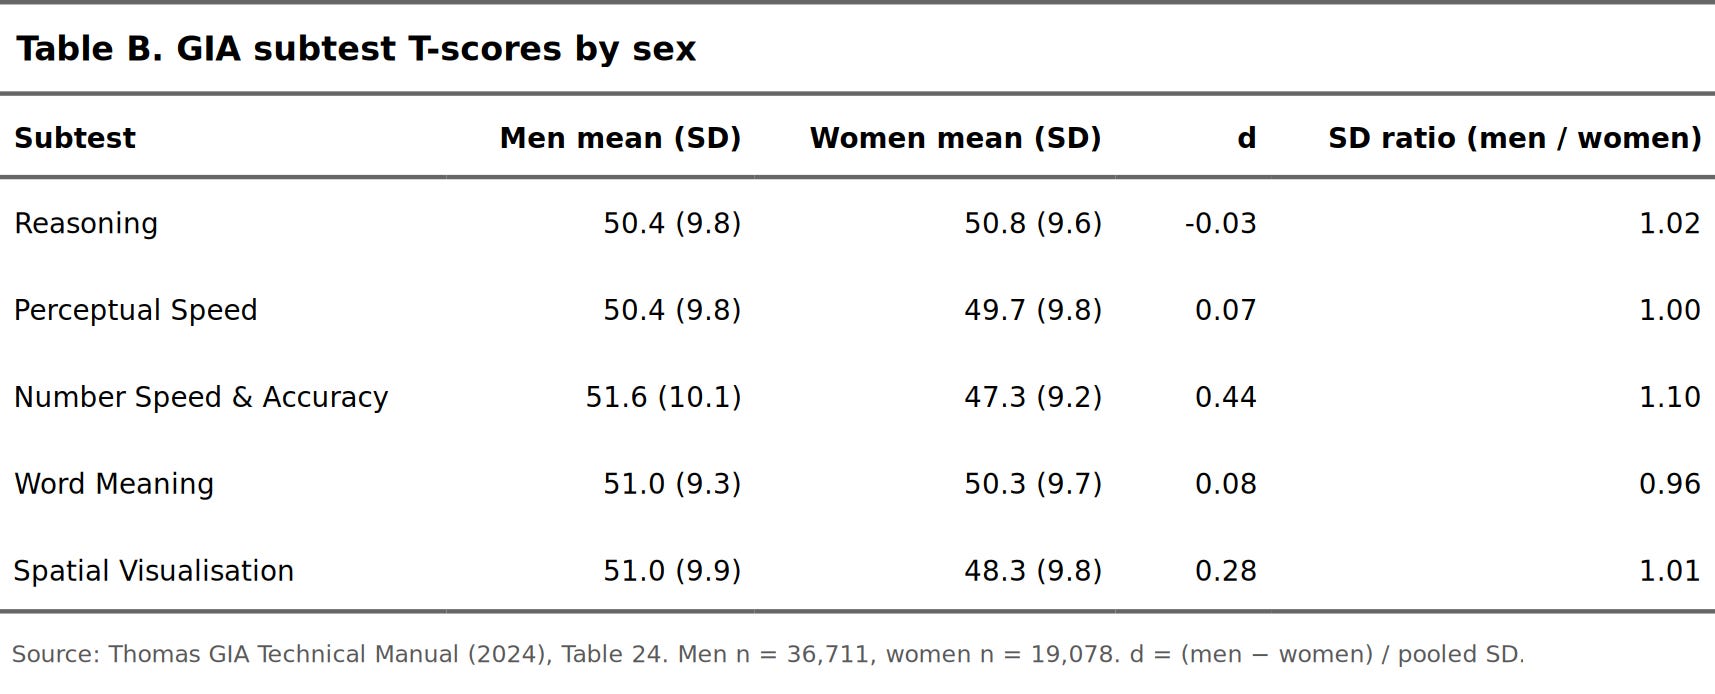
For good measure, here are the sex differences as well:
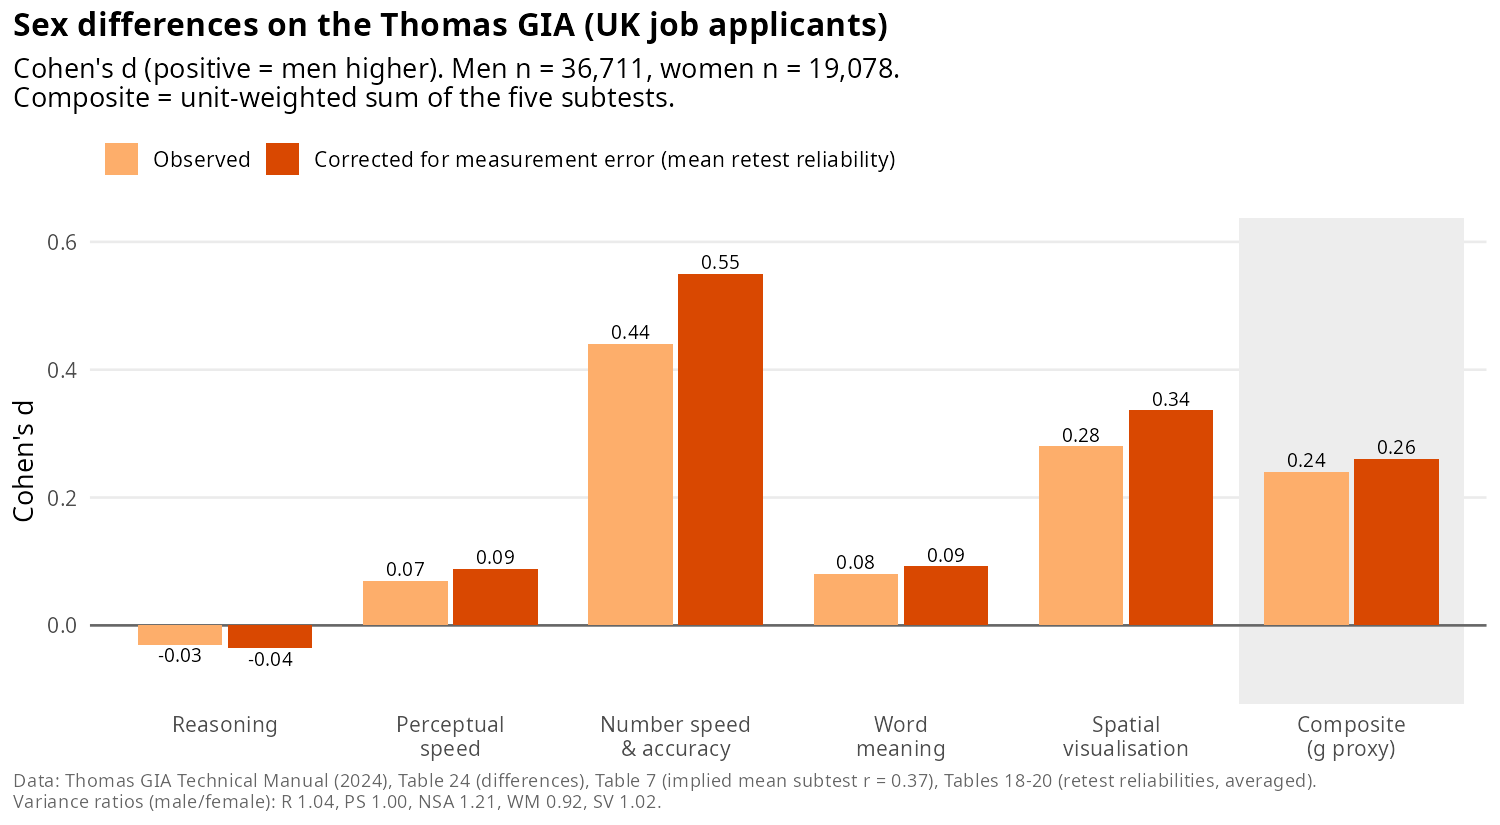
So men obtained about 0.26 d higher or about 4 IQ. A normal result as well. The main anomalous result was that the variance differences were not seen.
Overall, this body of evidence again shows the race gaps are relatively normal with regards to the Blacks and Whites. The South Asians did worse than the Whites by about 0.5 d. We know from the more detailed results from other studies that there is substantial heterogeneity by group, with Indians doing better than the others. Thus, given this evidence, it is still unwise to rely on the GCSE results to prove gap closing in general. Rather, it remains somewhat of a mystery what happened to the GCSE scores. I don’t know if this is specific test motivation differences, extra test preparation, school selection, or data fraud that explains the large changes seen. Maybe some day we will find out. In the meantime, hereditarianism is not in danger of refutation from the results. Rather, the total body of evidence strongly shows the usual gaps.
The raw numbers
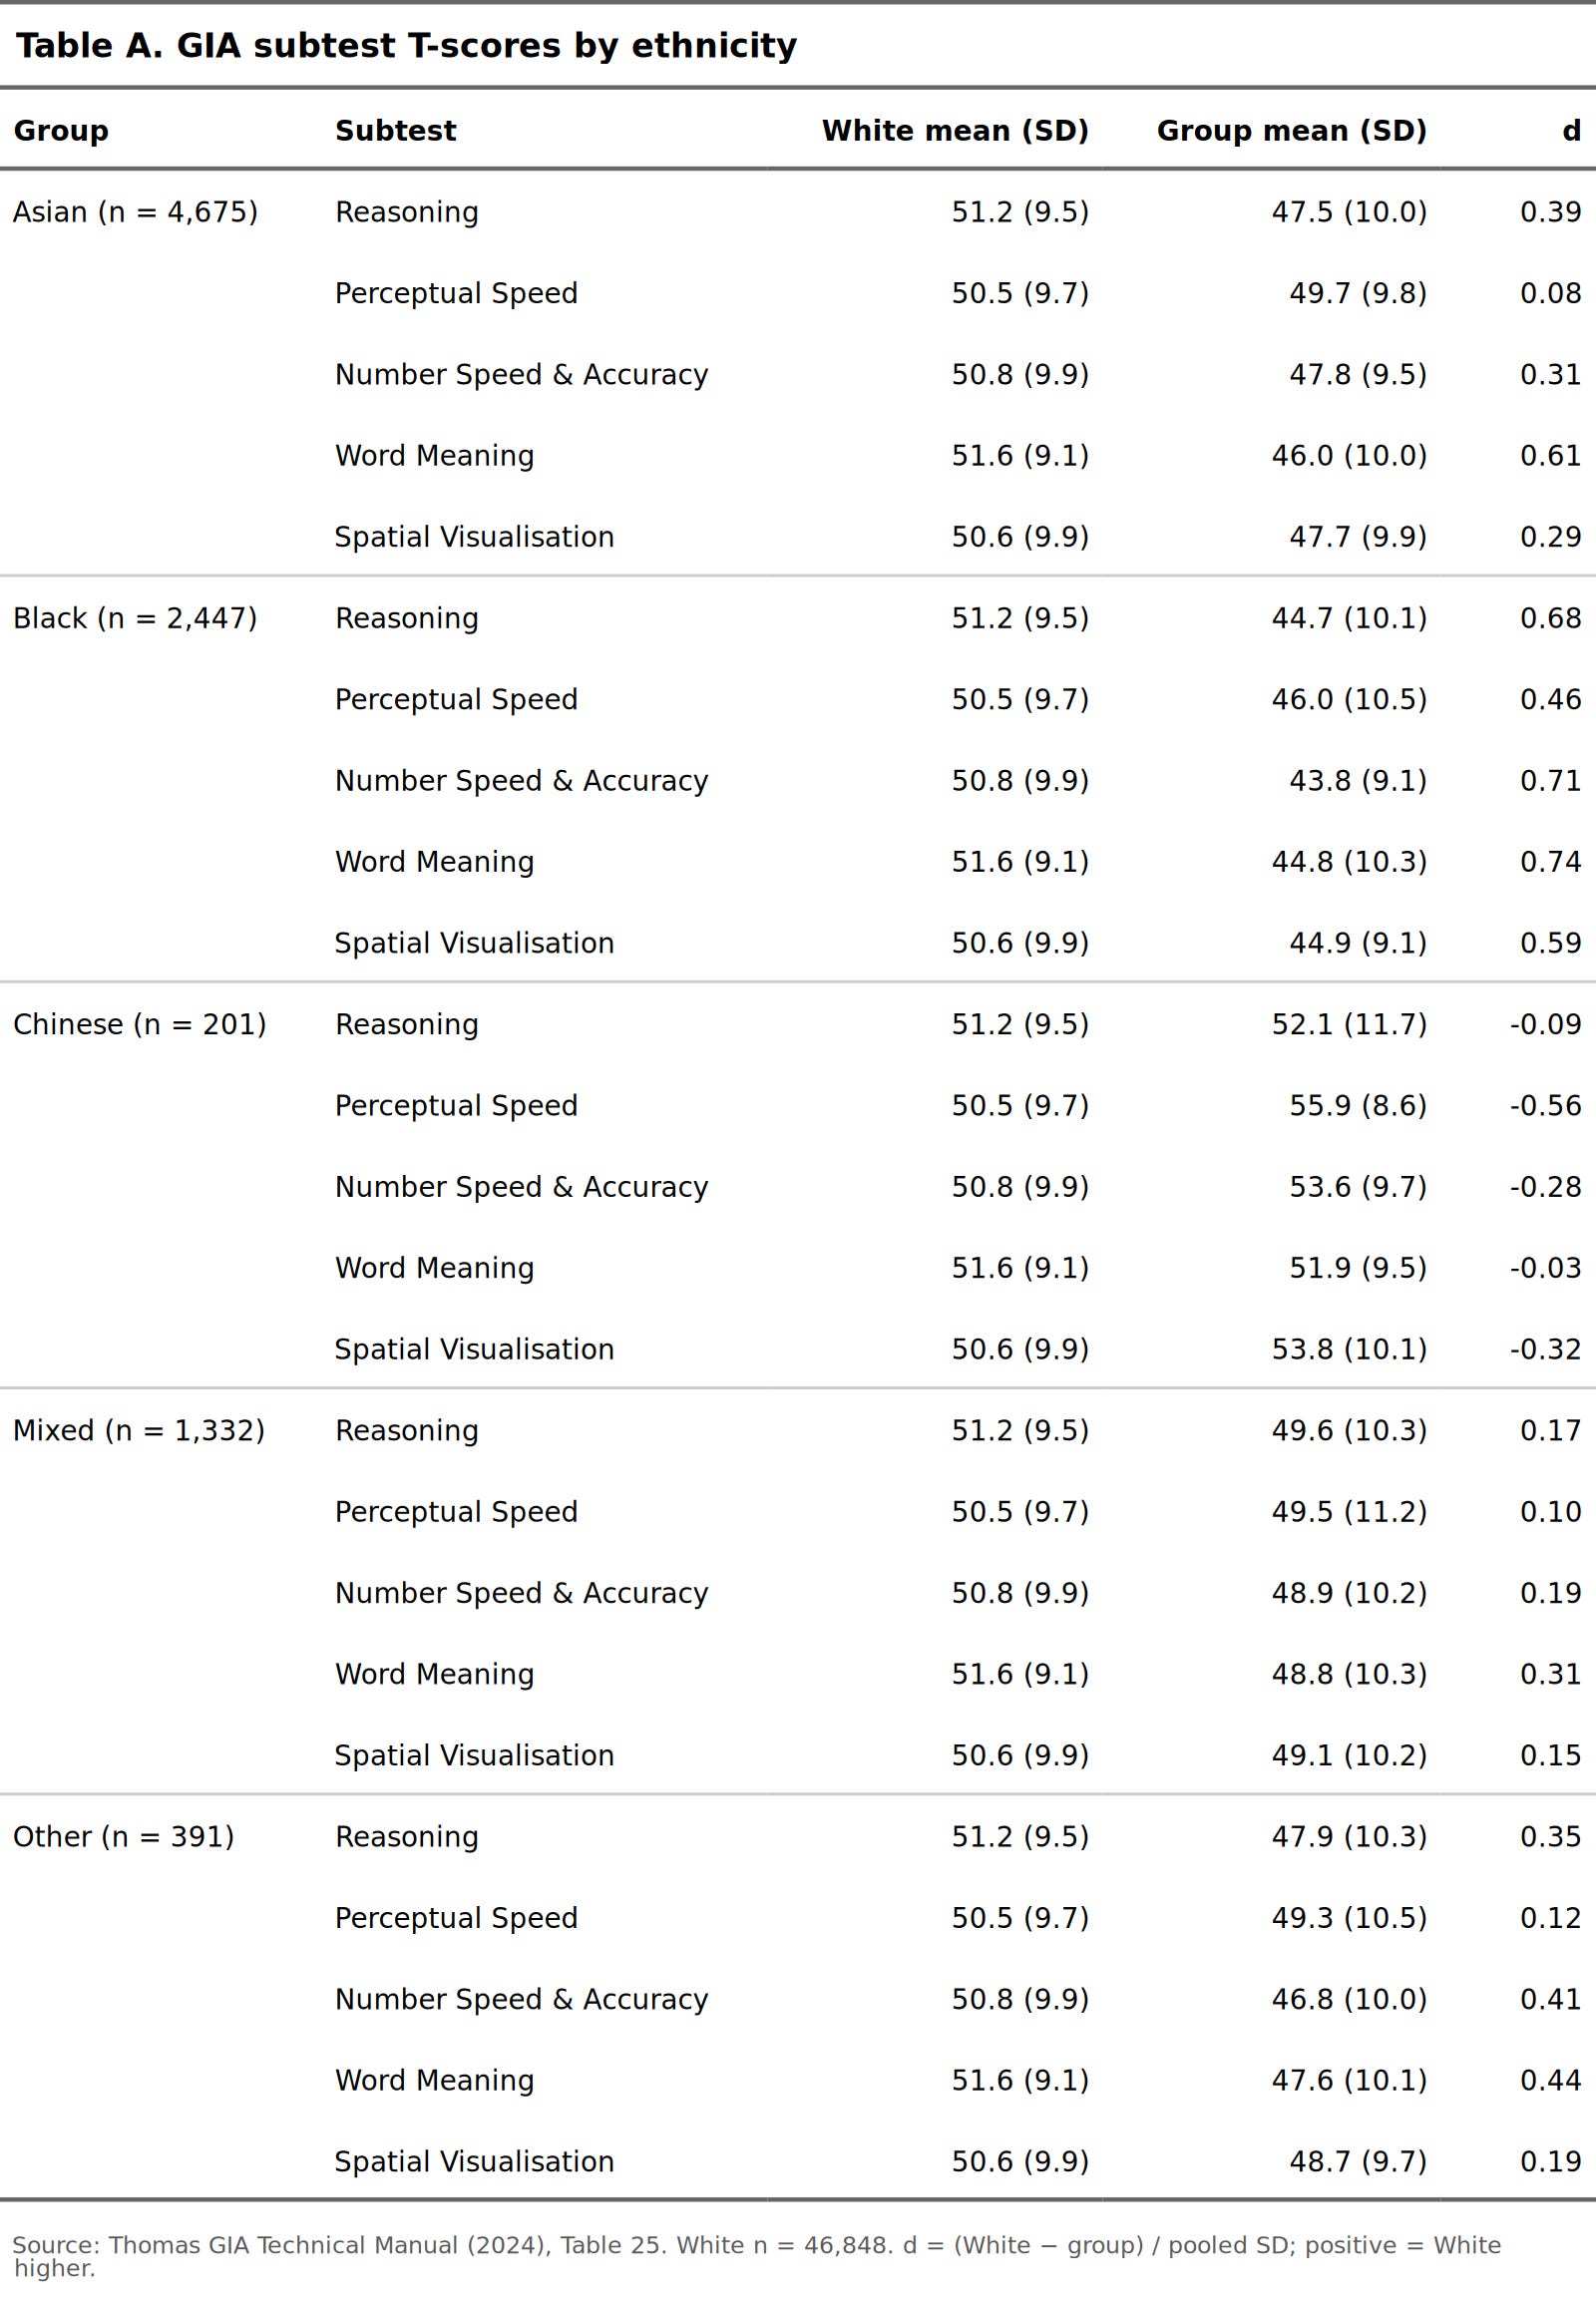
1. GCSE are very dumbed down. 2. GCSE's are very rewarding to effort and coaching: African black, Indian and Chinese families do much more coaching and put much higher pressure to succeed at GCSEs. 3. Girls also have considerably better performance than boys which is not due to higher IQ but to higher effort and conformity to adults expectations. 4. Relatively good performance by blacks fades out by A level and university. 5. Black Caribbeans who are less selected do considerably worse than black Africans and whites. 6. More blacks do not take GCSEs (core) because they are in special education. 7. IGCSEs (international GCSEs) are not included in the standard GCSE comparison and are taken by fee-paying schools whose pupils do better than kids in state schools and where black pupils are under-represented.
Why focus on GCSE? Why not A-Levels? Or even Stem A-levels?
The data is available here and you can use other surveys giving data on proportion of population by ethnicity taking certain G loaded subjects (maths, further maths, etc) to get a better estimate -> https://www.ethnicity-facts-figures.service.gov.uk/education-skills-and-training/a-levels-apprenticeships-further-education/students-aged-16-to-18-achieving-3-a-grades-or-better-at-a-level/latest/#main-facts-and-figures.
Interesting that there is such heterogeneity in the (mostly south?) "asian" sample based on above. Probably impacting results here. See in particular the Technical Education certificates. These are for more industry related work. Sample size drops quickly... selection effects?
https://www.ethnicity-facts-figures.service.gov.uk/education-skills-and-training/a-levels-apprenticeships-further-education/average-score-for-students-taking-a-levels-and-other-qualifications/latest/#by-ethnicity-a-level-students-only
Indians are anomalous, but the Pakistani population is deeply inbred from what I know. So i wonder if there is enough data to compare the effects of inbreeding generally on similar groups. Most sikhs are indian punjabis and there are many of them in the UK and they border Pakistan. Also Gujaratis are common and they too neighbor pakistan. So this may make for an interesting result on inbreeding depression and its effects on G.
Also Bengalis tend to get a little East Asian. Does this result in better performance for them or better life outcomes? They seem to do about the same.
I would be careful with east asian performance due to the fact that the sample size seems low and they are a selected bunch. Most come from Hong Kong which was a magnet for human capital very early on. British trading outpost, etc. The difference in scores between Black British and White British is smaller than the difference between White British and Chinese British.