Many people were asking me about the g-loadings of the tests on the site. The answer is somewhat complicated because:
We don’t have many people who took all the tests.
We have severe sample selection bias, takers are far above average, and some tests have severe ceiling effects.
Tests vary in reliability, some are short, some long.
Tests vary in English ability dependency. Non-natives are not likely to perform at their true verbal ability level on a foreign language test, especially not vocabulary.
We can attempt to get around these problems by:
Using pairwise complete cases to estimate correlations among each pair of tests. From these we can build a reasonably full correlation matrix, which allows us to use matrix-based methods including factor analysis/structural equation modeling.
We can estimate sample selection bias, and attempt to adjust for ceiling bias.
We can estimate test reliabilities or use reference values and adjust for these.
We don’t have data on what language people speak natively, but we have IPs and thus can infer countries with some accuracy. Then we can assume that people in English speaking countries are mostly native speakers and those elsewhere mostly not. We can compare results.
Starting with (4), we can have a brief look if it even looks like we have to do anything:
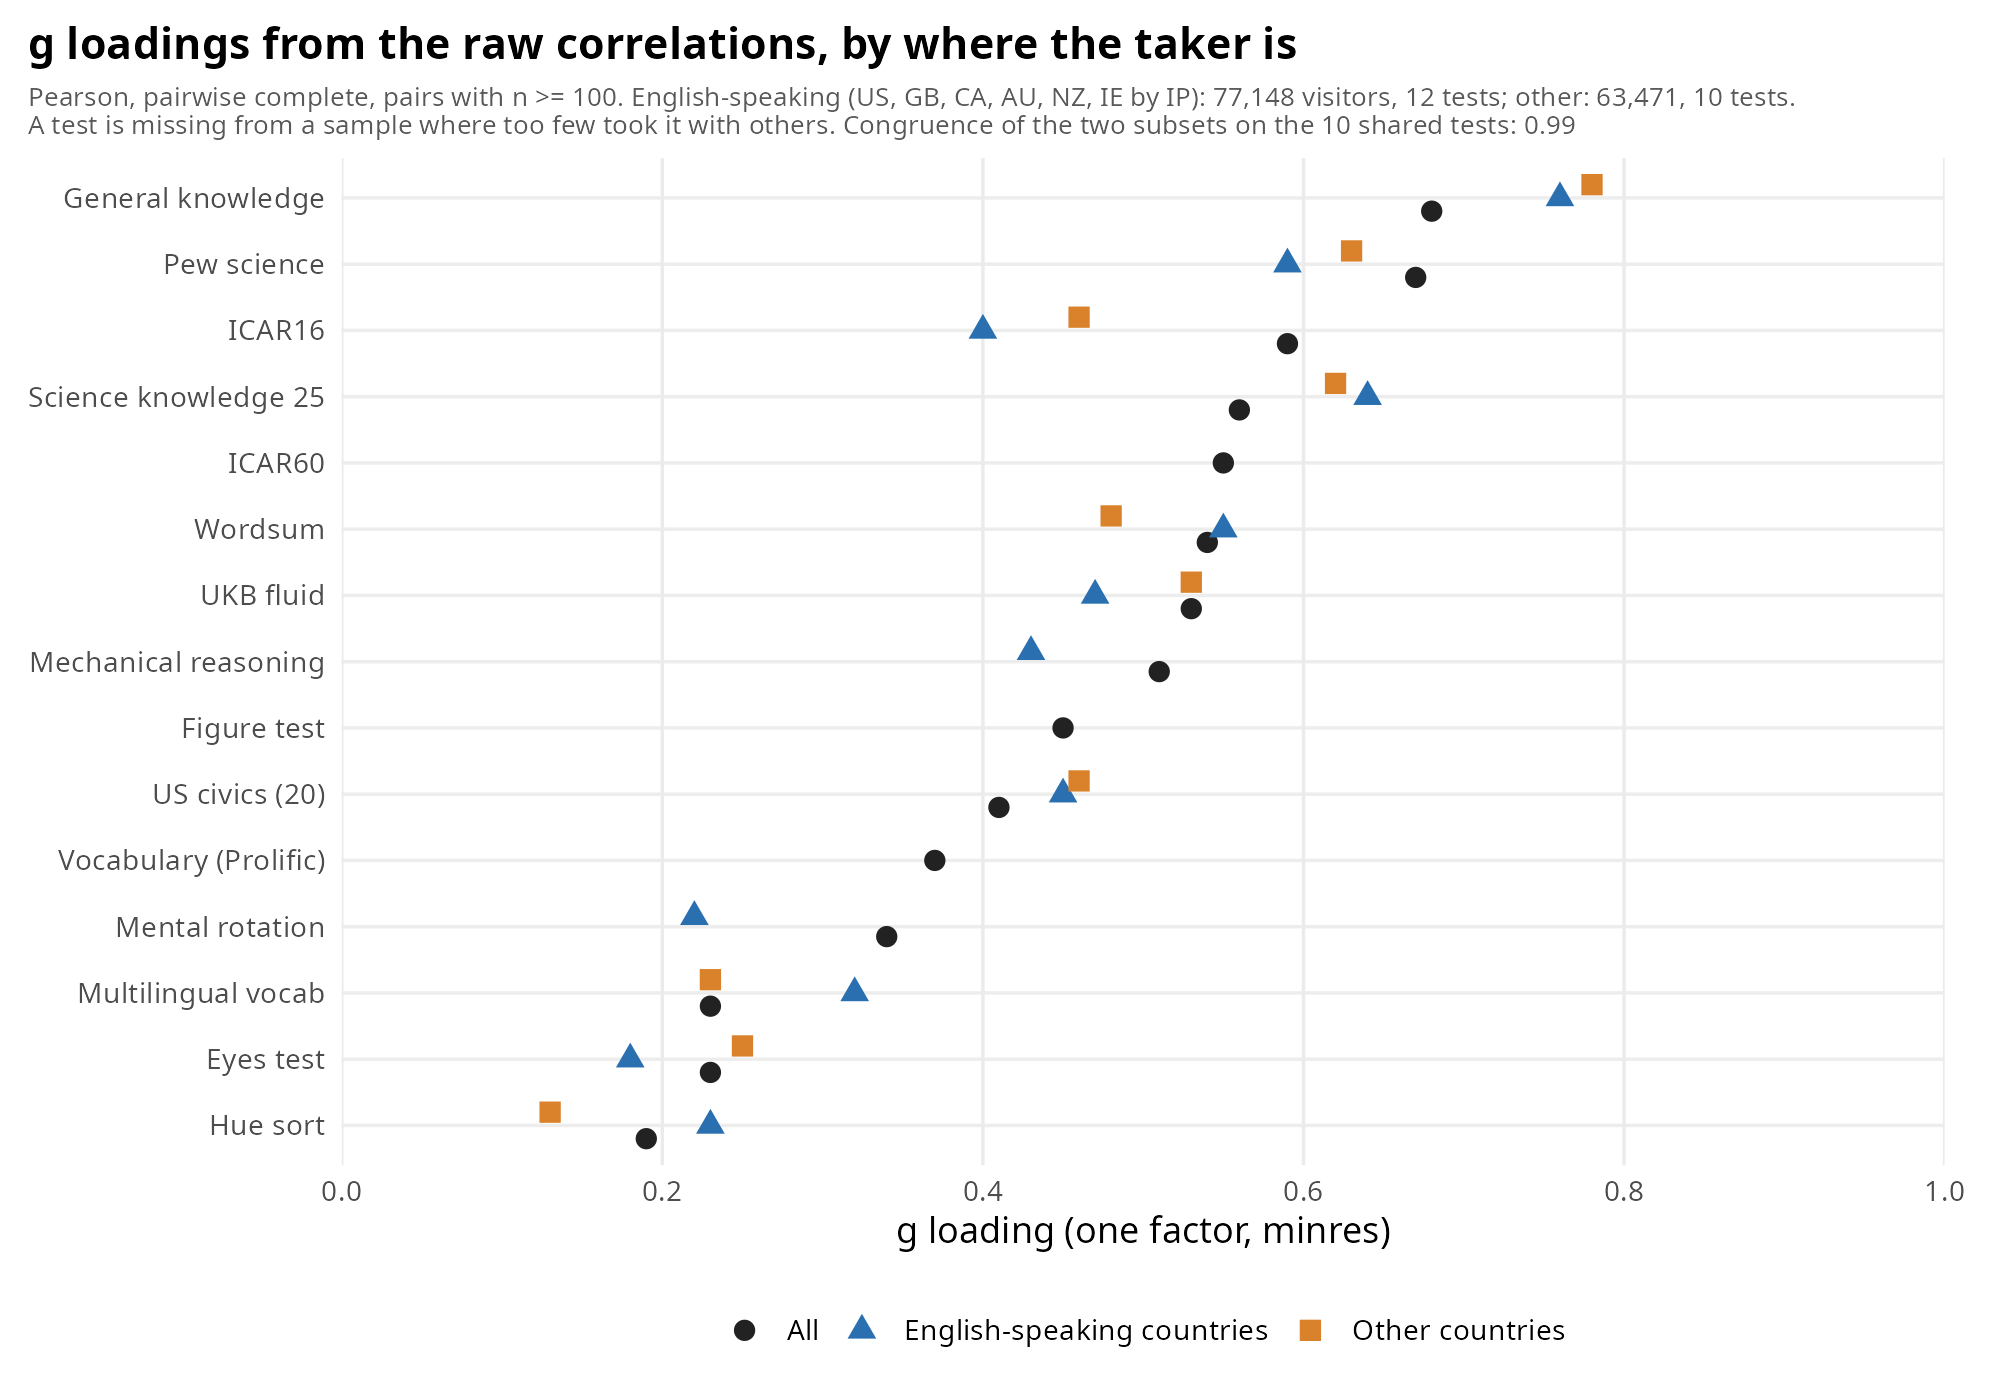
So they are somewhat different, but not terribly so. The traditional metric for similarity of loadings is factor congruence which is 0.99. The one oddity is ICAR16 in full data vs. subsets. The reason for that is that ICAR60 has too little data for the subsets, so it is excluded and this artificially changes the g-loading since ICAR16 is a subset of ICAR60. Ideally, one would not include partial duplicates, but we can’t be too picky here. So maybe we don’t need to do anything for the correlations. The means, however, are quite different:
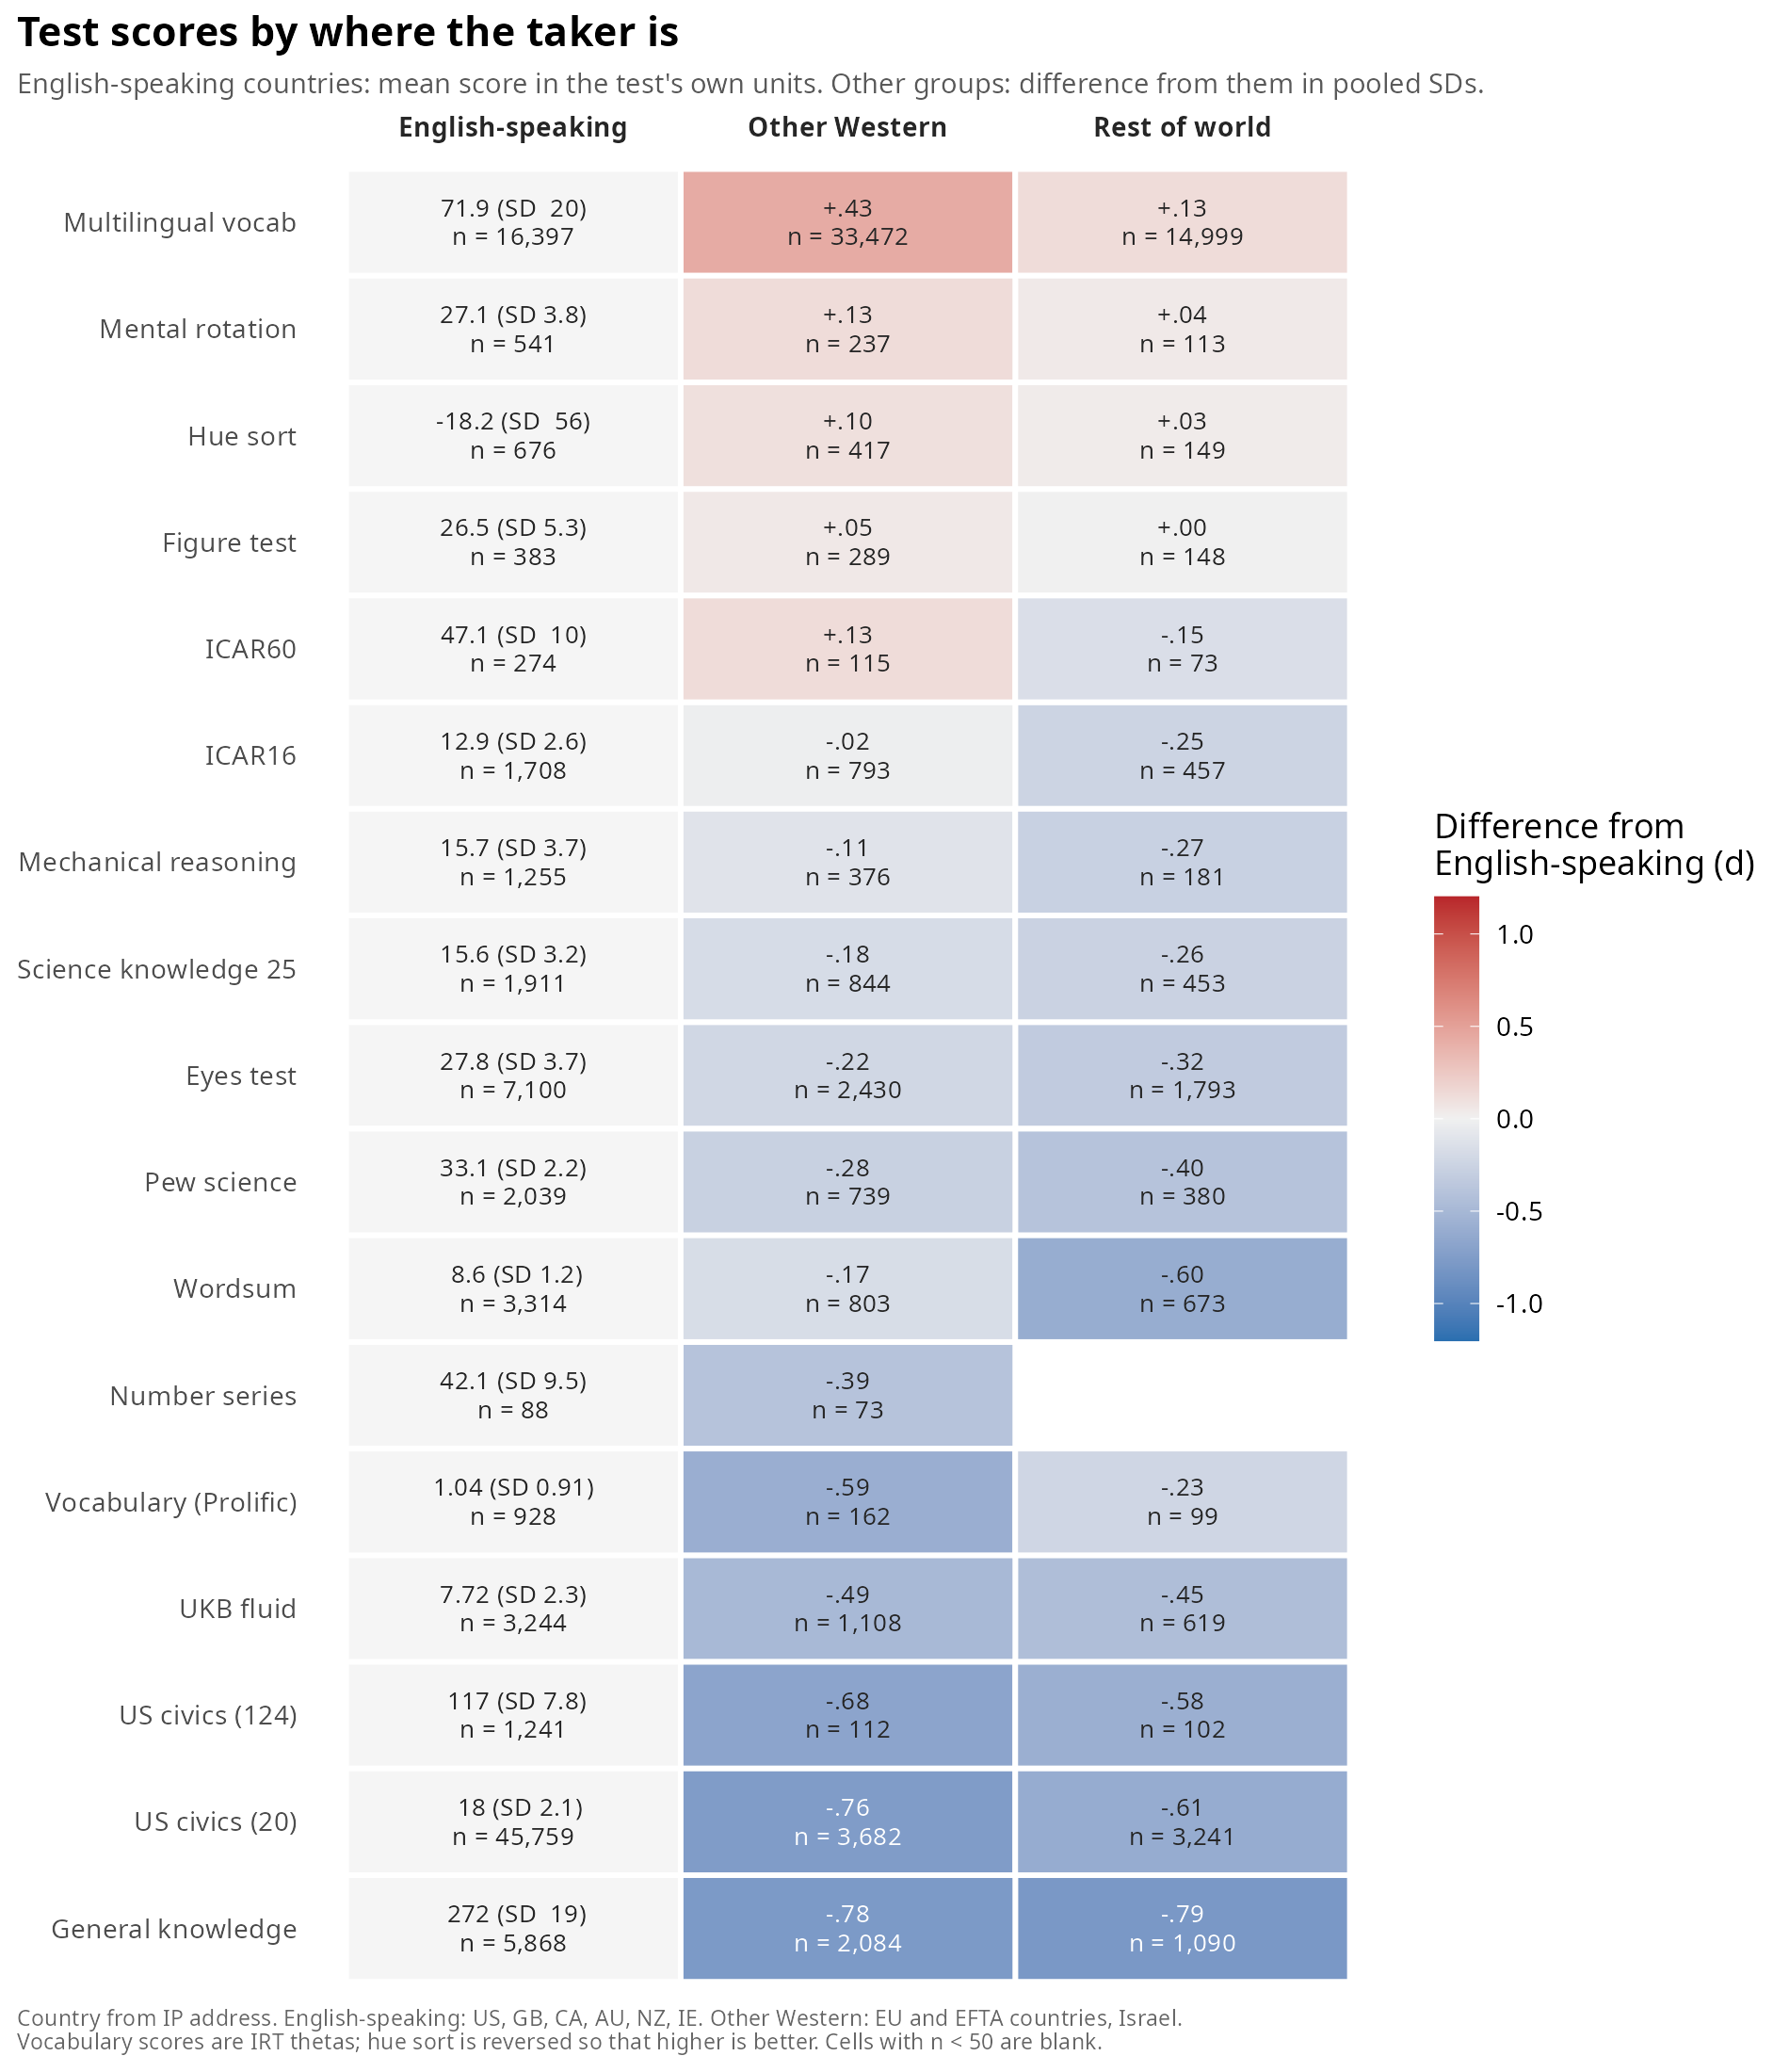
This is the familiar language and cultural bias, which is of course the largest on tests of such things, US knowledge tests. Curiously, the supposedly fluid intelligence test in UKBB shows a large bias. It’s a short time-limited test, so it indirectly measures English reading speed. The language-minimal tests (figures, ICAR, mental rotation) show quite small gaps as expected (except for number series, but it’s a tiny sample). We also get the expected finding that non-English speaking West knows more languages. This is also trivially true in the sense that English wasn’t one of the languages tested.
Regarding the pairwise complete correlations, they look like this:
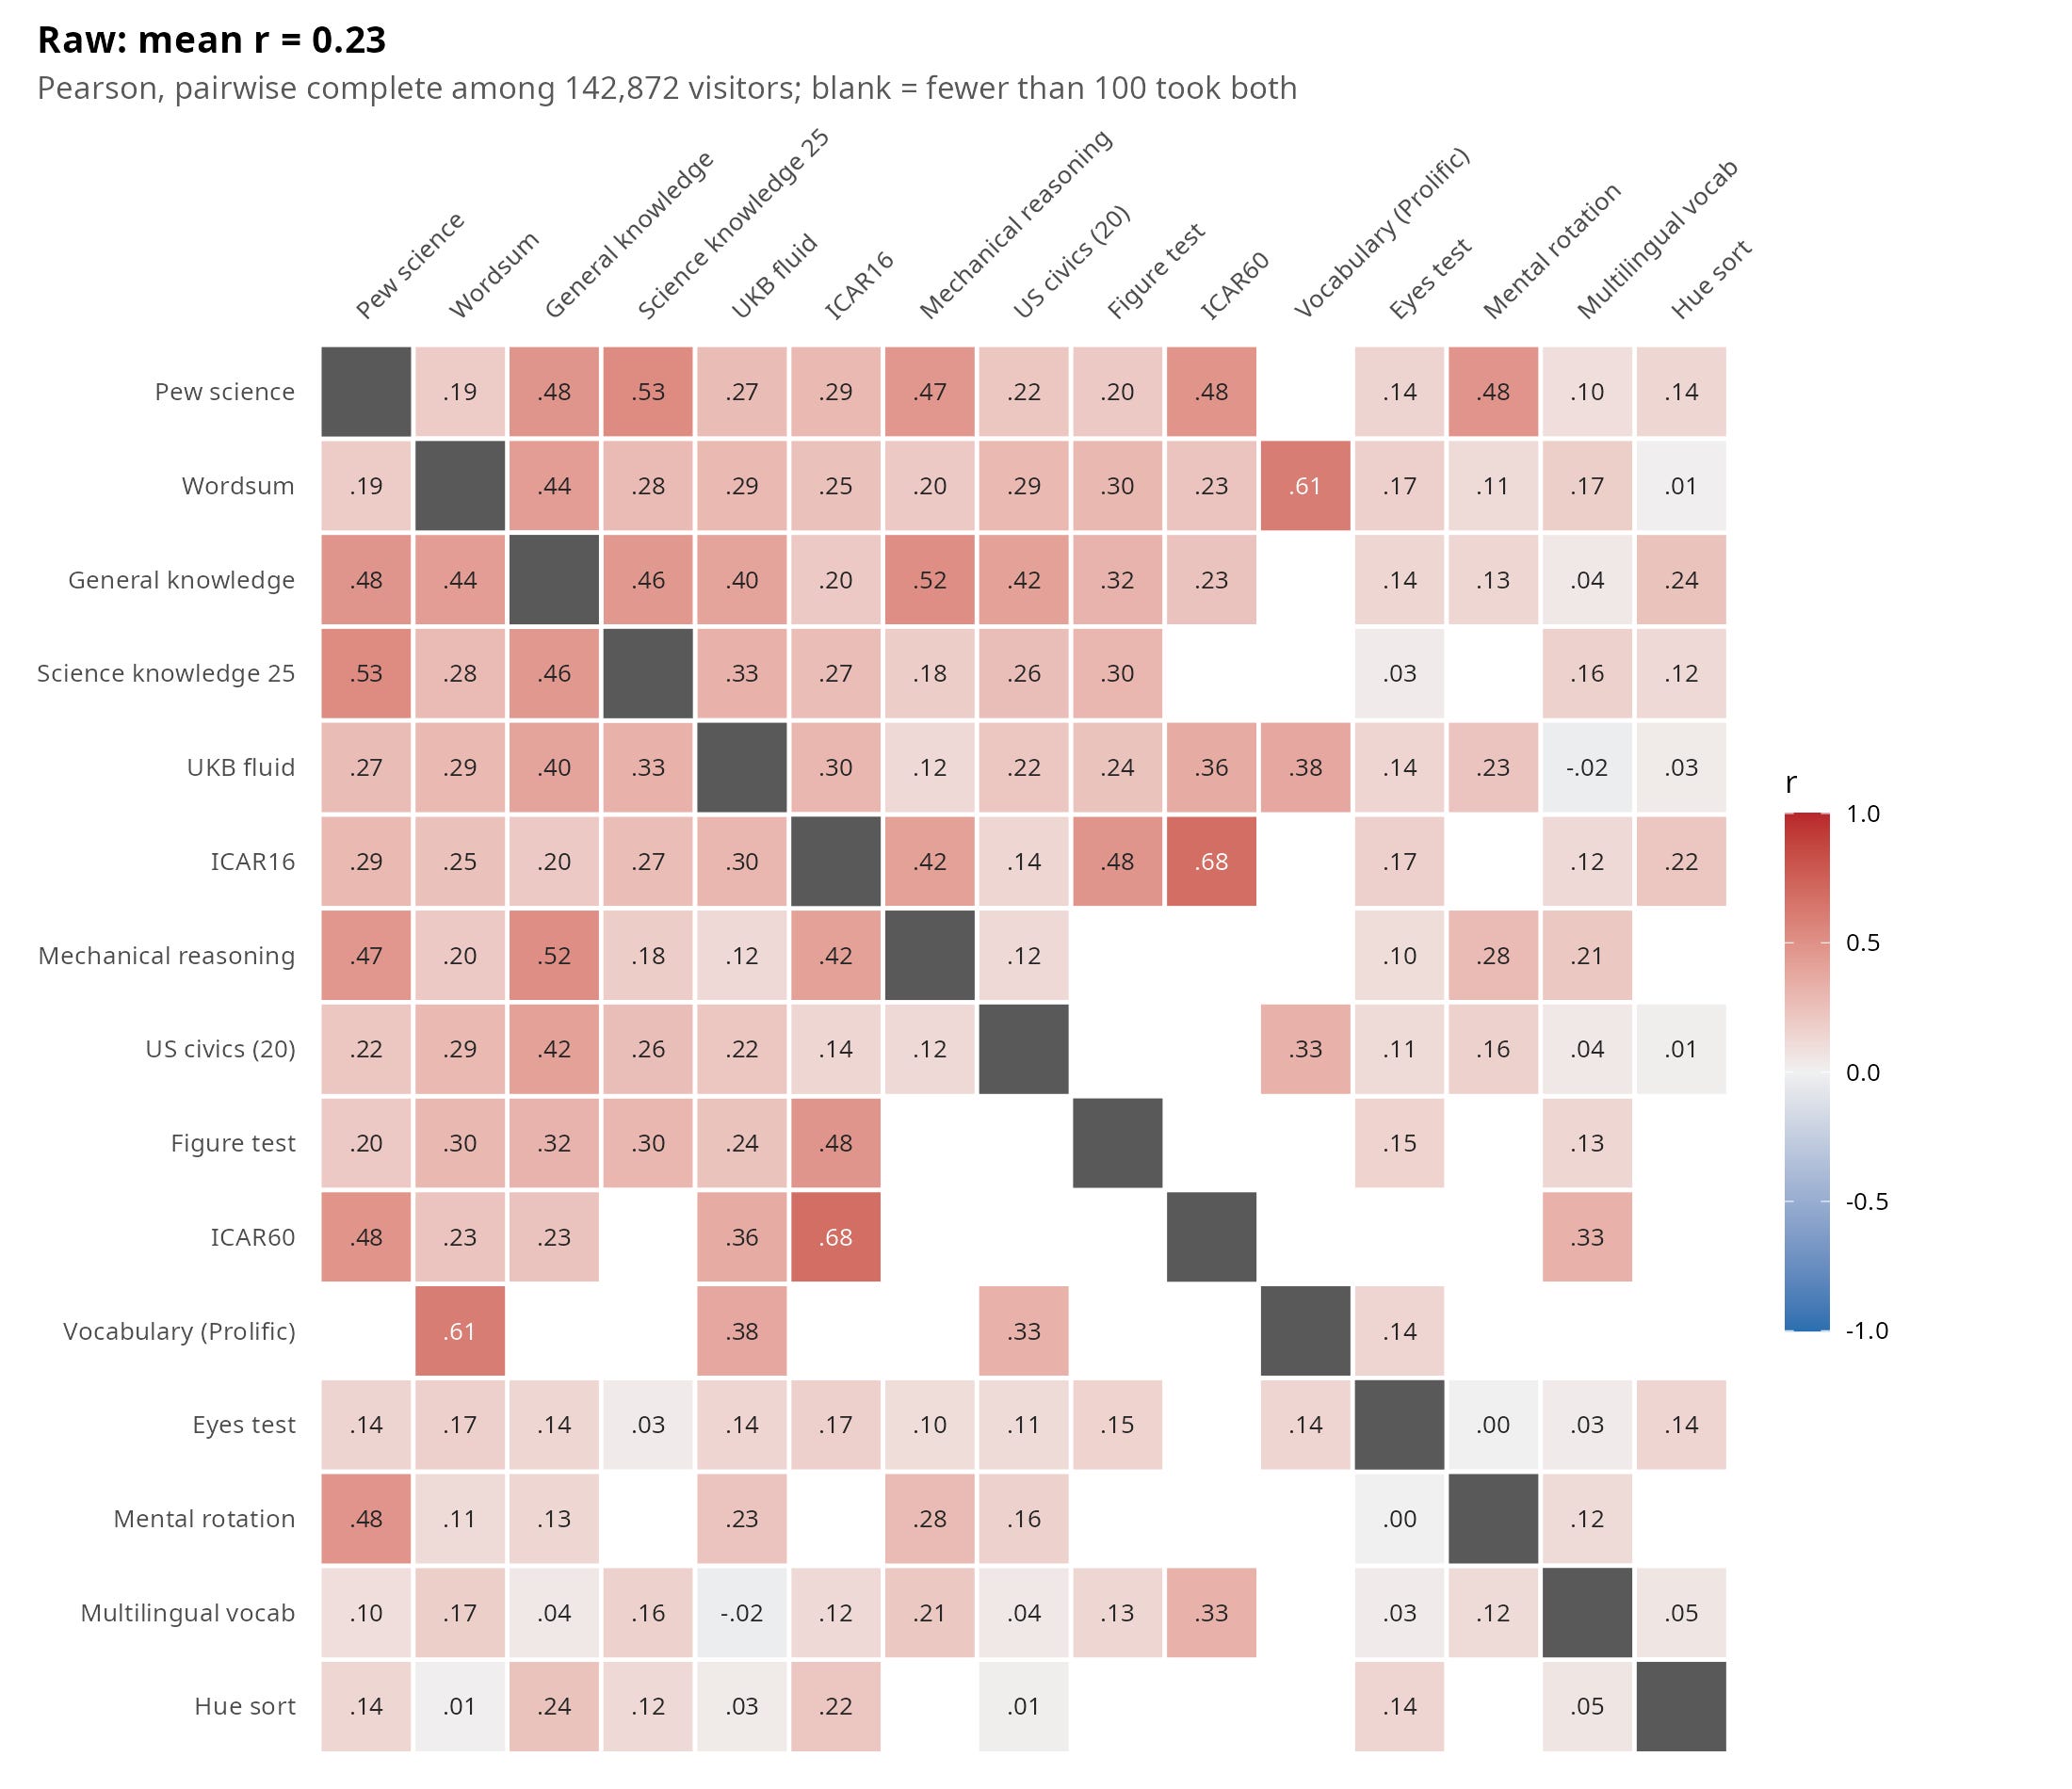
These are the values used to do the factor analysis to get the g-loadings above. There is a lot of holes in this matrix, which one can either impute, or drop that particular test. A choice has to be made about how much to impute versus drop. A matter of researcher taste to some extent. The long vocabulary test with Prolific norms only has 4 correlations observed so far (it was posted yesterday), and it would be unwise to make much of those, though it does have a 0.61 correlation with Wordsum.
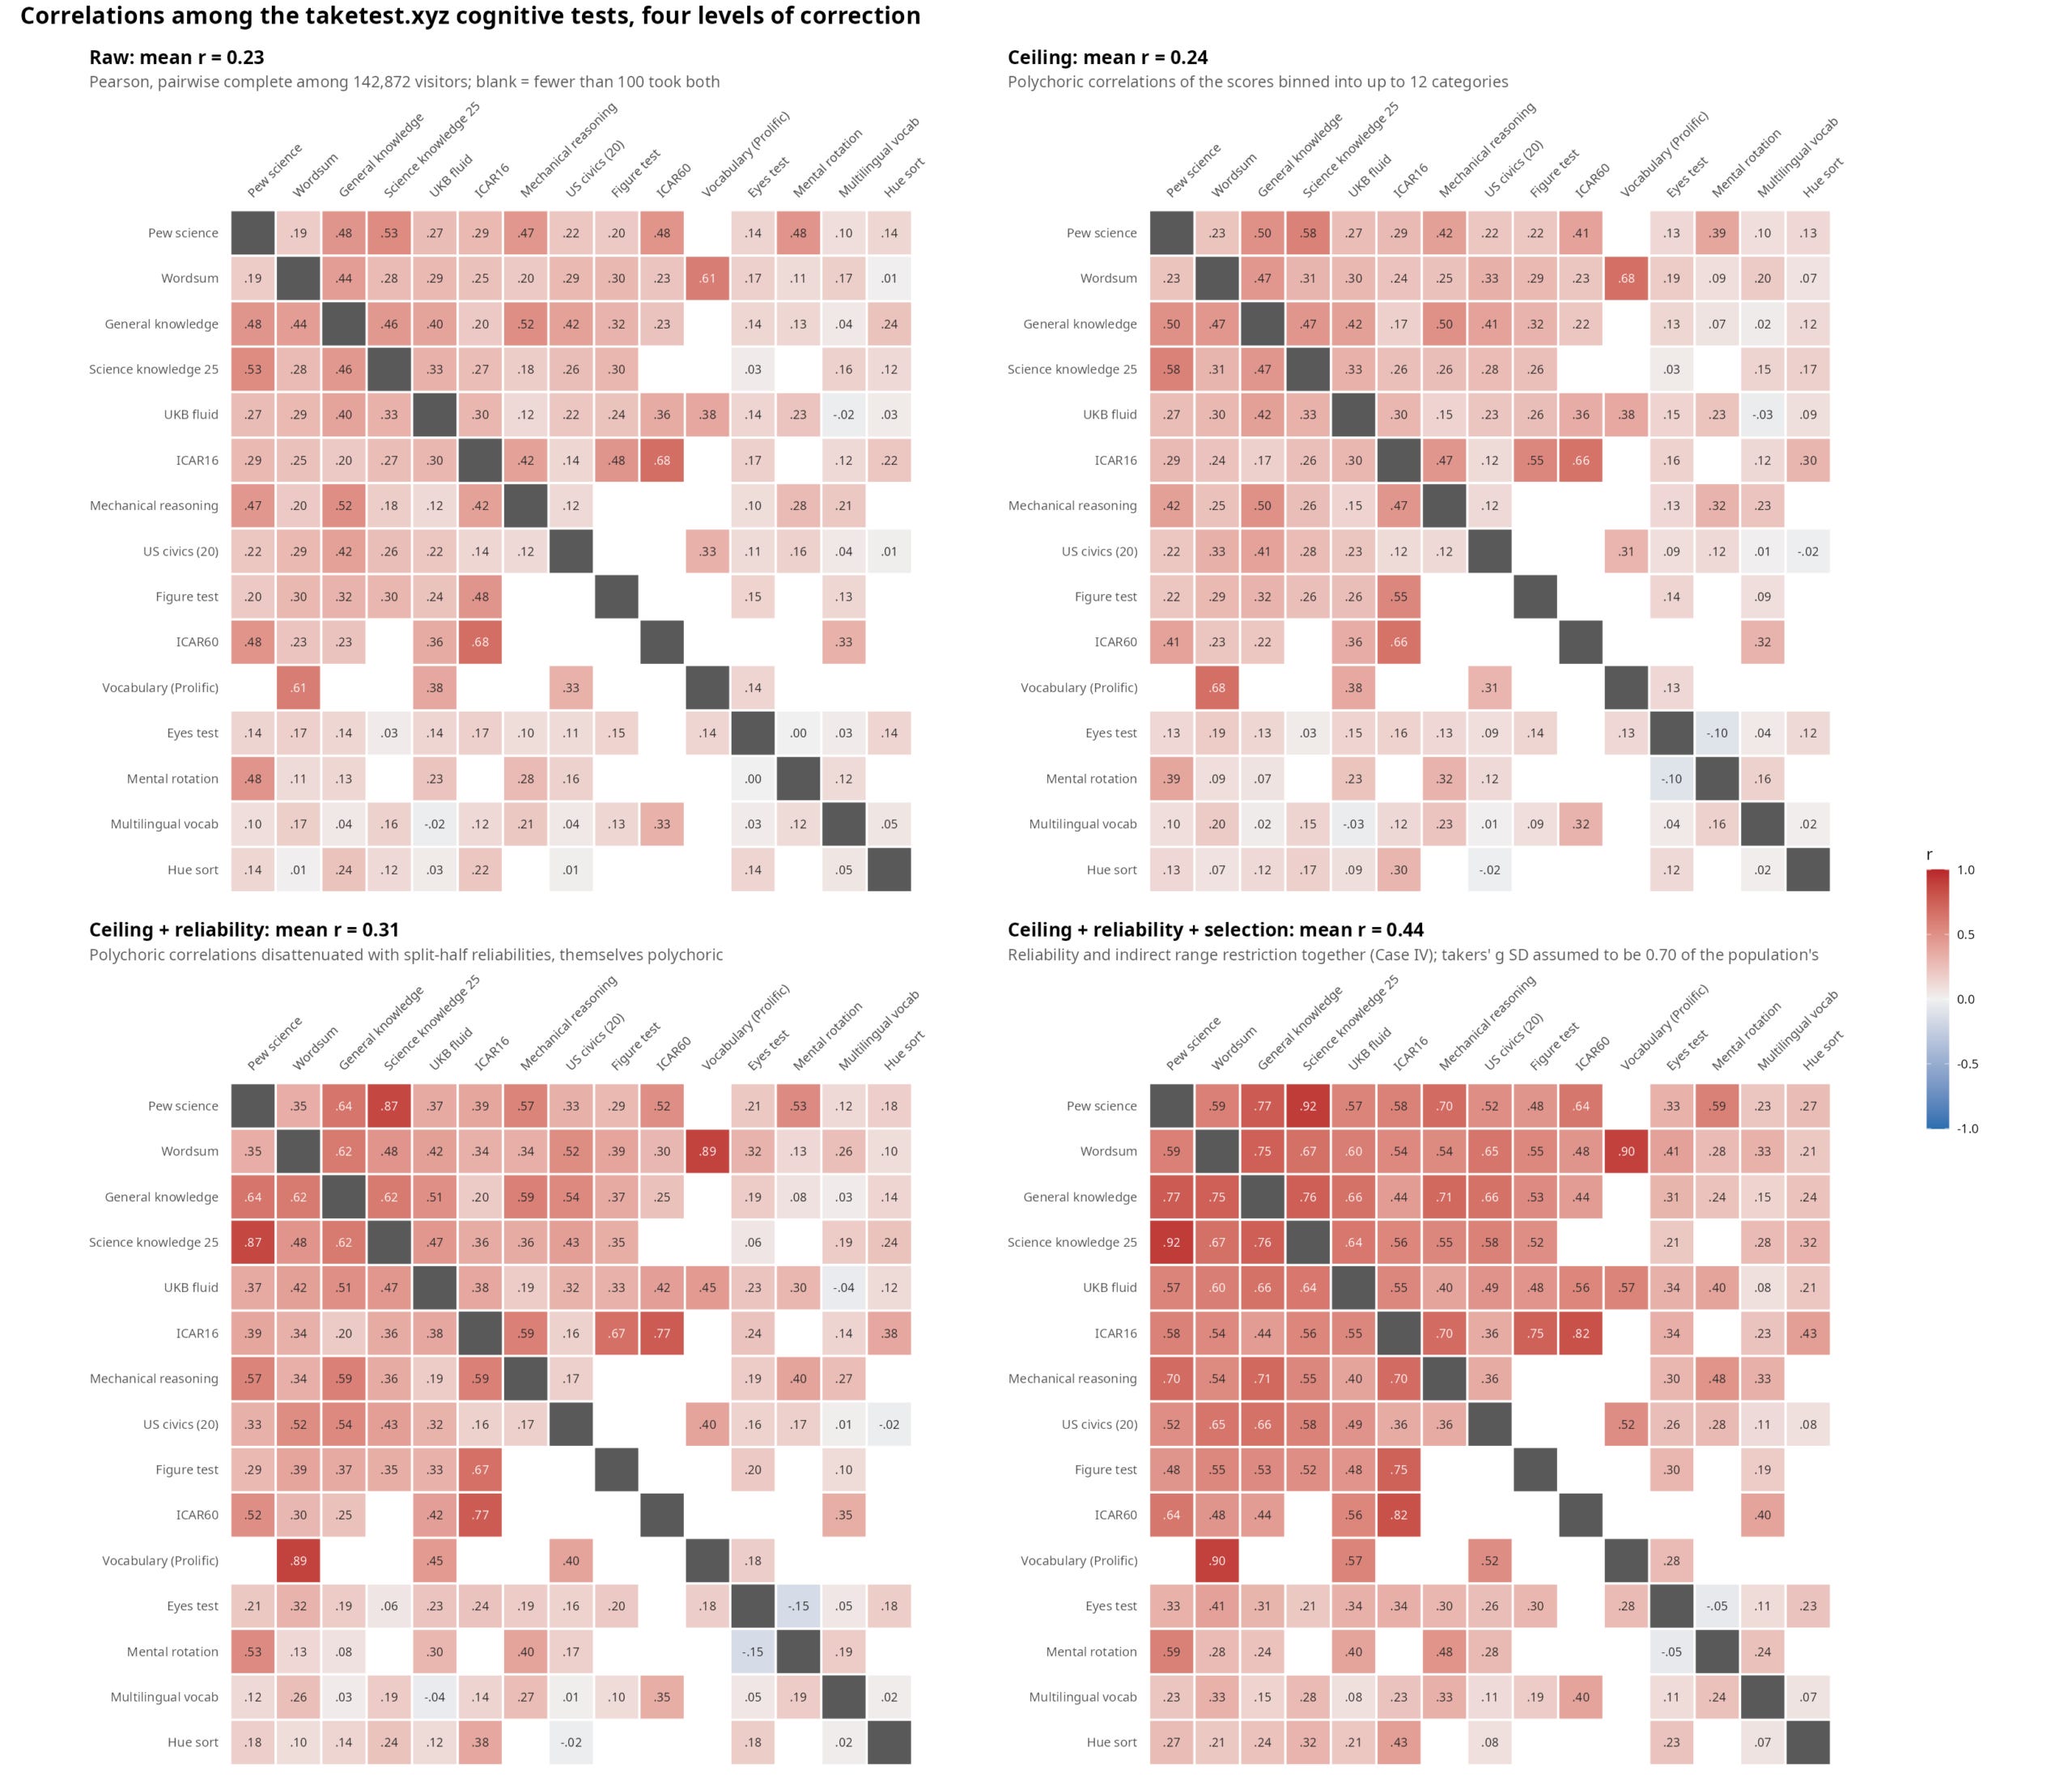
Hypothetically, the question we are asking is: in a dream world where all the tests are infinitely long and thus perfectly reliable (in classical test theory sense), and where all the test subjects are perfectly representative in terms of intelligence, and where every test has infinite range, what are the correlations among the tests? These are the values we need to get the true g-loadings. So since we have issues, we have to correct. Ceiling effects have a variety of existing solutions. Just for reference, this is what our Wordsum vs. American general population data look like:
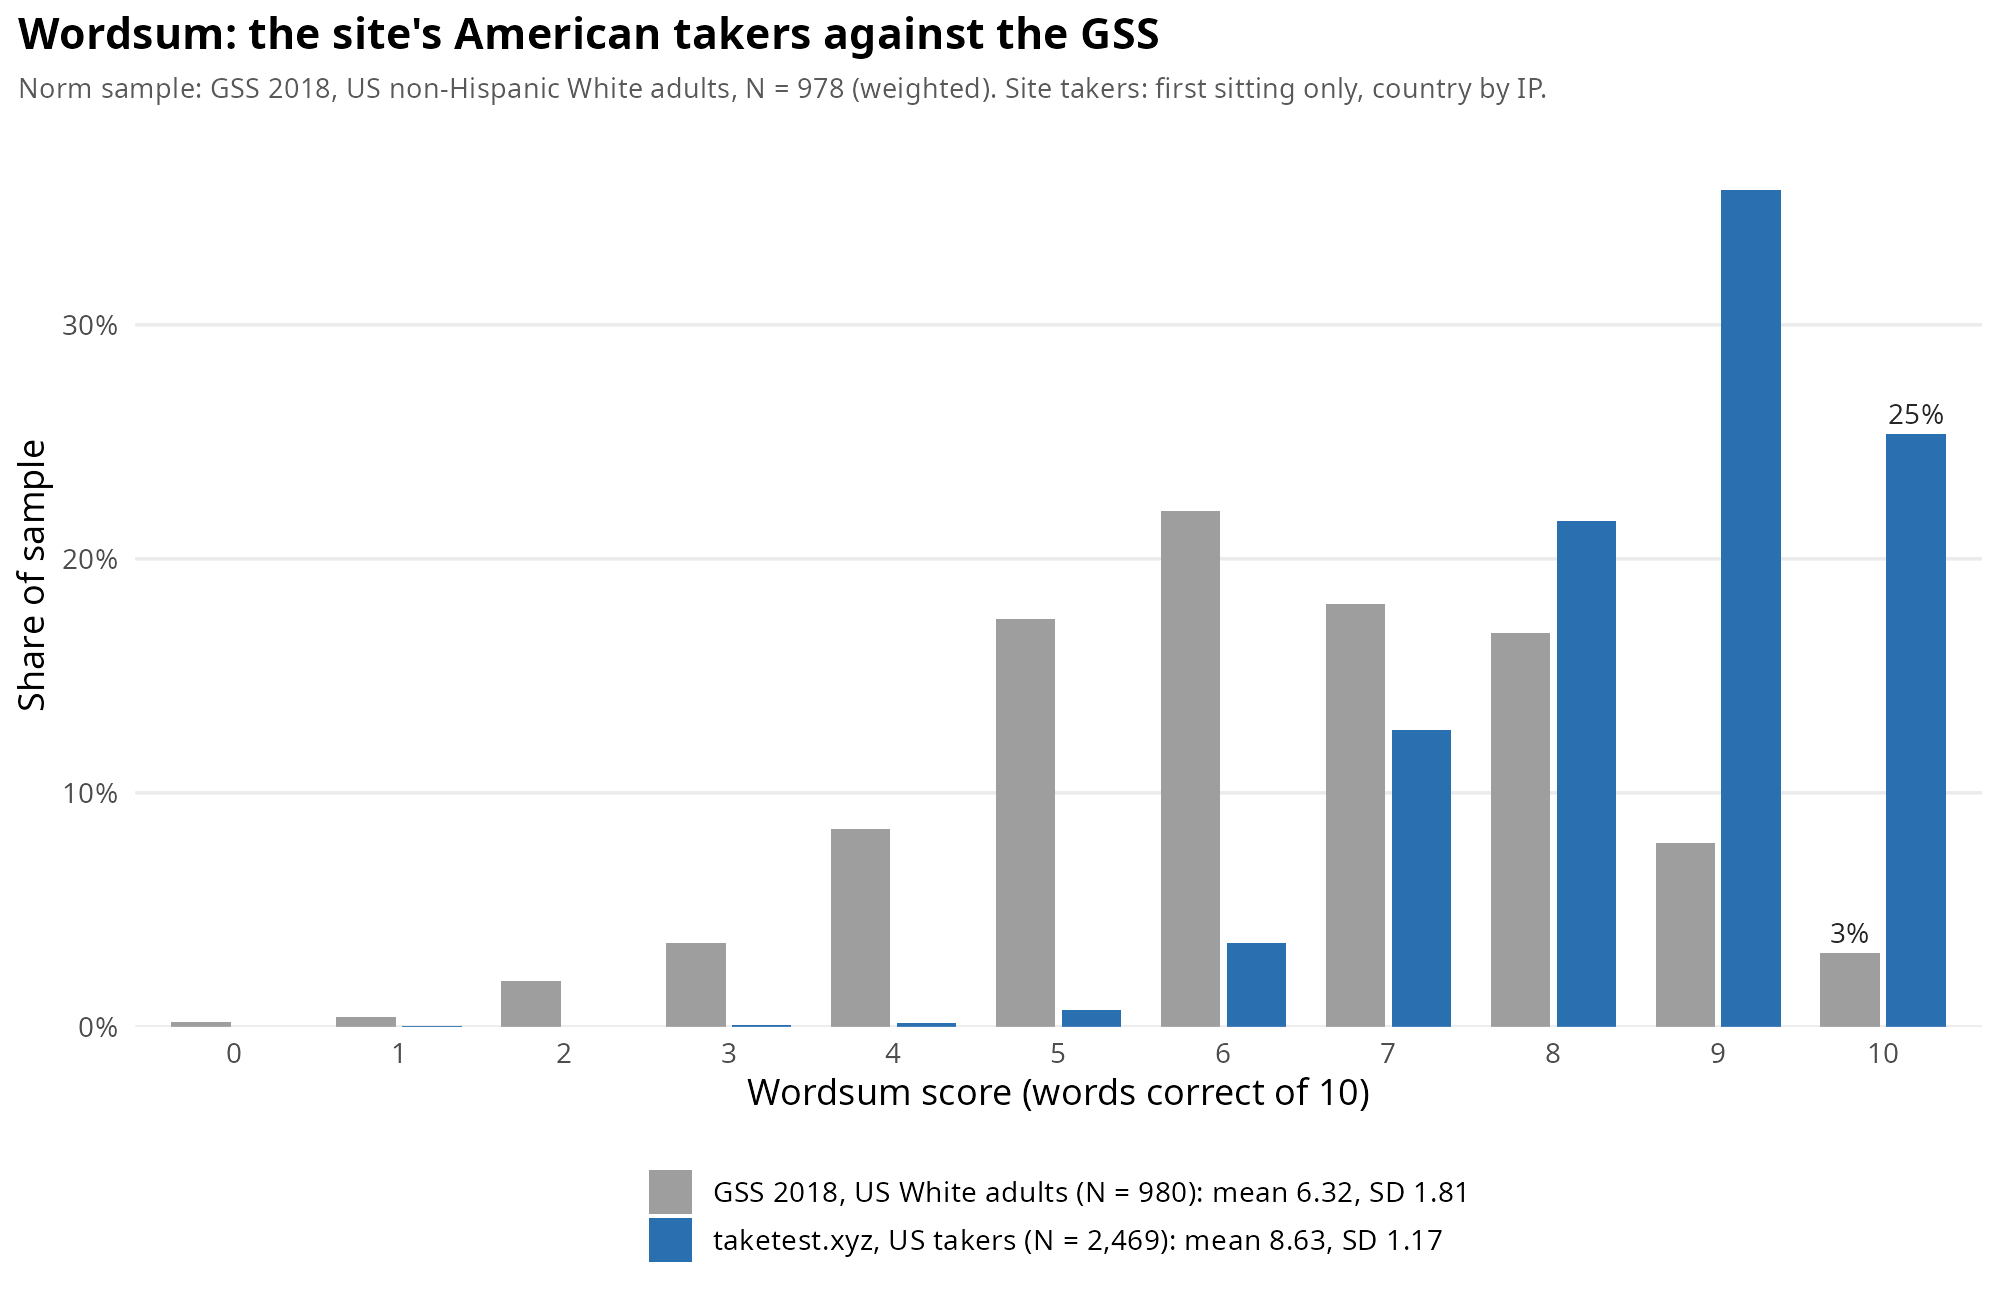
25% of our online subjects got a perfect score versus 3% in the US White general population. It is easy to imagine how the correlation must decrease the bigger the lumping of scores at one end, since people of dissimilar ability are obtain the same numerical score. One simple solution I like is to bin the values and use the latent correlation from ordinal-ordinal or ordinal-continuous functions (polychoric/polyserial correlation). This can also be used to infer the split-half reliability estimate without bias from the ceiling, though it is still biased from the selection. Thus, to obtain an estimate of our hypothetically perfect correlation matrix we do these steps:
Ceiling bias correction via binning + polychoric.
Reliability correction (using value from split-half polychoric).
Selection correction
The latter is problematic to estimate. The value the statistical correction needs is the SD in our sample vs. population. However, the SD is affected by ceiling bias, which results in a far too small SD. This would mean the correction is too strong and correlations too high. Unfortunately, the only tests we have with truly representative samples for are the Wordsum and the Pew Research science, both which have severe ceiling issues for our subjects. We have data from the SAPA project for ICAR. The 16-item version is also affected by ceiling bias (15% in our data vs. 2% in SAPA’s). The people who took the time to take the full 60 item version are even more selected. I tried a variety of methods and they produced selection ratios of 0.50 to even above 1. I don’t know what the selection ratio really is, but I’ve used 0.70 in my calculations until we can find something better. This is what we get:
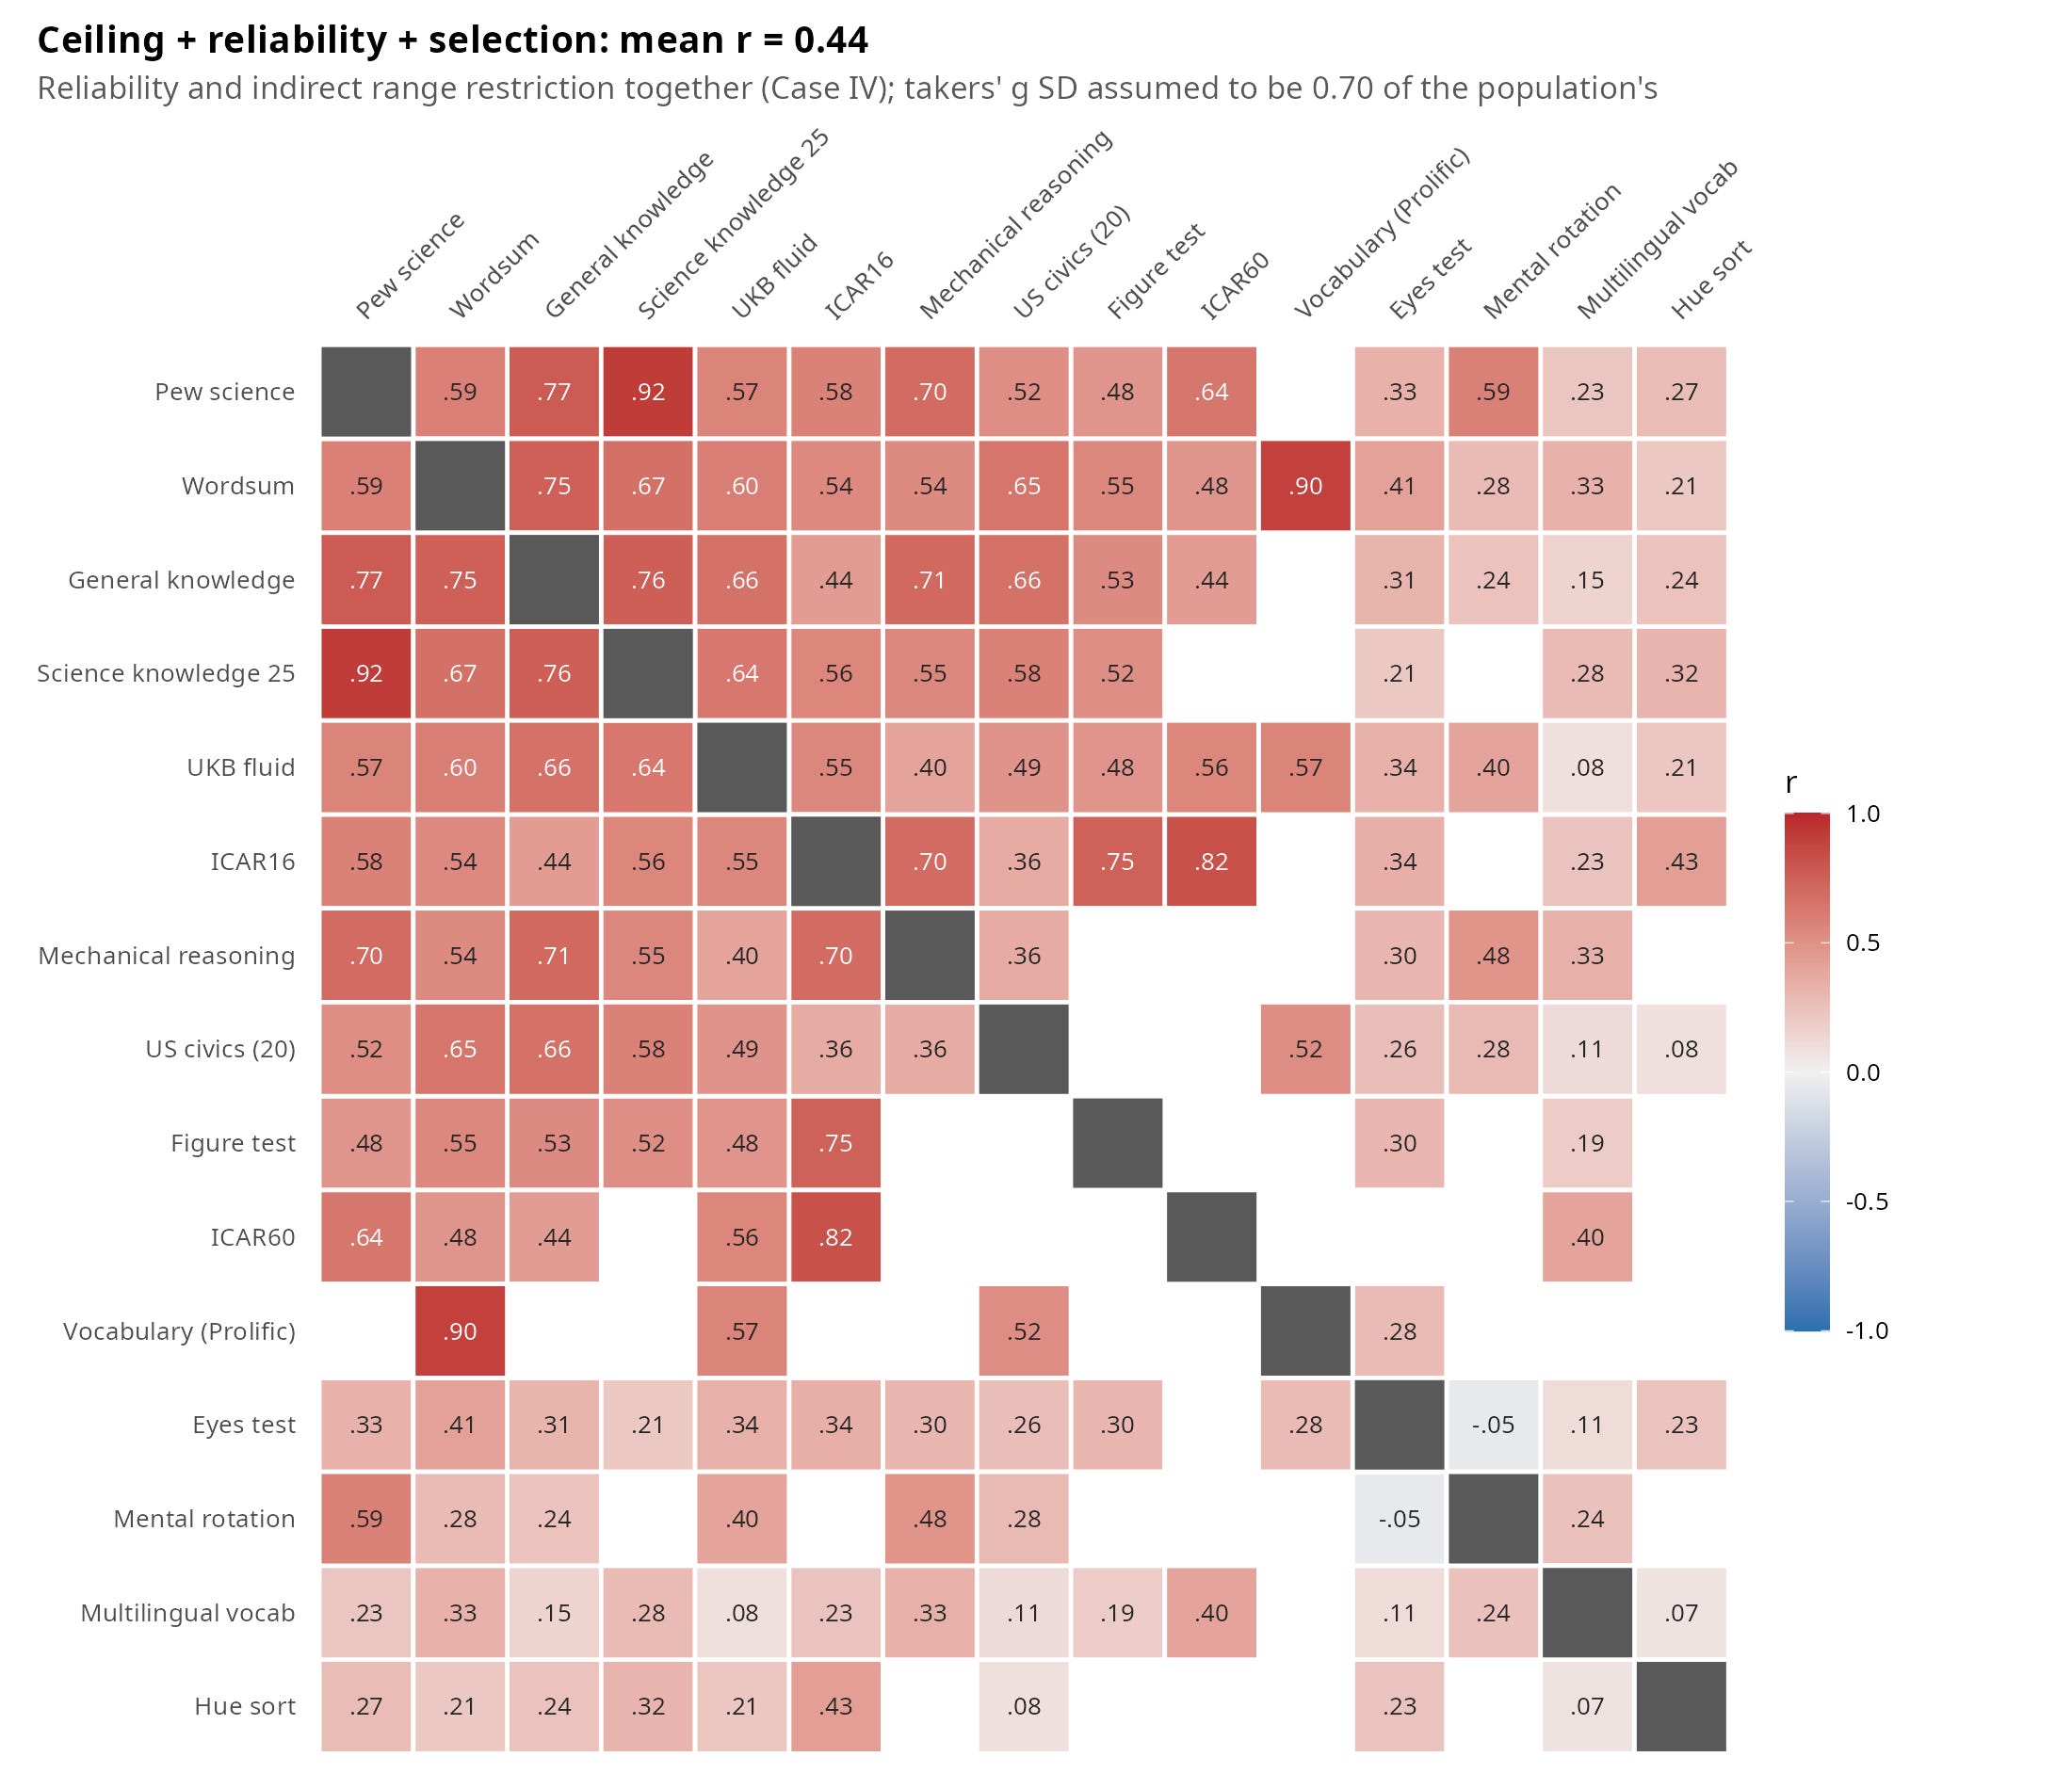
We have a number of too weak correlations, but that is in part because the raw correlations were close to 0 by sampling error. Corrections cannot fix this issue, only more data can. In any case, every correlation except for one (-0.05) is positive despite the sampling error. So finally, we get the answer for g-loadings we wanted:
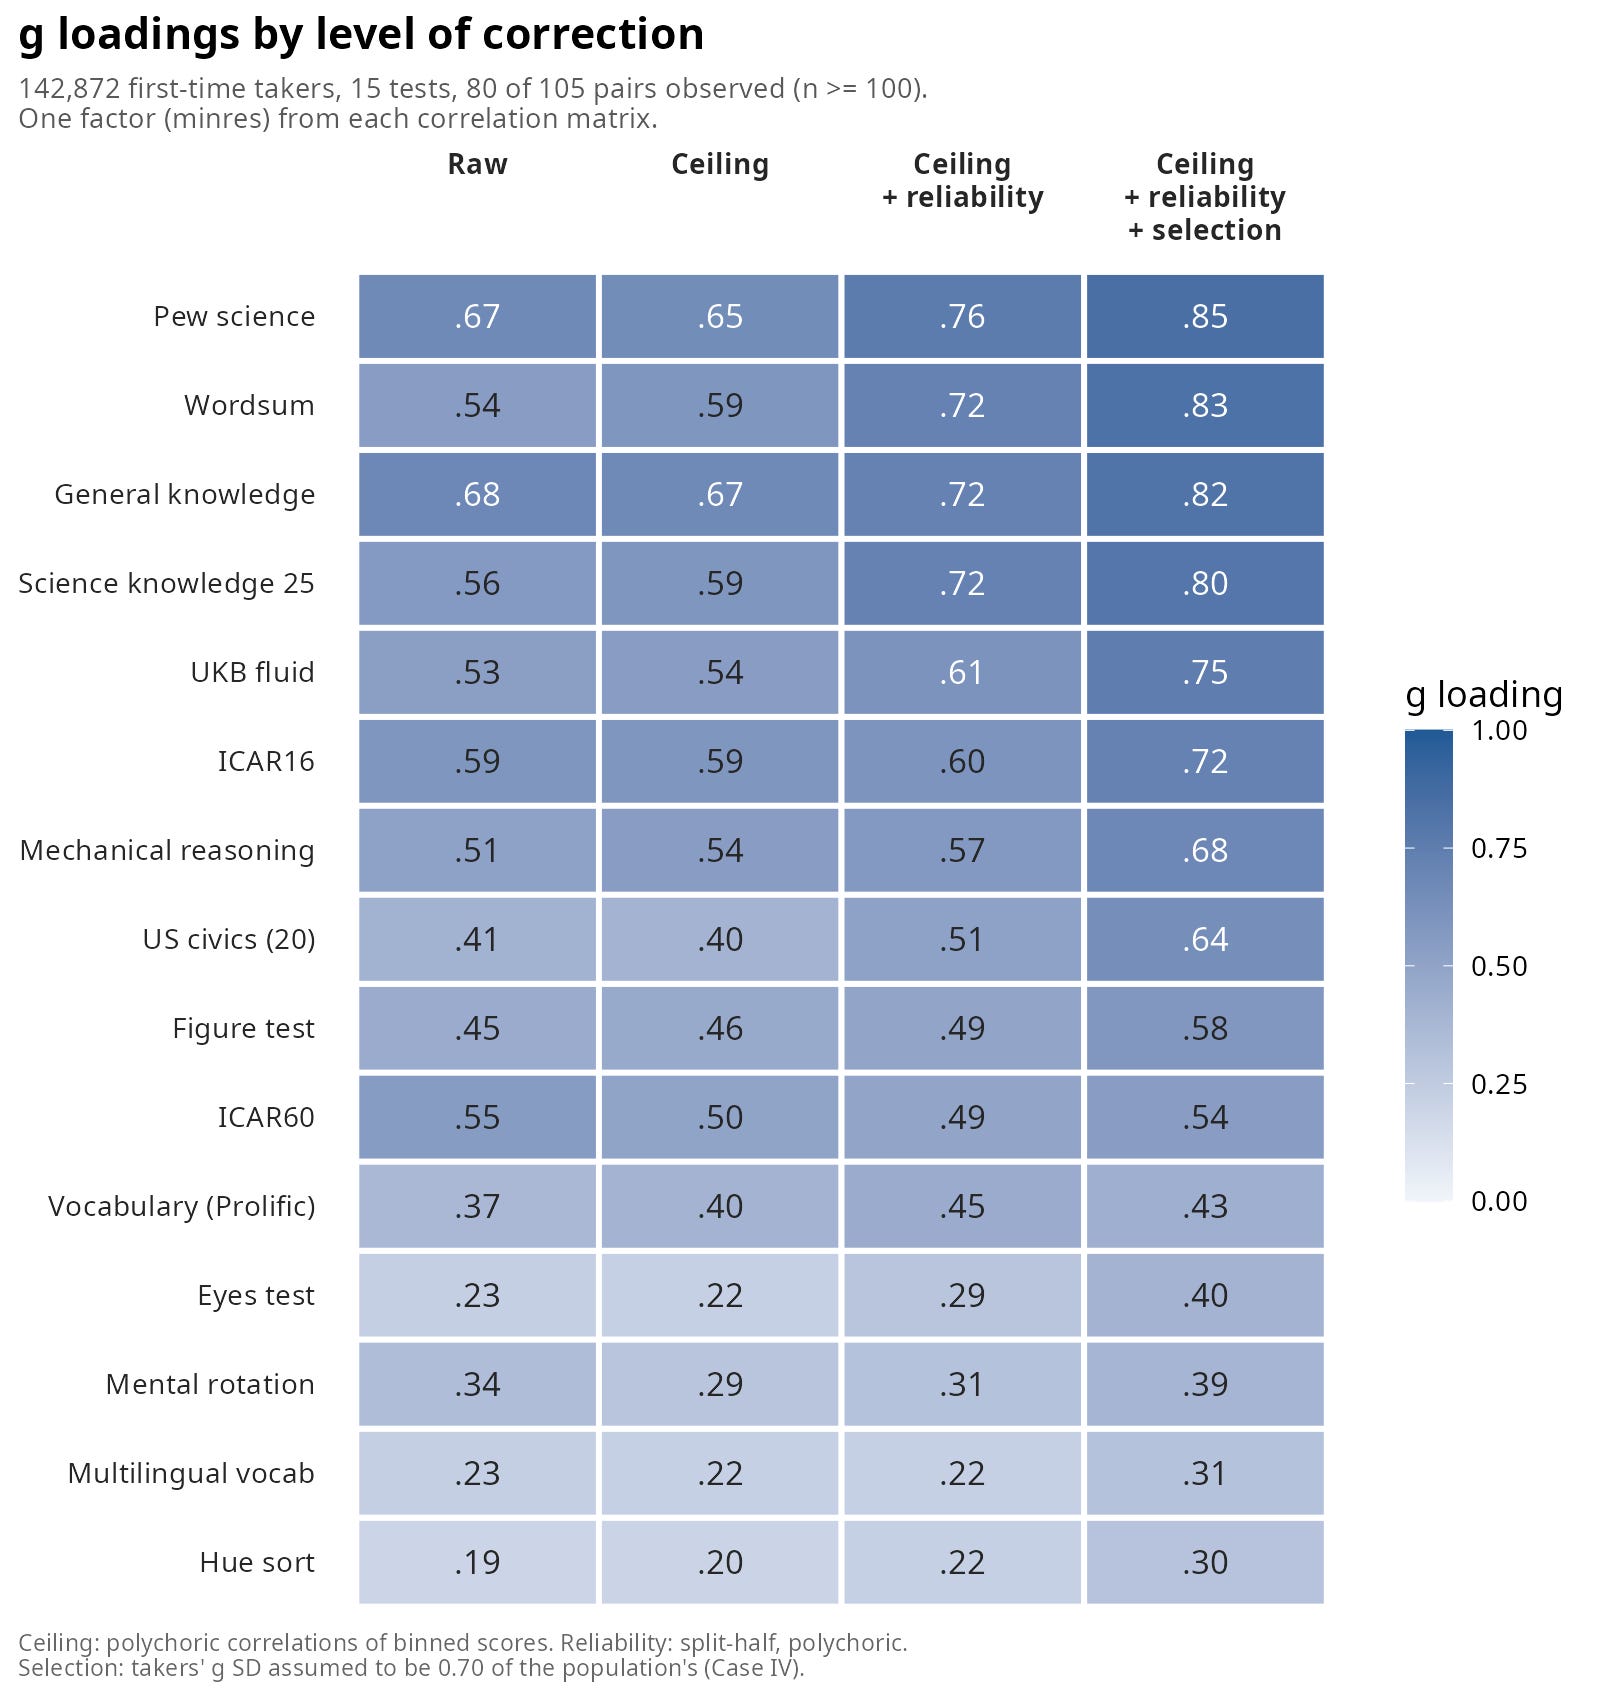
Well, sort of. Some of the values are clearly wrong. ICAR60 is a long 4-part test, the true g-loading will surely be 0.90 or so, yet we found 0.54. Treat the above as minimum values more than unbiased estimates. These estimates are based on very thin overlaps due to small samples. As more data come in, we will be able to update these values. The most g-loaded tests are the usual quick knowledge tests. This is annoying because these are the most culturally sensitive, but on the other hand, they are fast and unstressful. This collection of tests also has too many knowledge tests, so the g factor will be somewhat colored, boosting their values slightly. As we accumulate more non-verbal tests, we will be able to fit more complex models to account for this as is typically done. We should then eventually recover the usual finding that fluid ability is the same thing as g on a theoretical level, though not using our observed scores.
Extras
The evolution of the correlation matrix for those curious: