
Government family spending does not predict fertility rates, or does it
Maybe tax breaks are magic, or maybe not

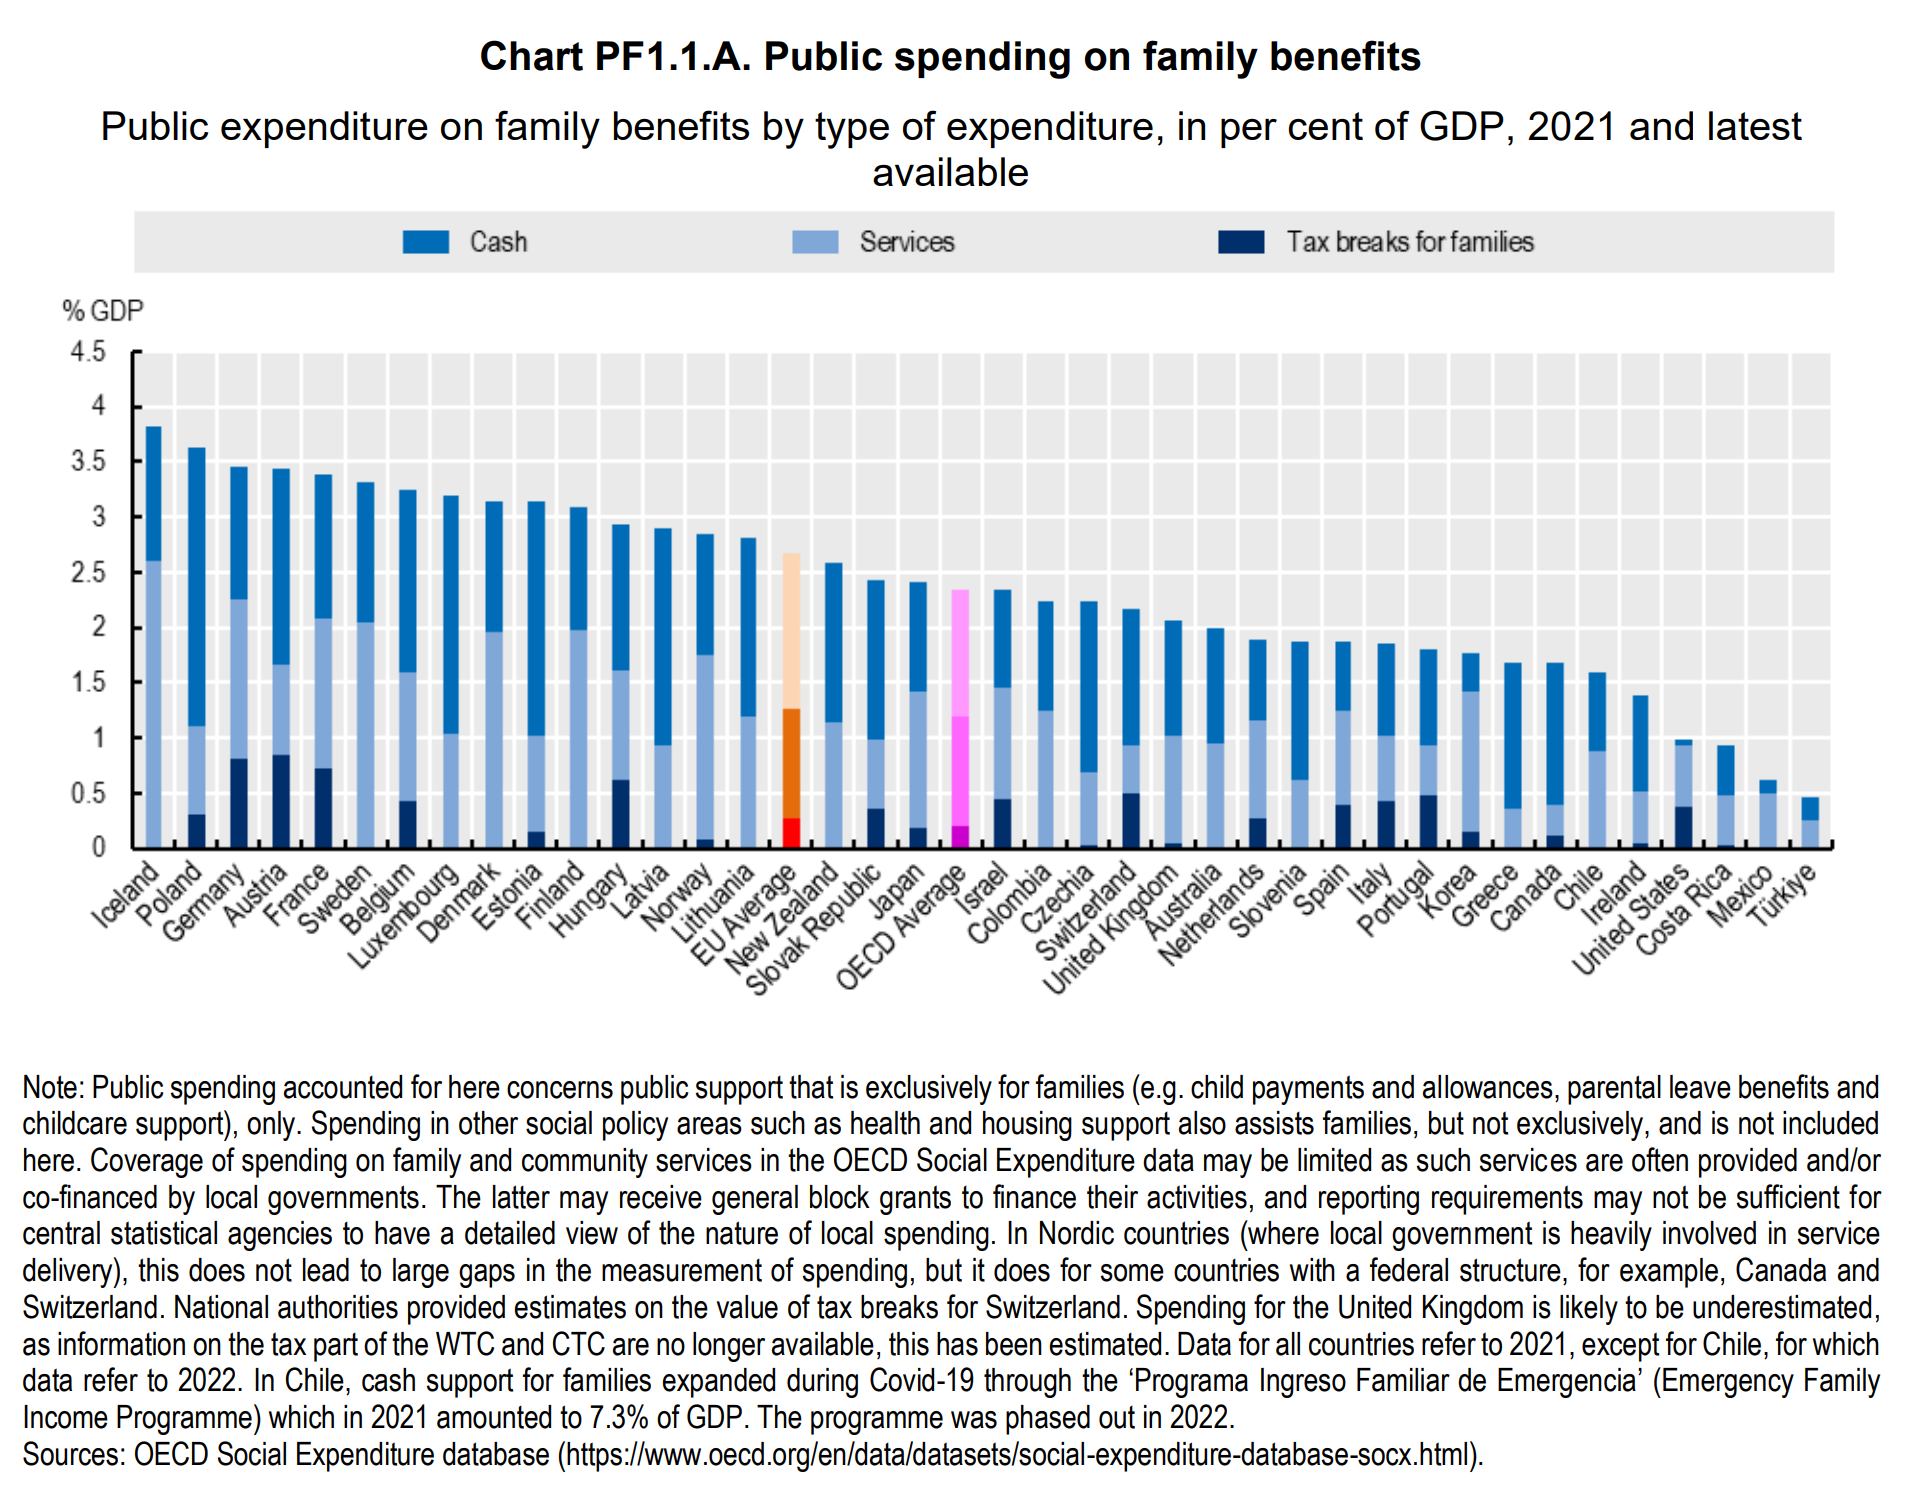
Fertility rates are terrible in every good country except for Israel. Why is that? Well, maybe we just don’t spend enough money on this. Maybe it is too expensive to make a family. If you like economics, your first idea is that to get more of something, you should remove regulations, and your second idea is to subsidize it. Fortunately, countries differ in how much they do this. OECD provides data on this for OECD+ countries:
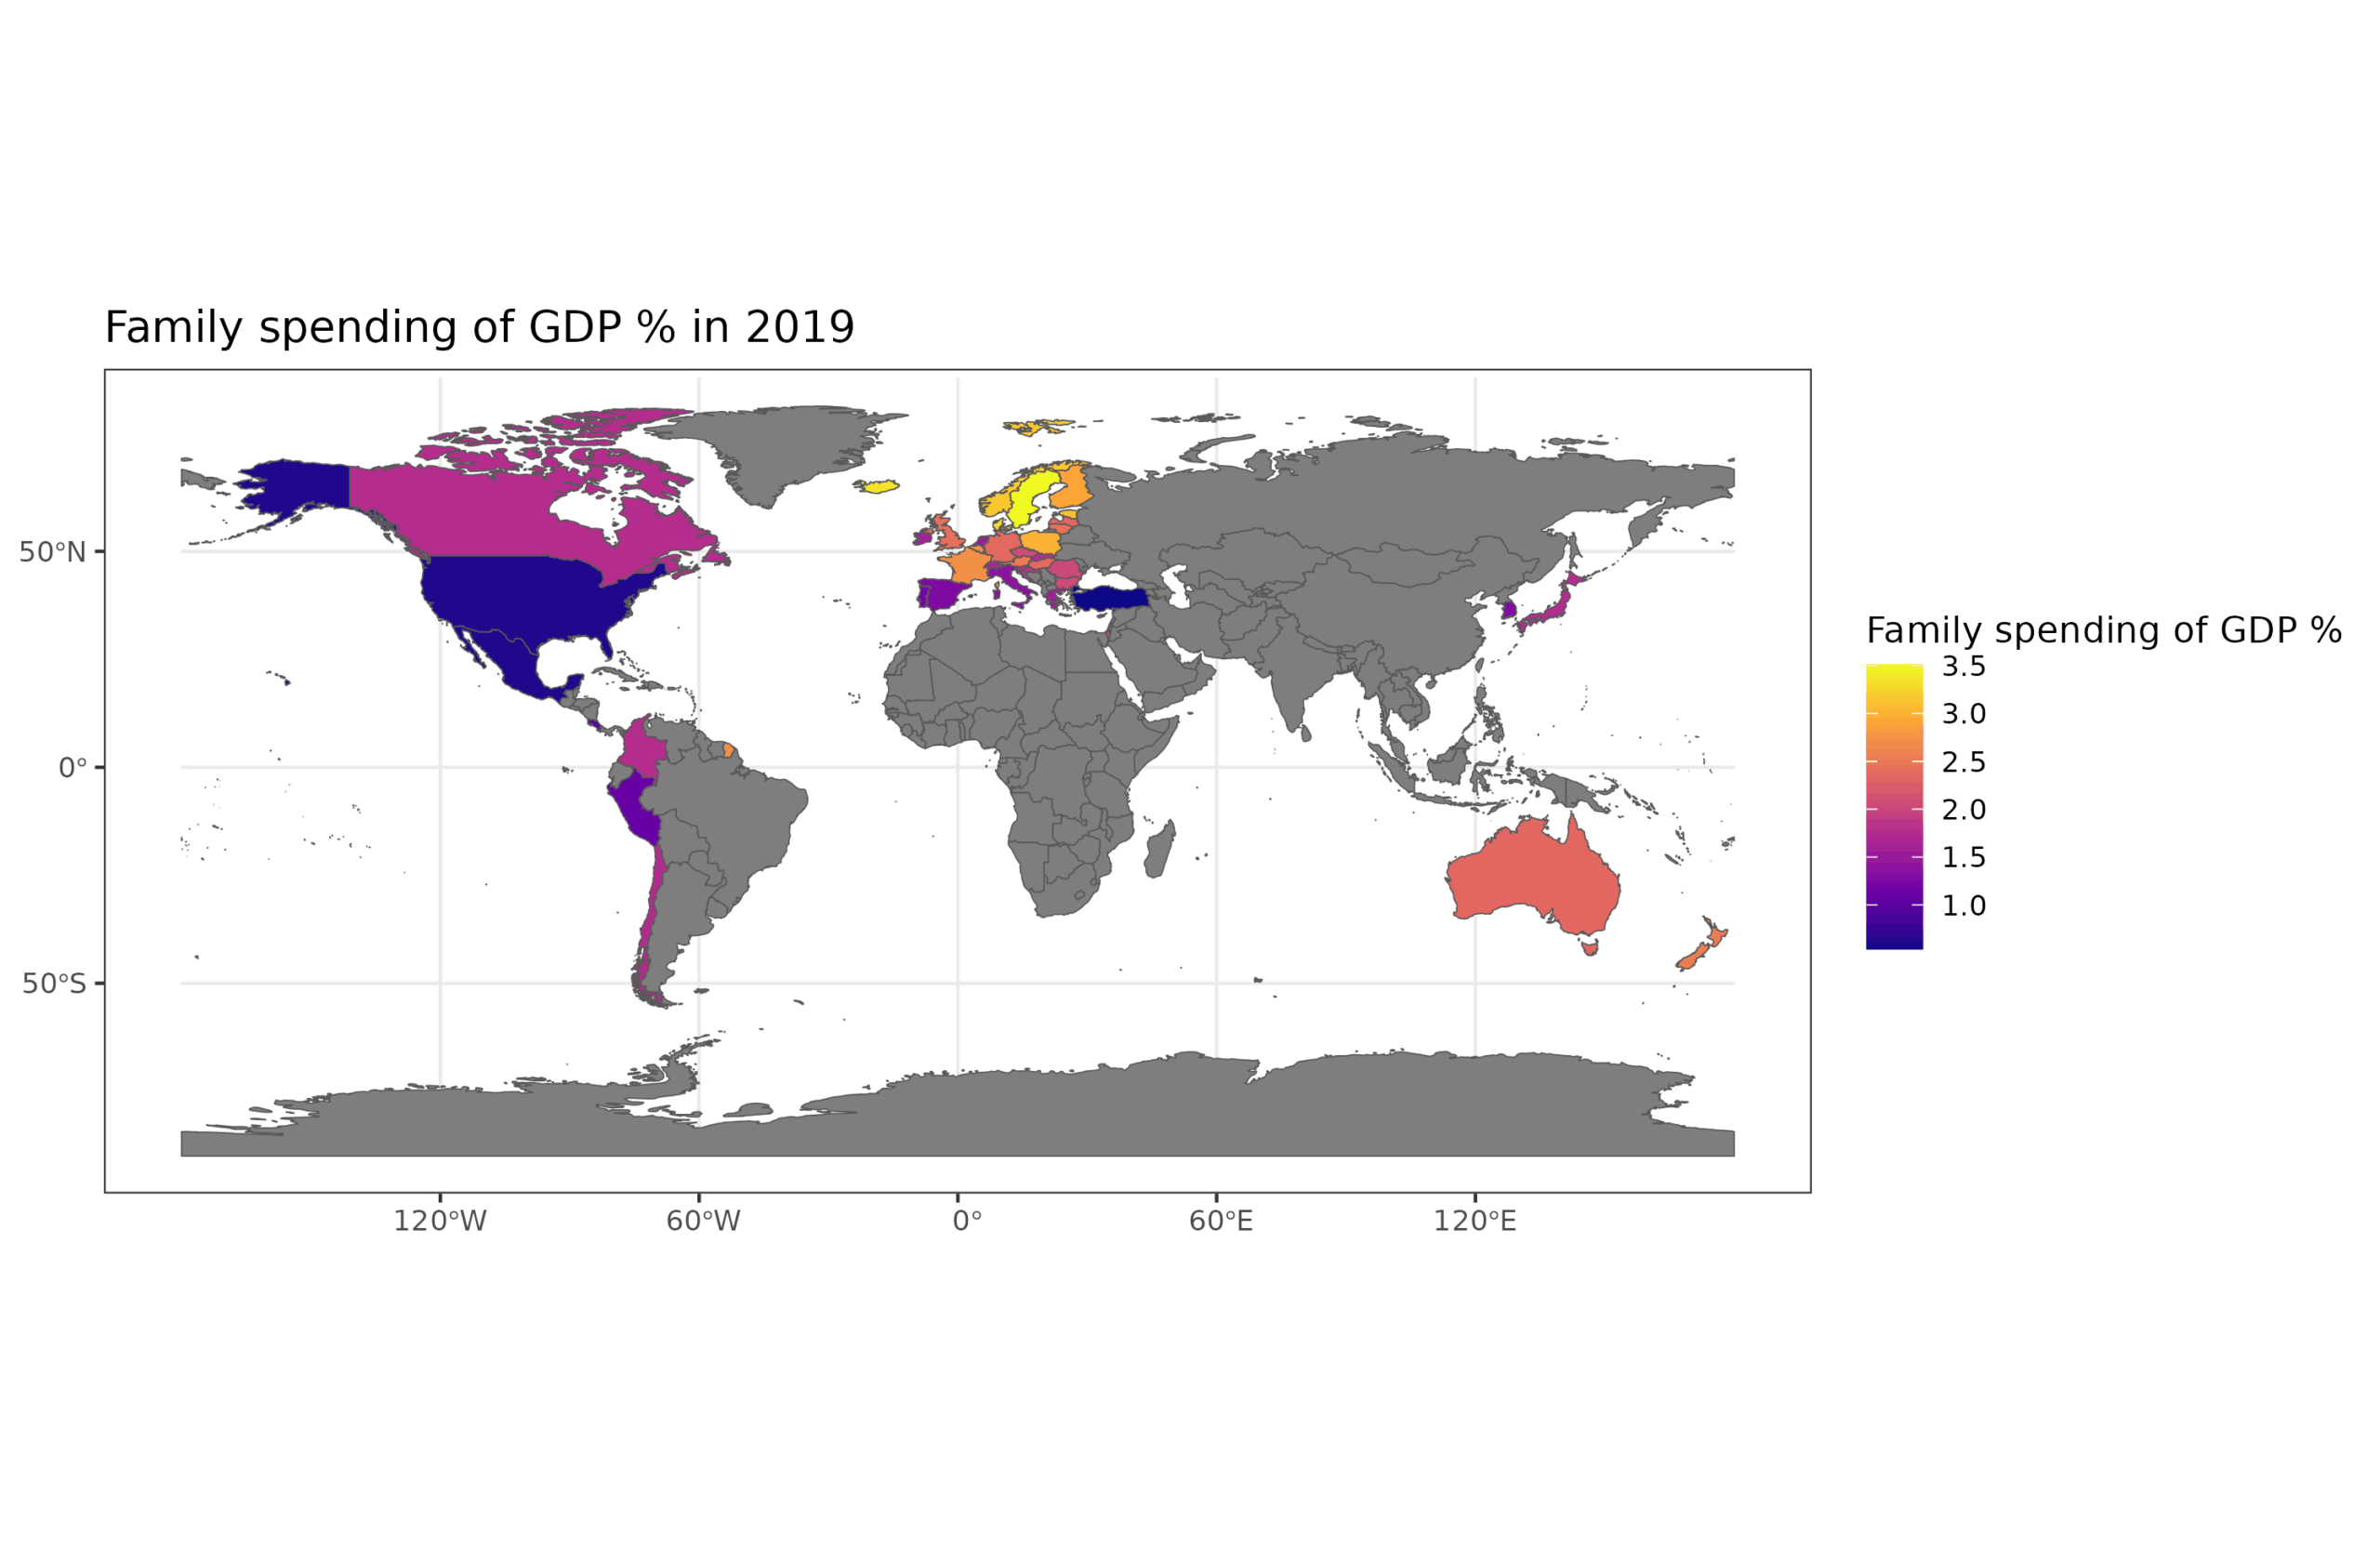
This is specifically government spending: “Public expenditure on family by type of expenditure (cash and in kind) in % GDP”. The point about making it relative to GDP is to control for cost differences. If we used instead raw values (say in USD), then we can argue about how much 1000 USD buys you in USA vs. Poland.
Do you see a pattern? Neither does the regression:
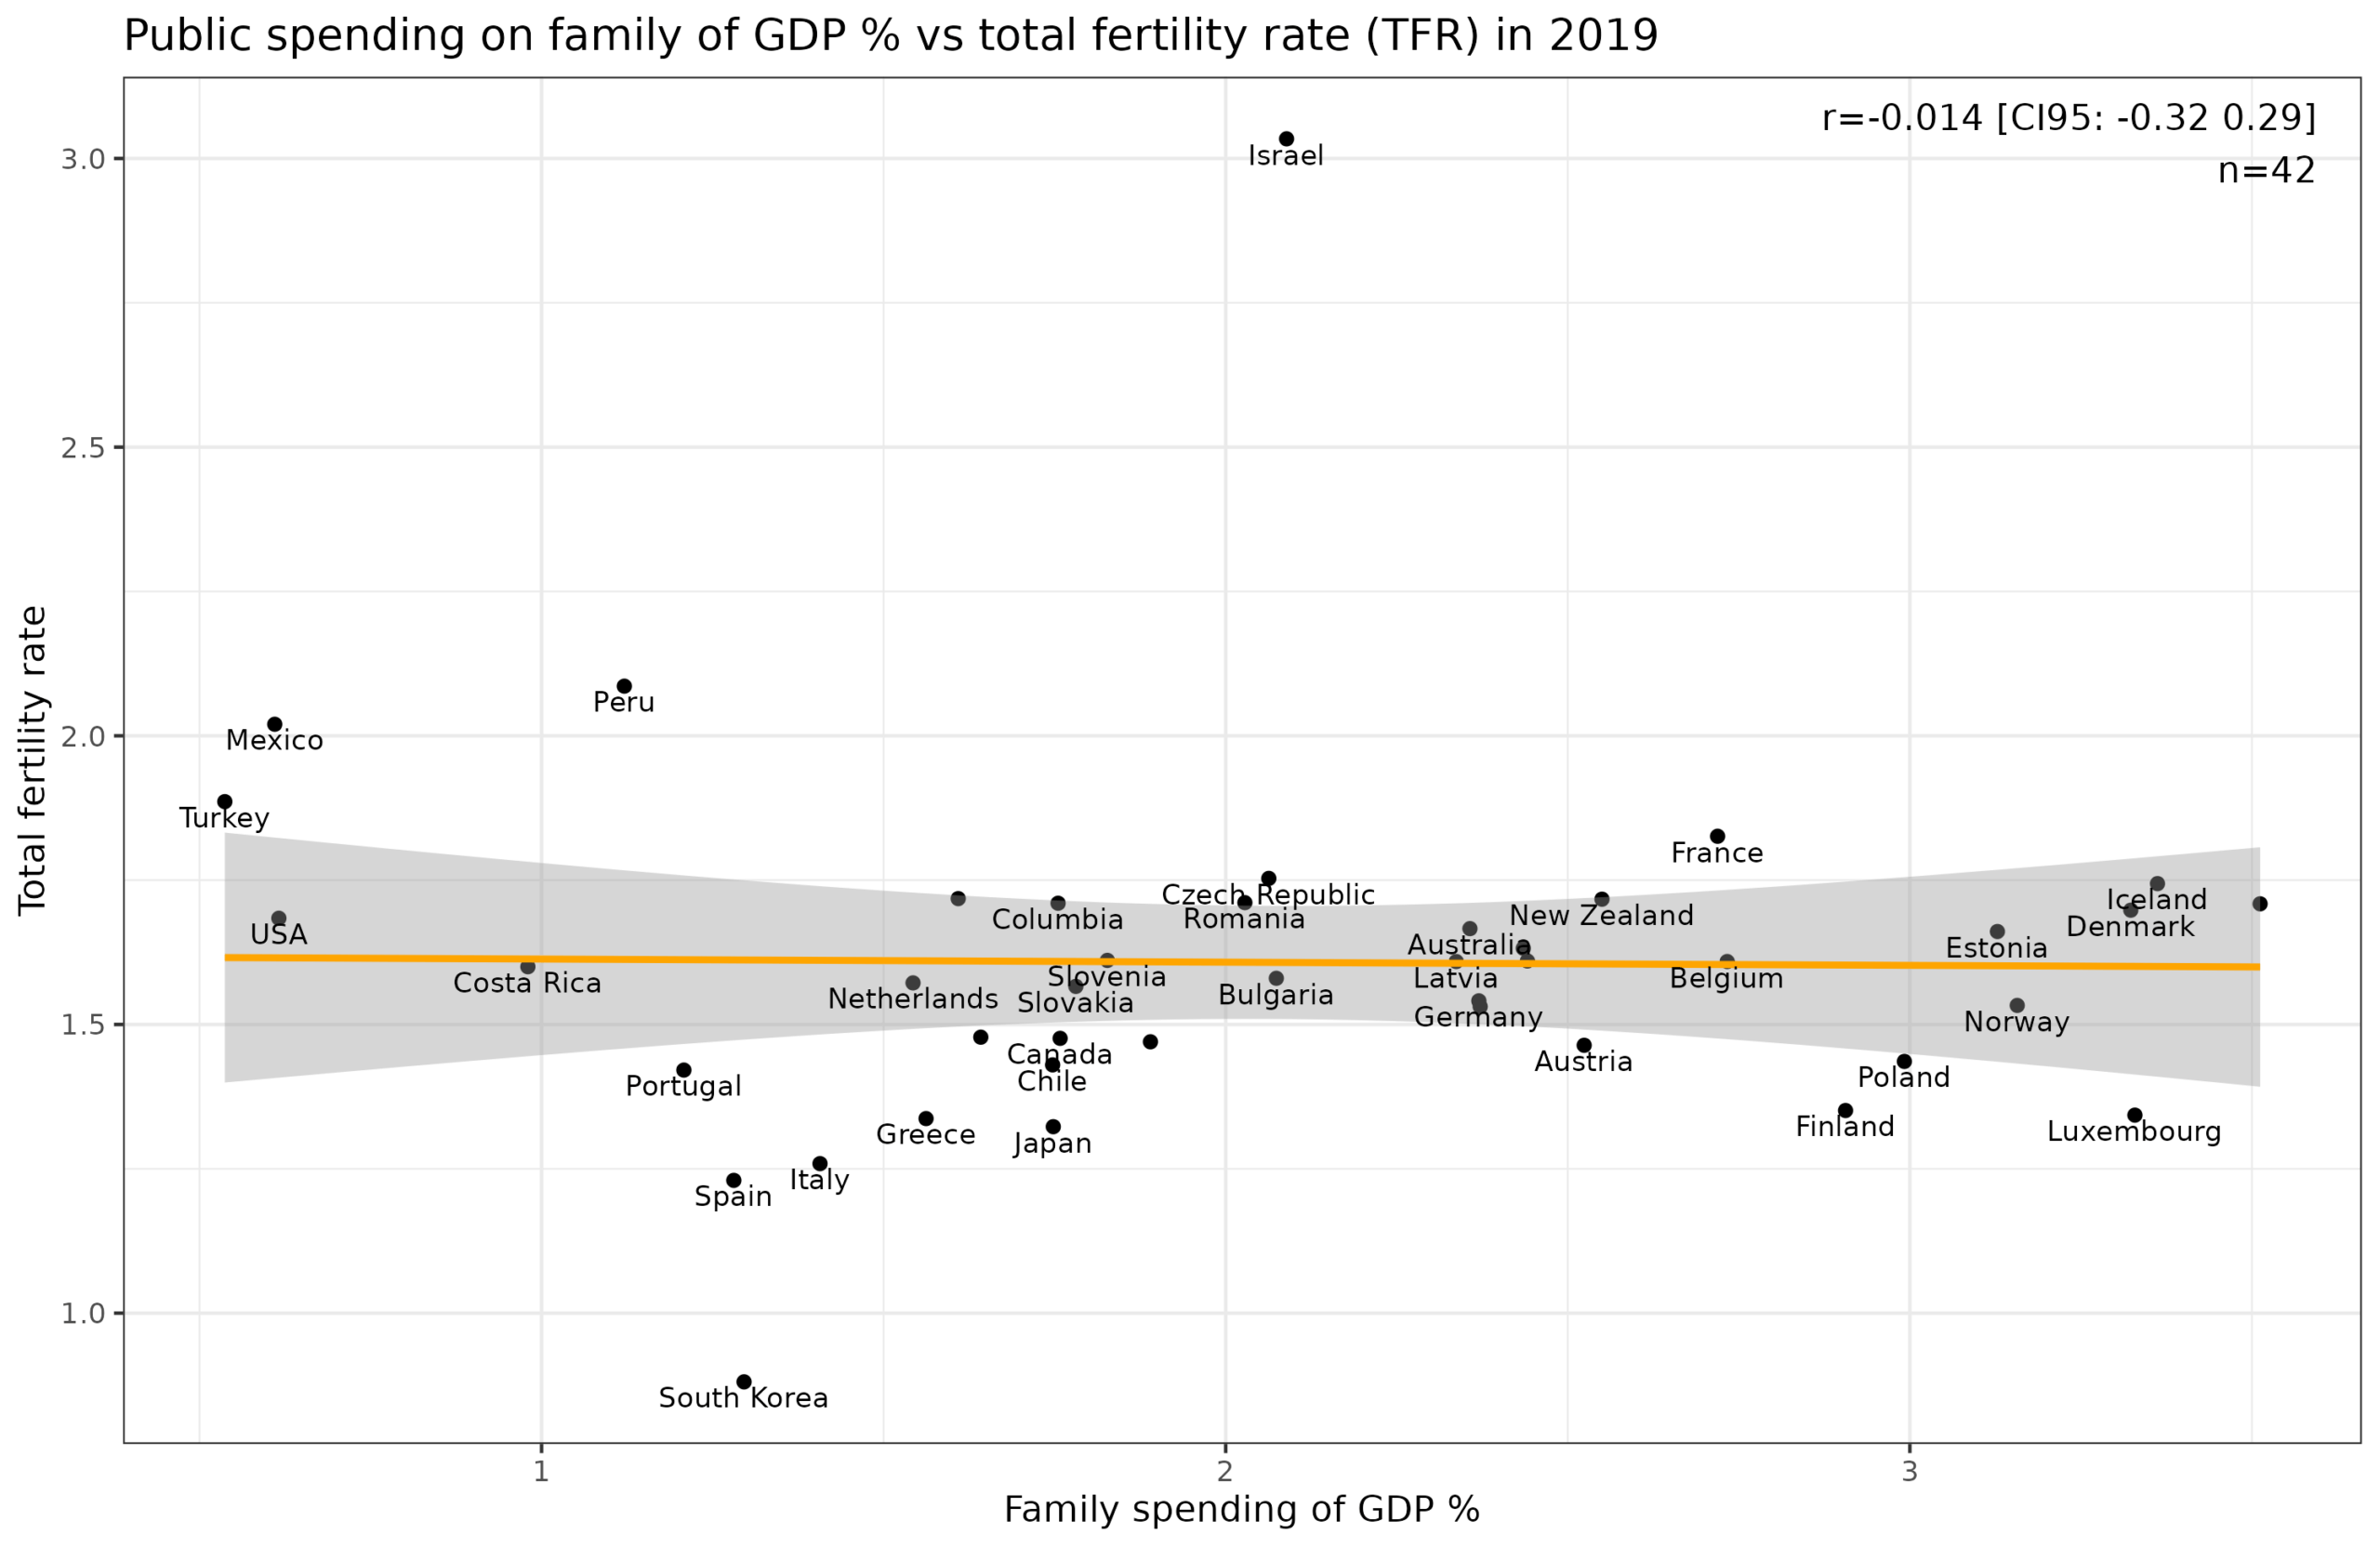
Why 2019? Well, I wanted to avoid any COVID-related issues, but every year of the data is the same:
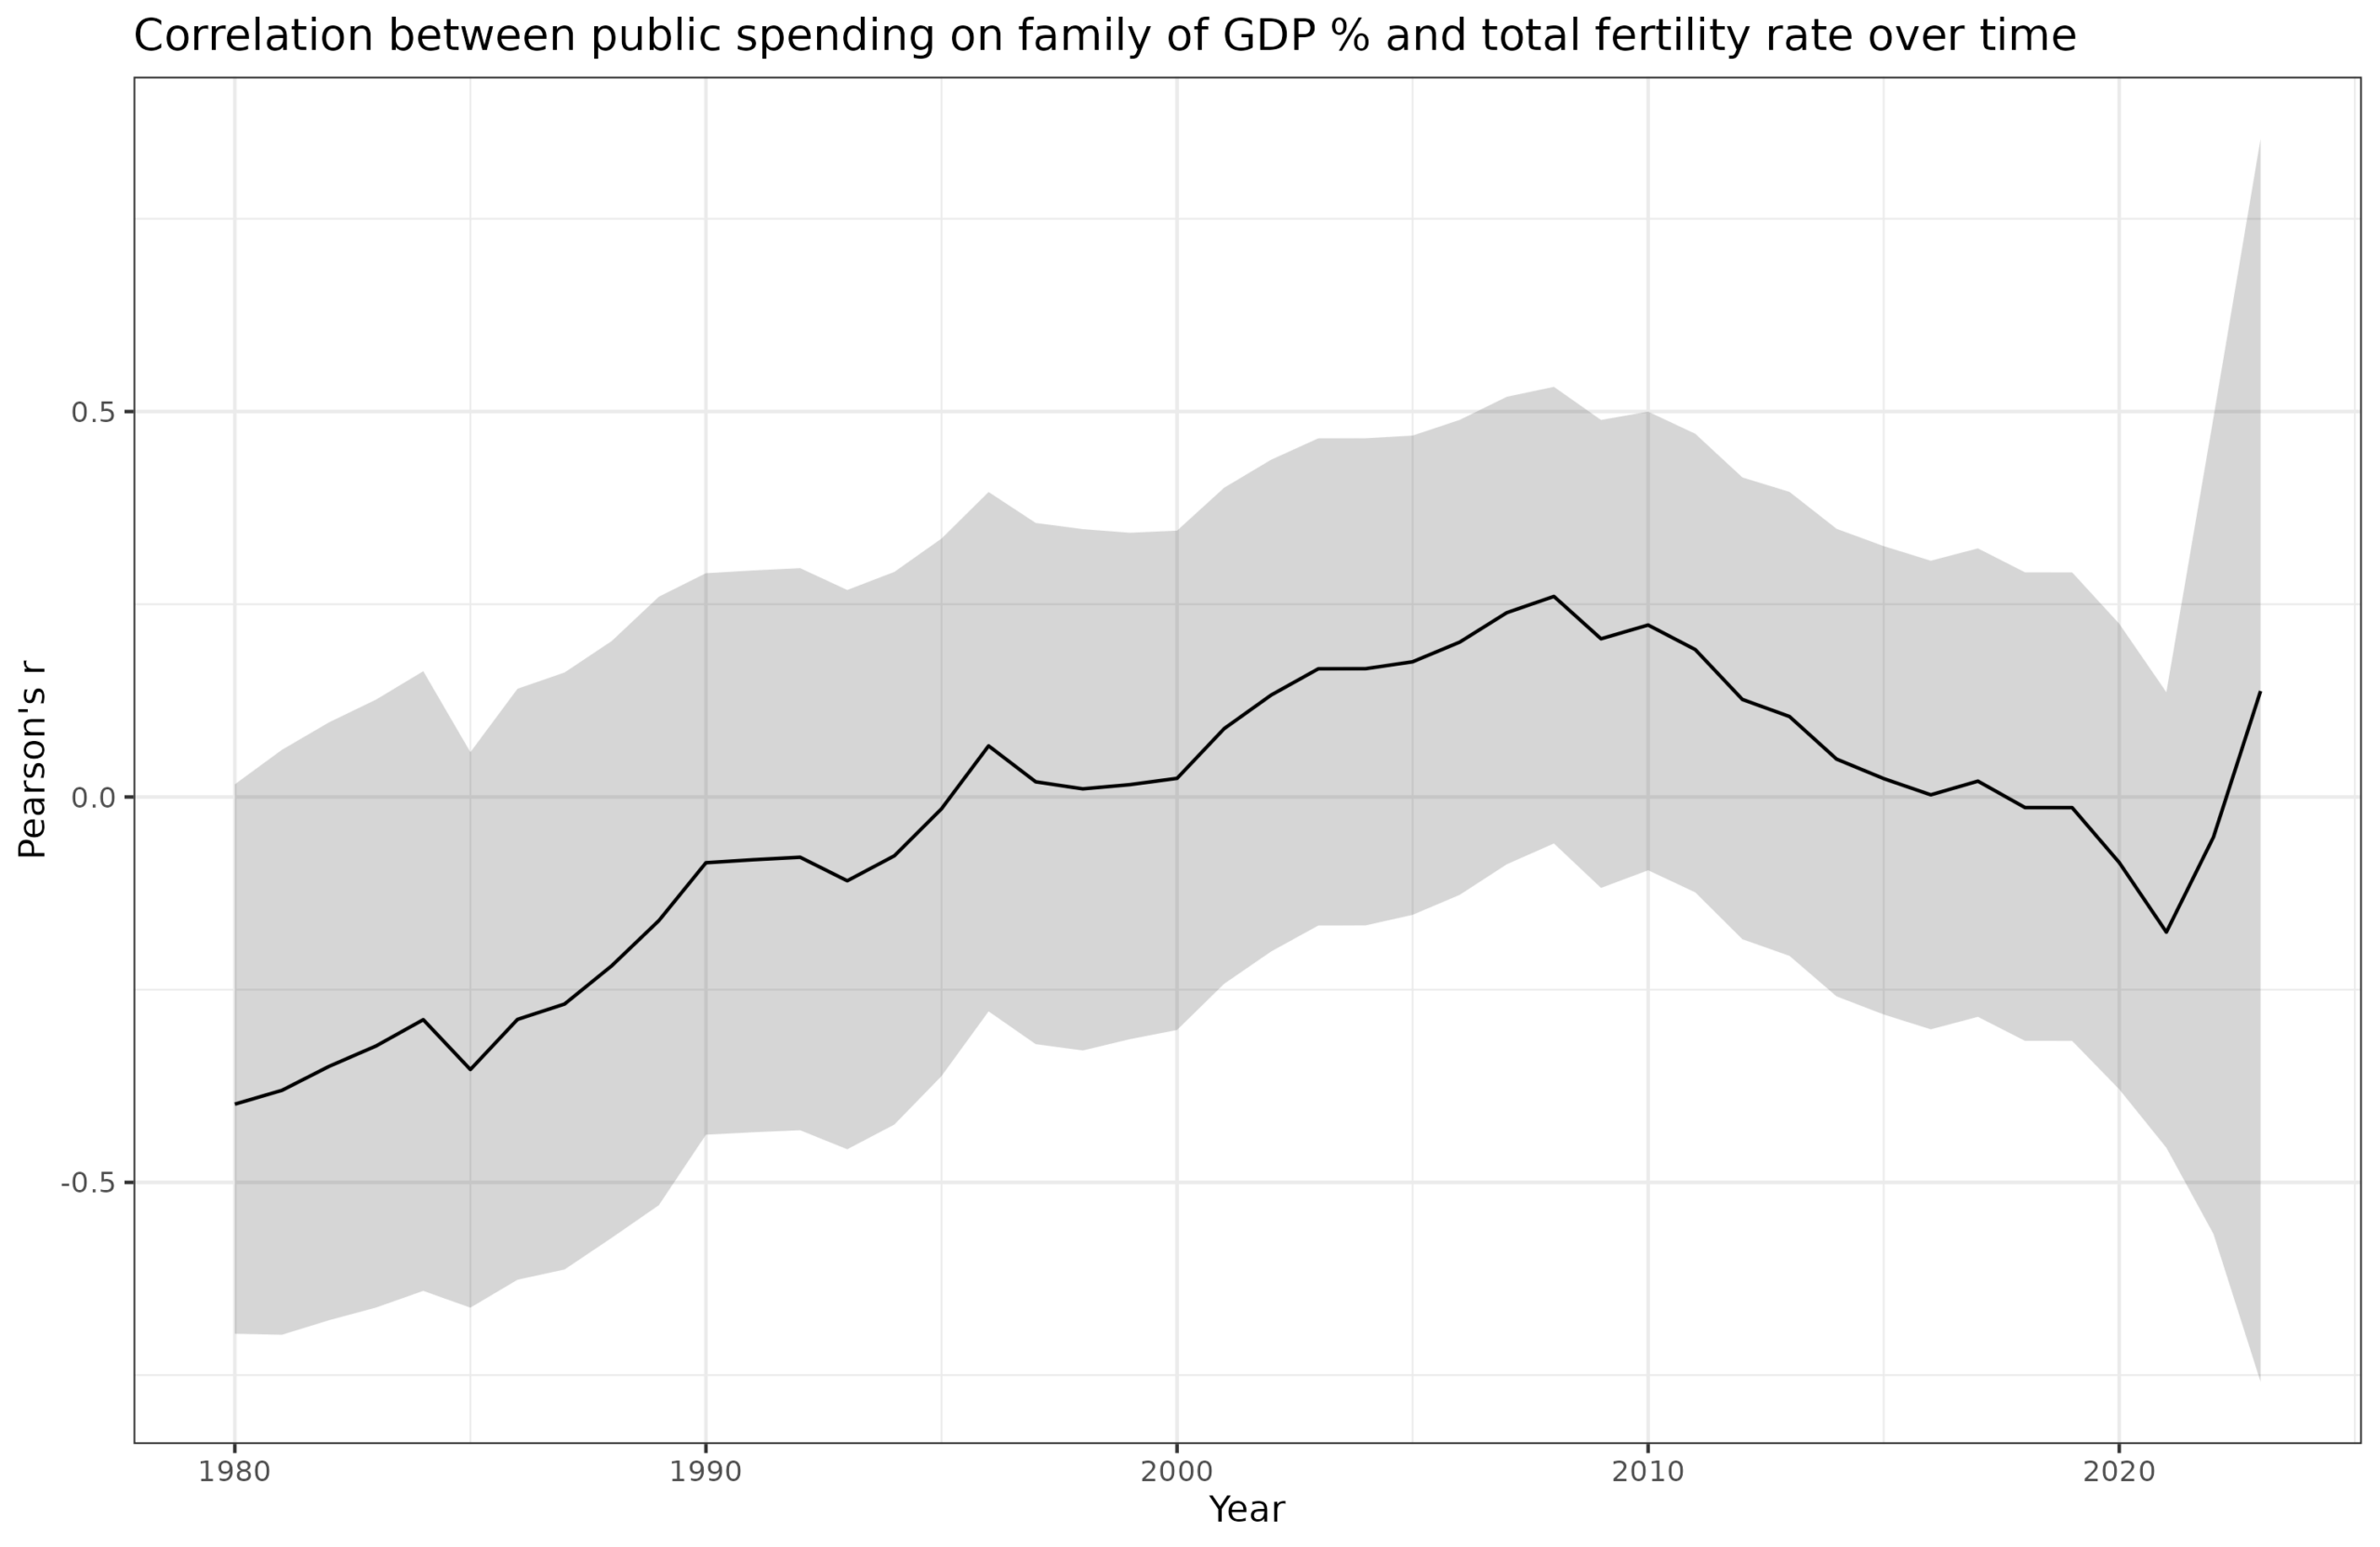
It was almost p<5% in 1980 but in the wrong direction. OK, but maybe it is confounded by something. I’m sure you already have 10 things in mind. Since we have time series data, we can use fixed effects to control for anything that is constant to a particular country or a year:
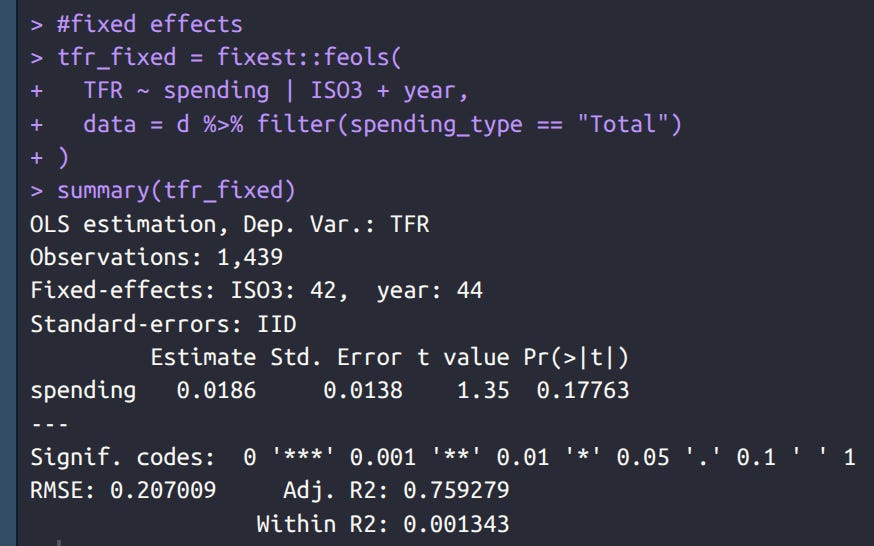
There is no relationship.
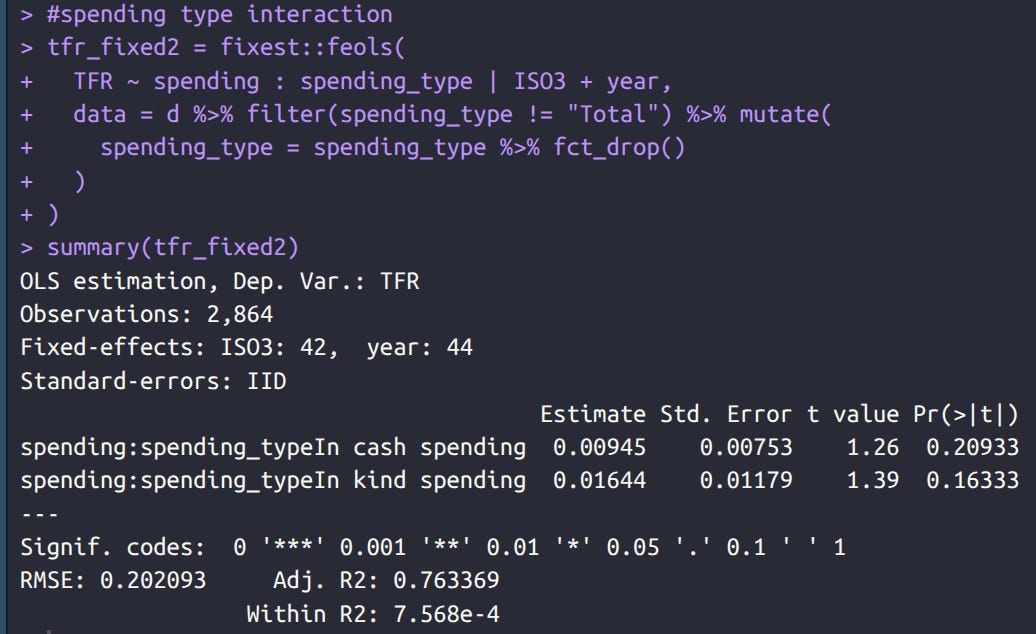
OK, but maybe it is the spending type that matters? Can we find p < 5% anywhere if we try every model variant? OECD breaks down the spending into “In kind spending” (govt gives you stuff, like free childcare) vs. “In cash spending” (govt gives you money, like maternal paid leave). Most of the spending in “in kind” but it doesn’t matter anyway:
OK, but maybe it takes a while for the policies to have an effect. After all, a pregnancy takes 9 months at least, and it may take a while to decide to try this and get it working. So we can try lagging the values (use previous year’s spending to present current year’s TFR):
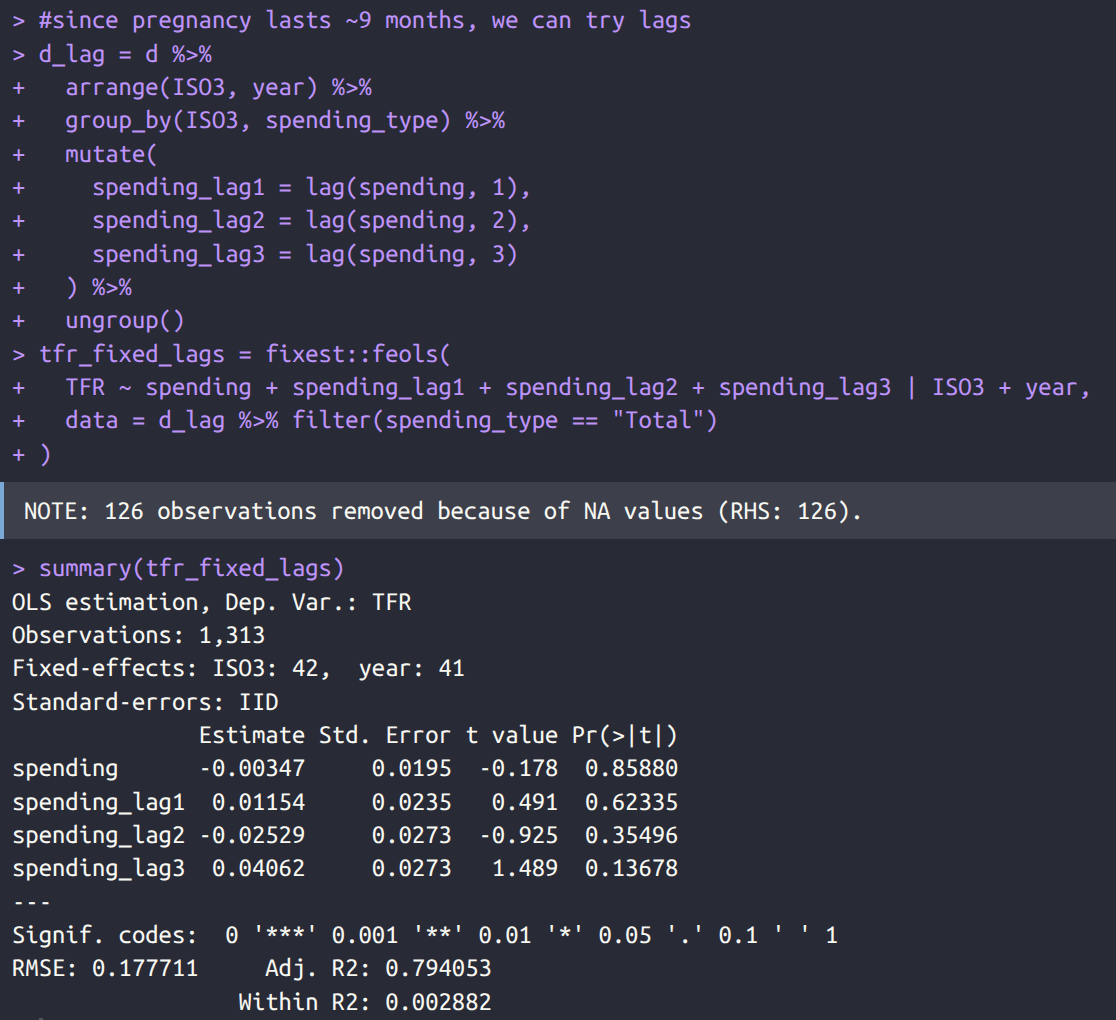
Nothing again.
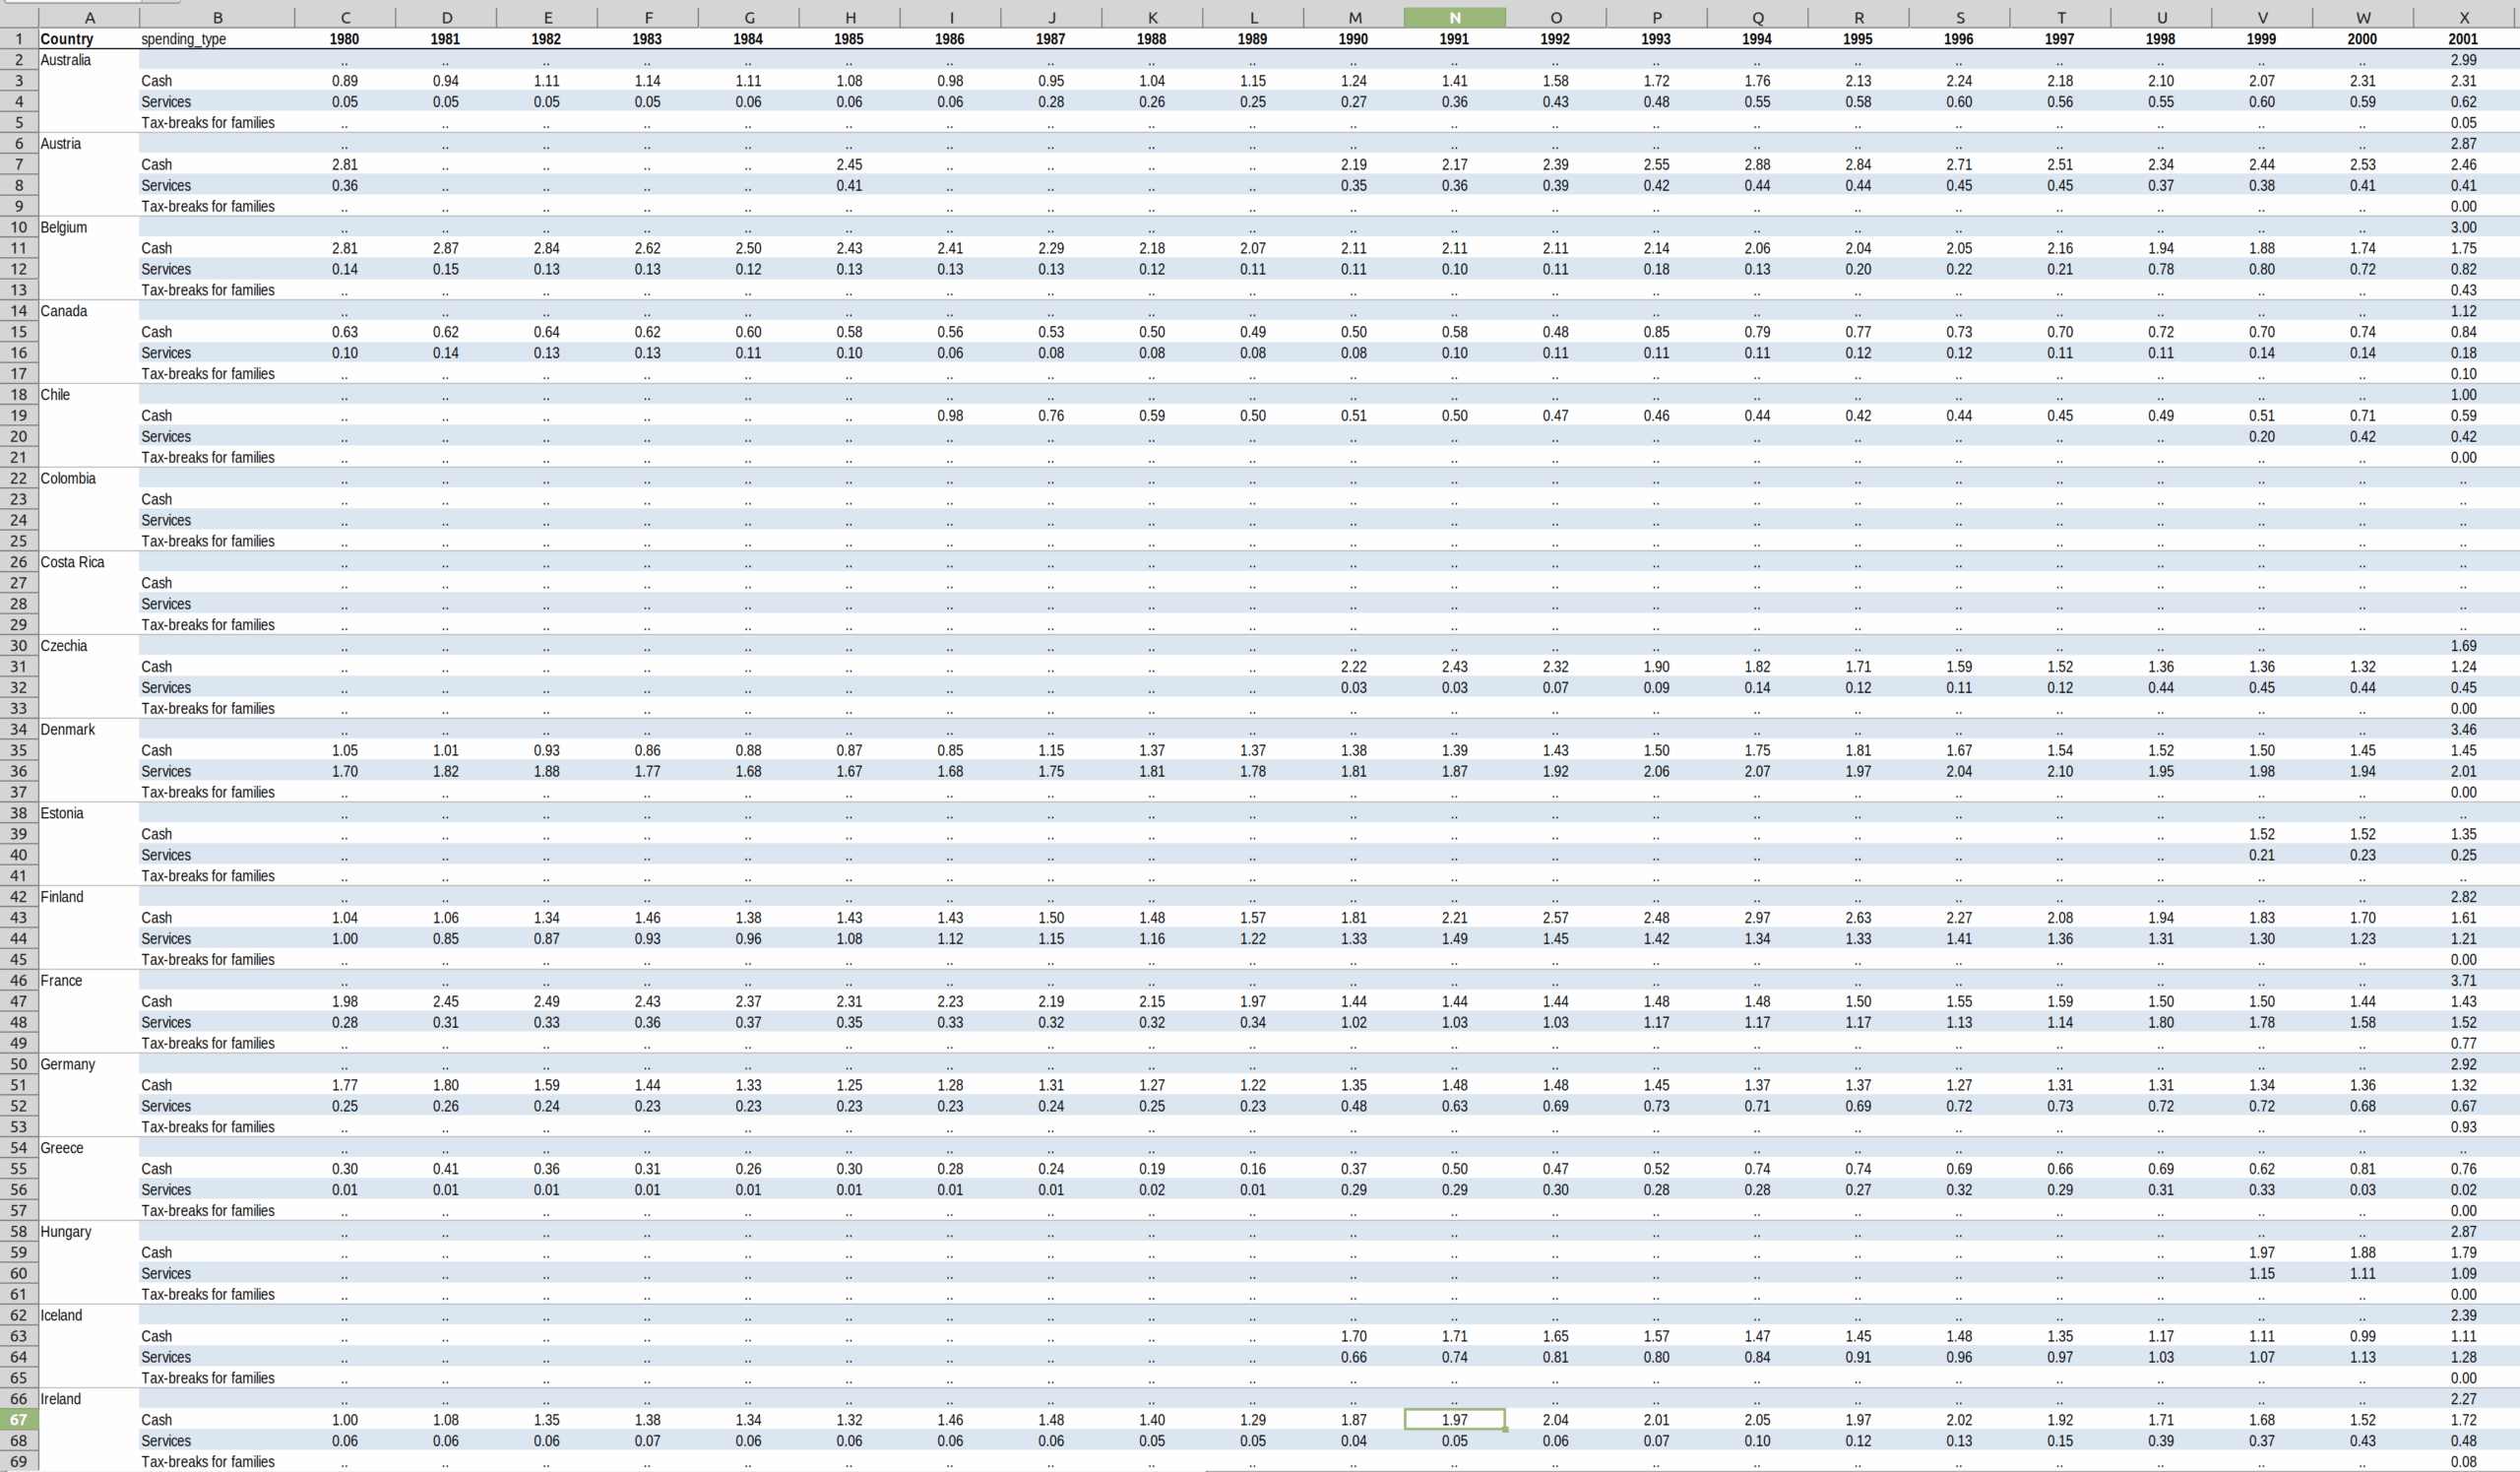
One thing here is that tax deductions aren’t included because they aren’t government spending, but government foregoing revenue. OECD does track this elsewhere, but apparently not in this database. However, one can find some Excel files and PDFs with the data:
The tax deductions are sometimes a non-trivial part of the spending (net loss) for the government. For instance, for USA, the total is 0.99% of GDP in 2021, of which 0.05% were cash, 0.57% services, and 0.37% tax deductions. Anyway, we can see why perhaps OECD does not generally include this in their time series datasets:
The dataset is full of missing values, and thus the totals cannot be computed when a component is missing (you can’t assume it is 0). It’s mainly the tax deductions that are missing for older years. Thus if one makes the total of only cash and services, one can get much better coverage. So let’s try the 2021 data, newest and perhaps most complete:
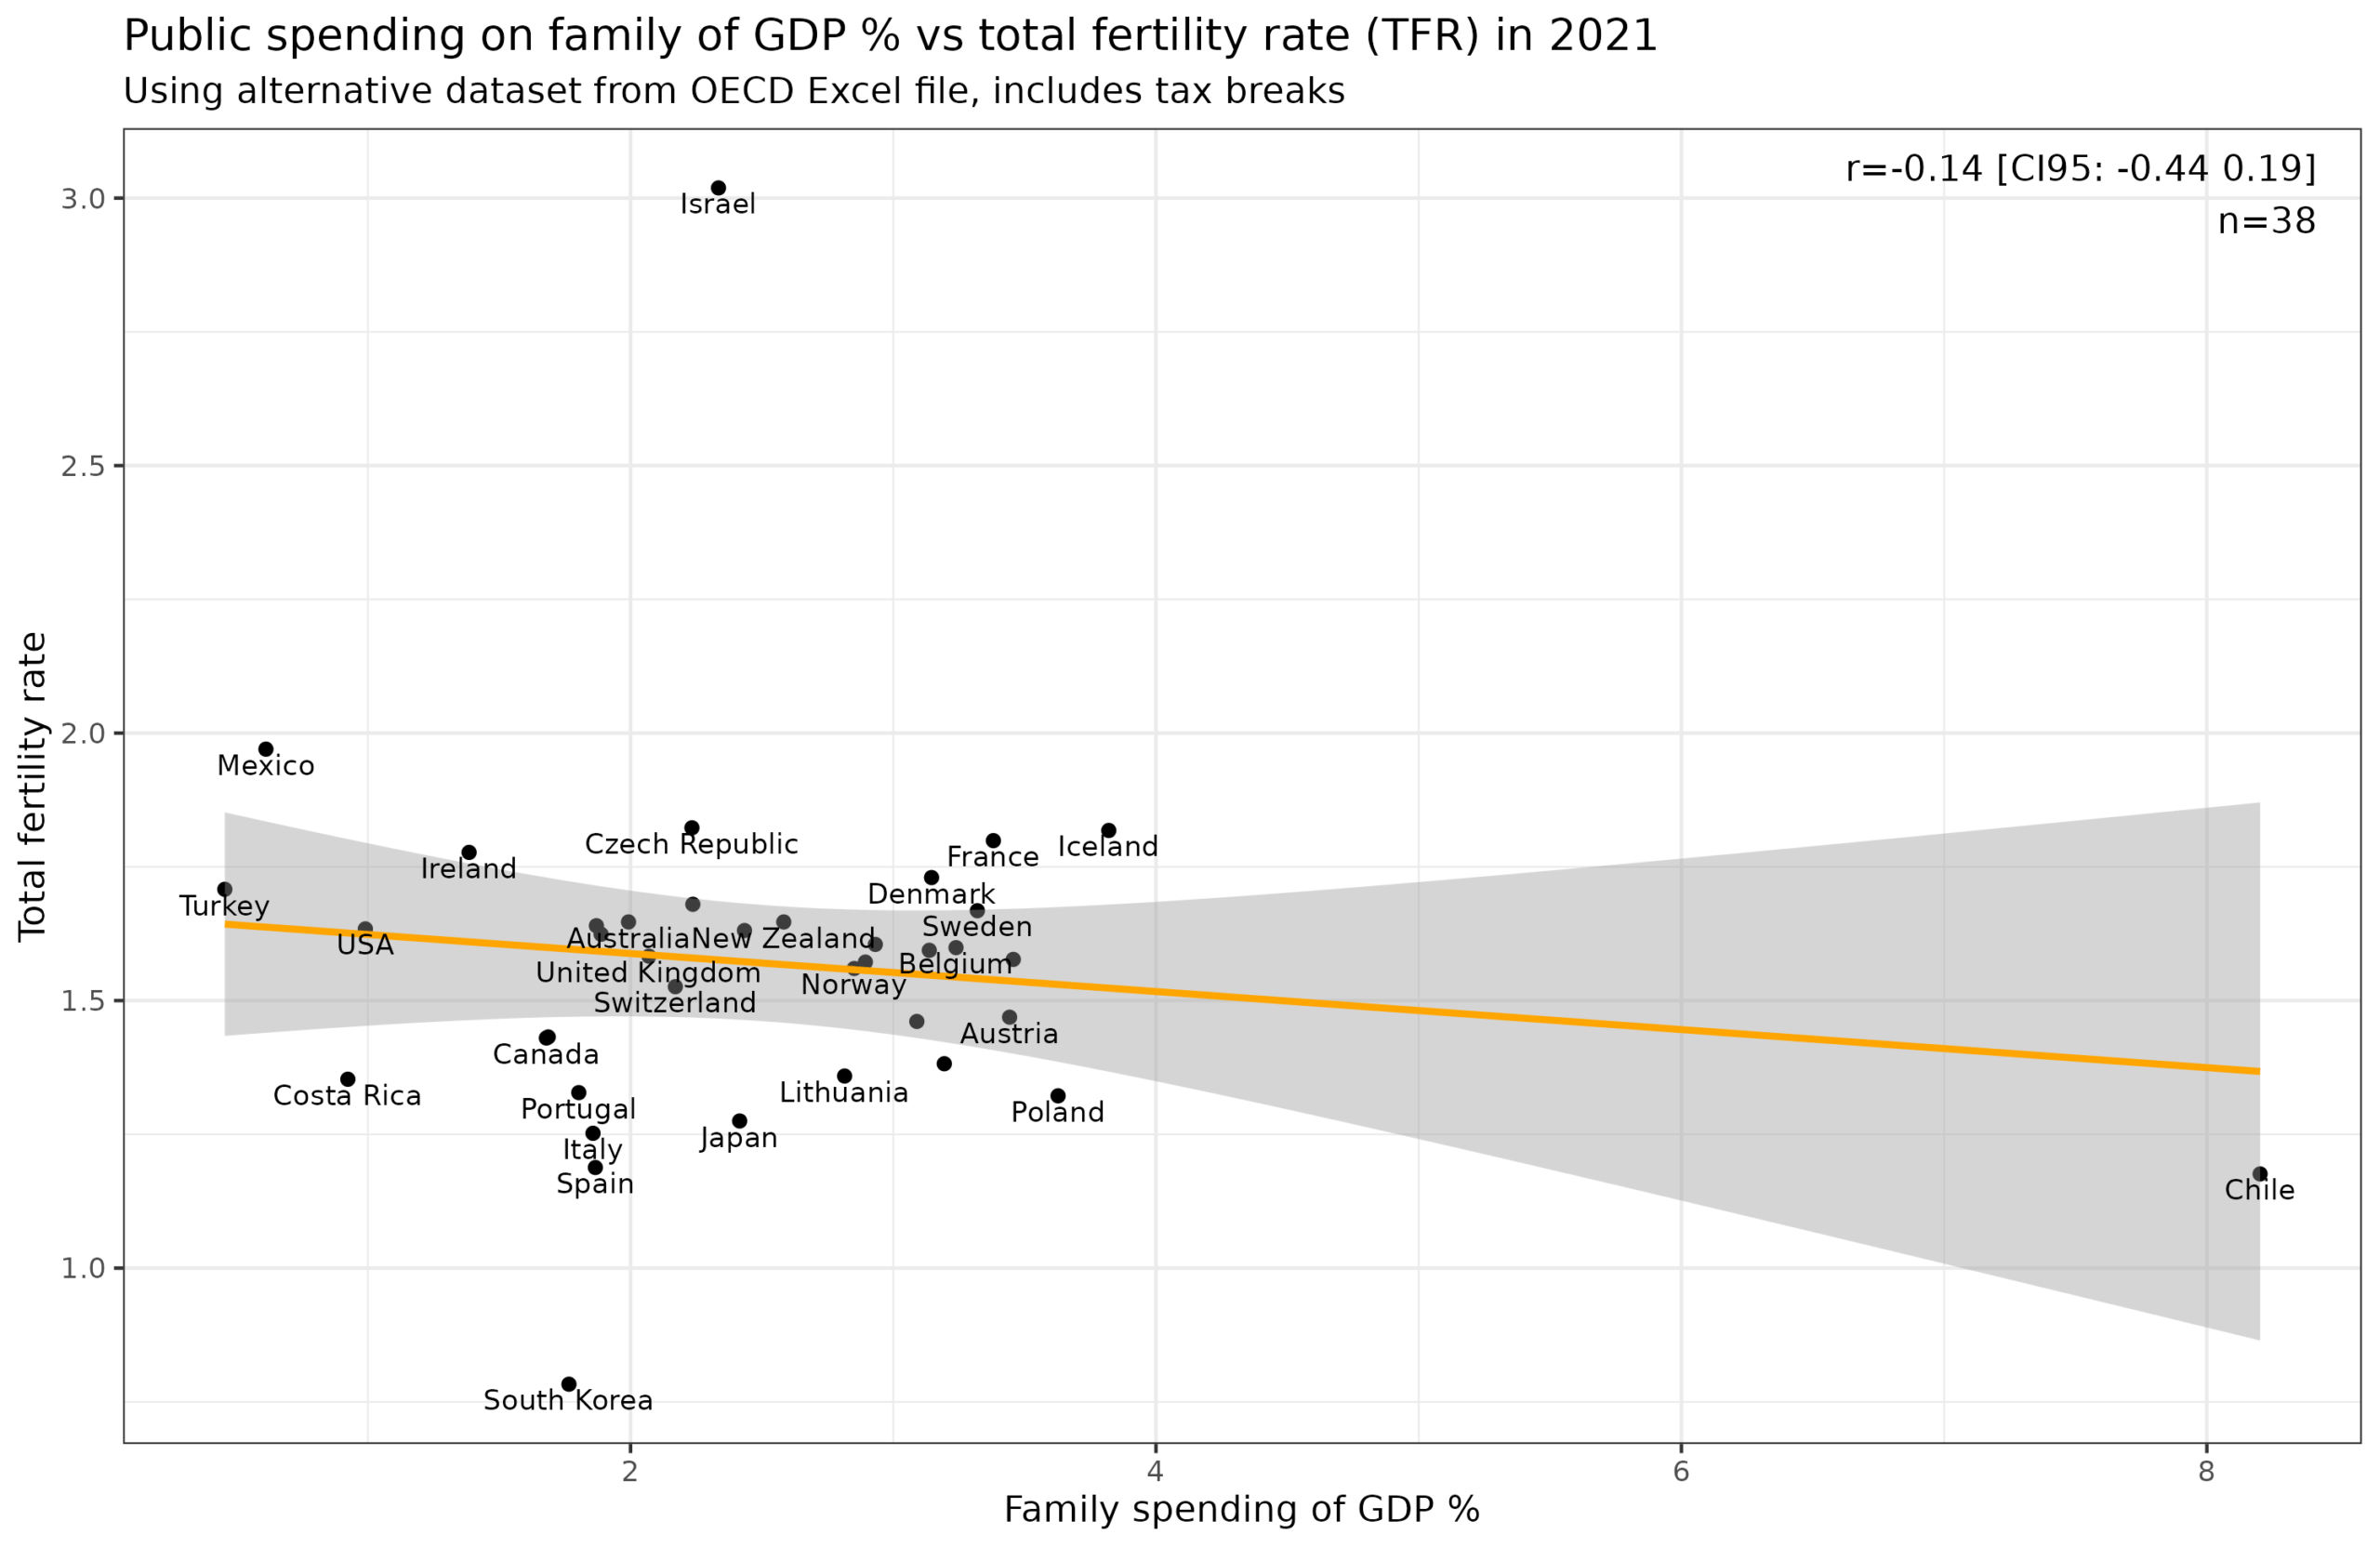
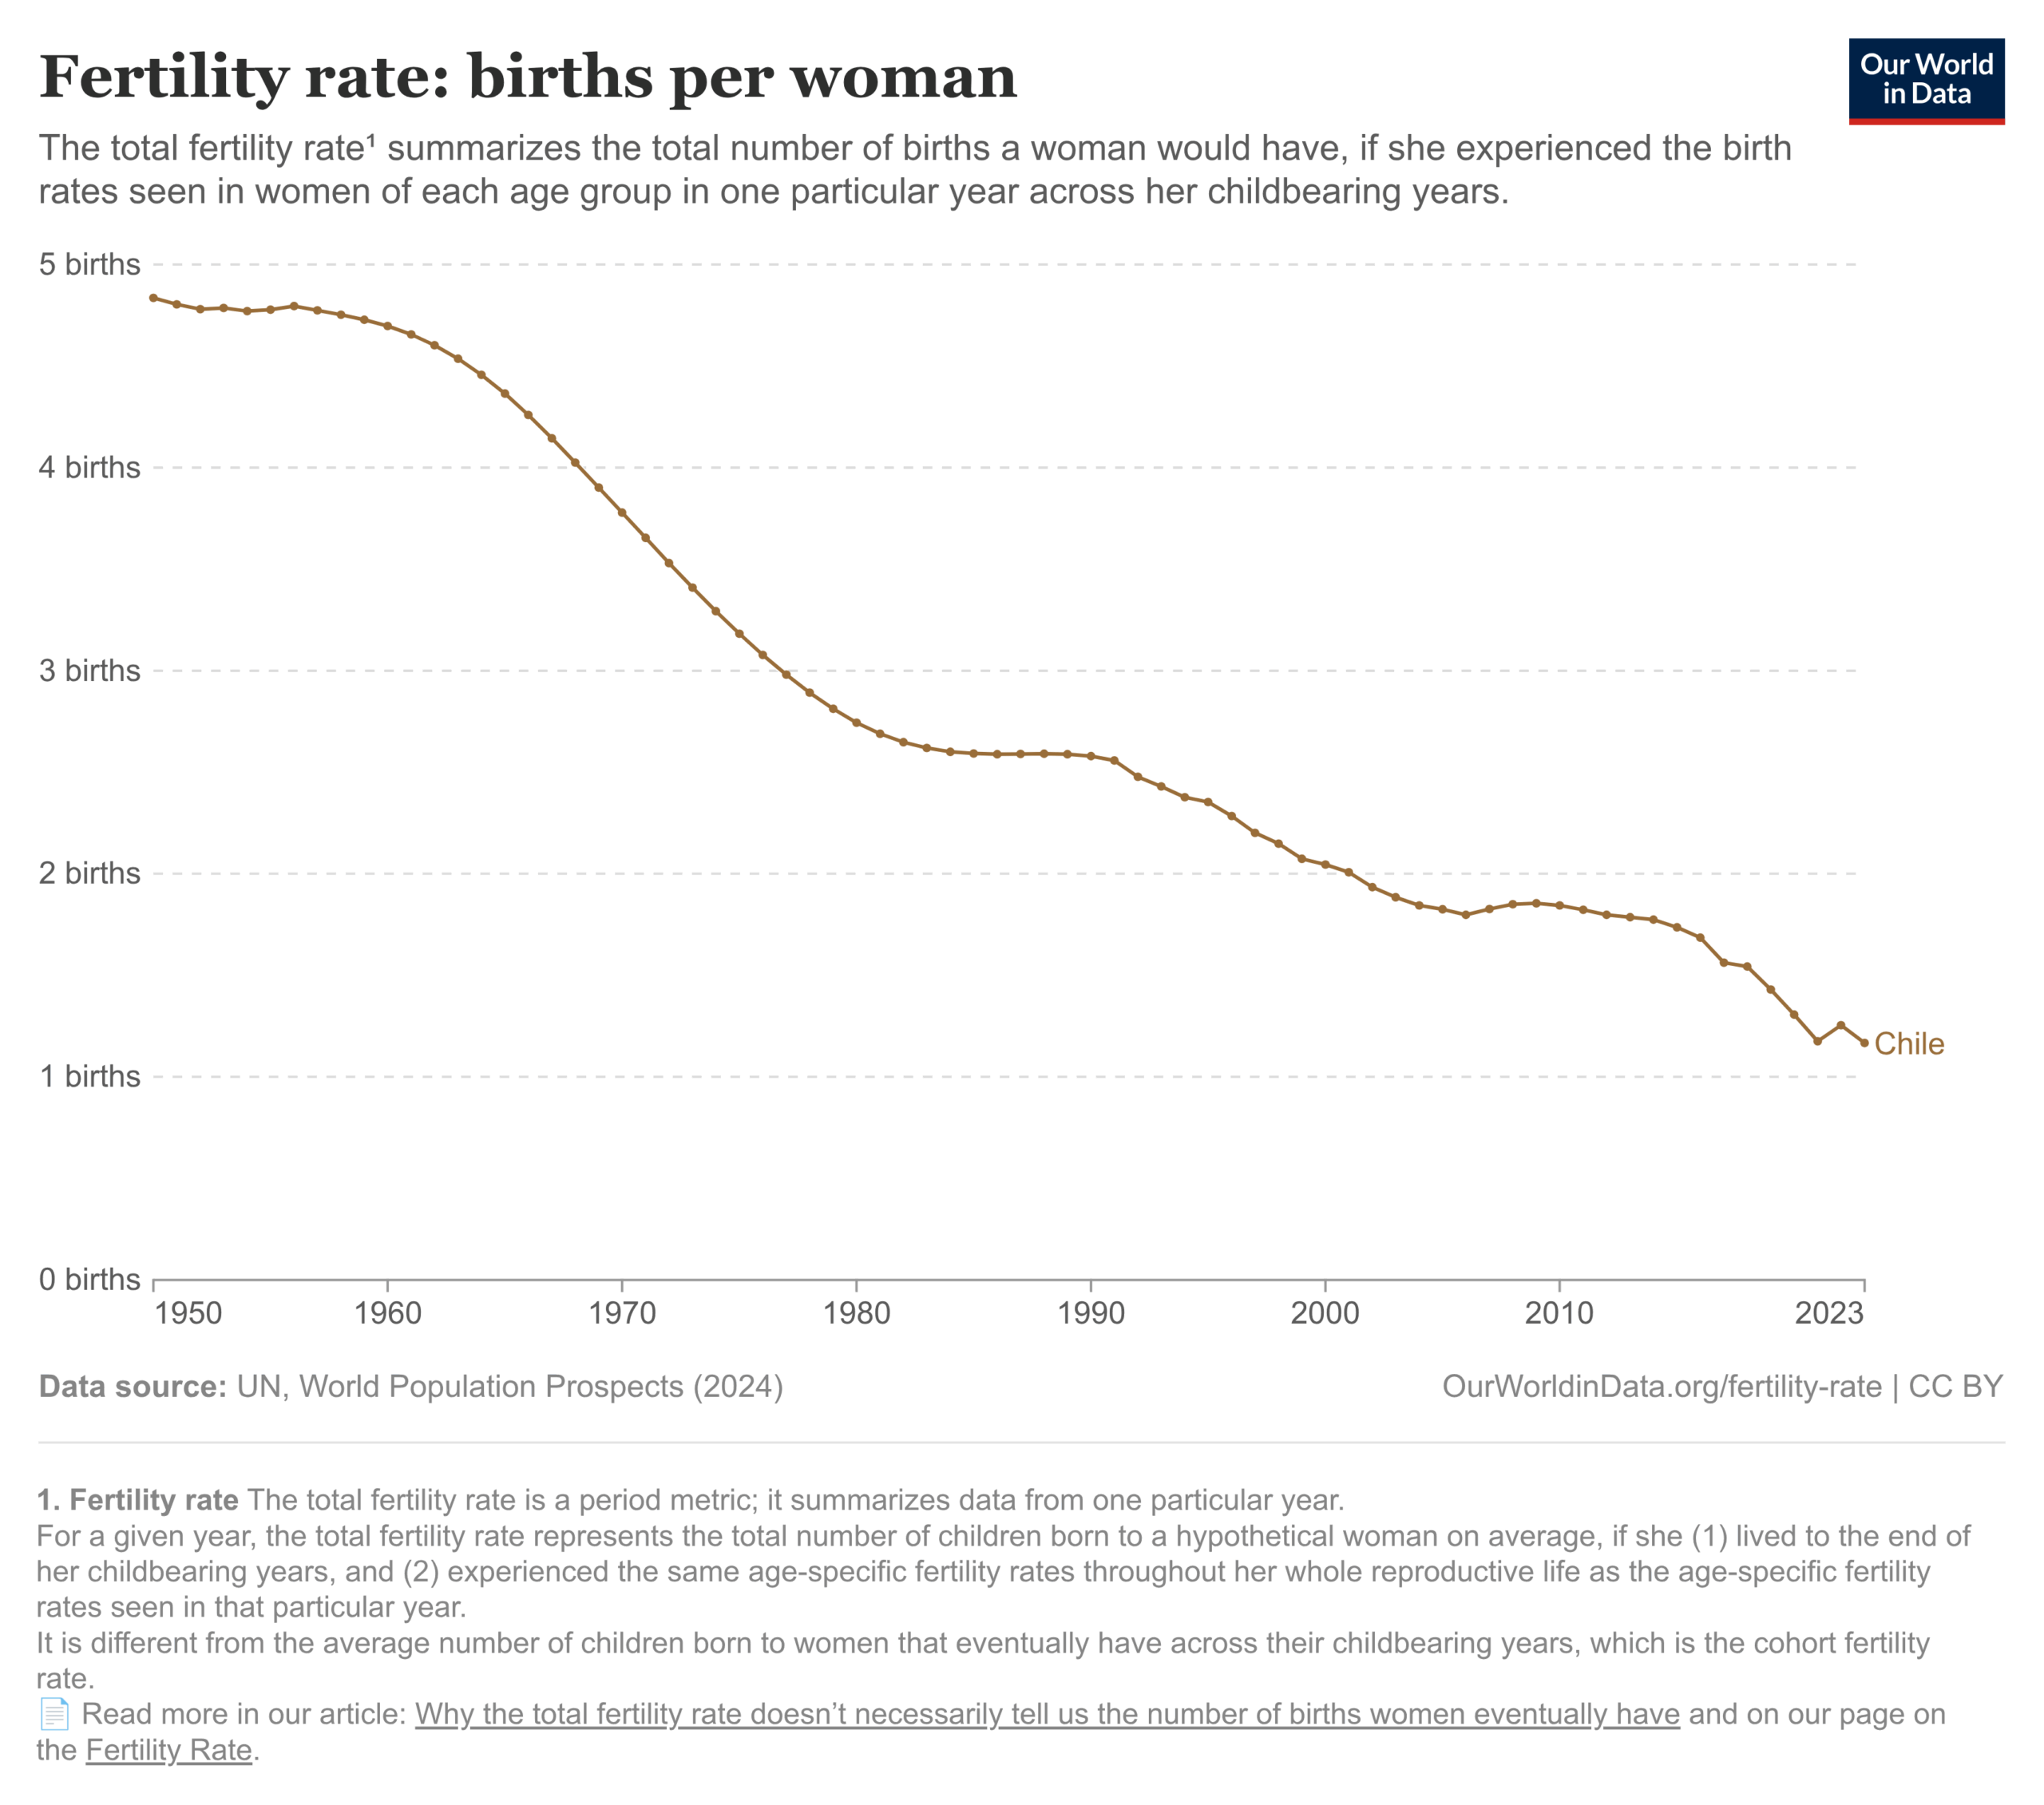
Still nothing but we see that Chile is now outspending everybody by at least 3-4x rate. This is because of a COVID-related family emergency policy, which is now phased out. Chile didn’t see any birth spike from this massive spending either:
There is a small bump in 2022. Maybe that’s the effect. But if 8% of GDP buys you an increase of 0.1 fertility, then it is truly hopeless. Of course, one problem here is that this policy was temporary (otherwise the country would go bankrupt very quickly).
Anyway, the new totals including tax breaks found nothing of interest either. However, looking at spending types, we seemingly hit gold:
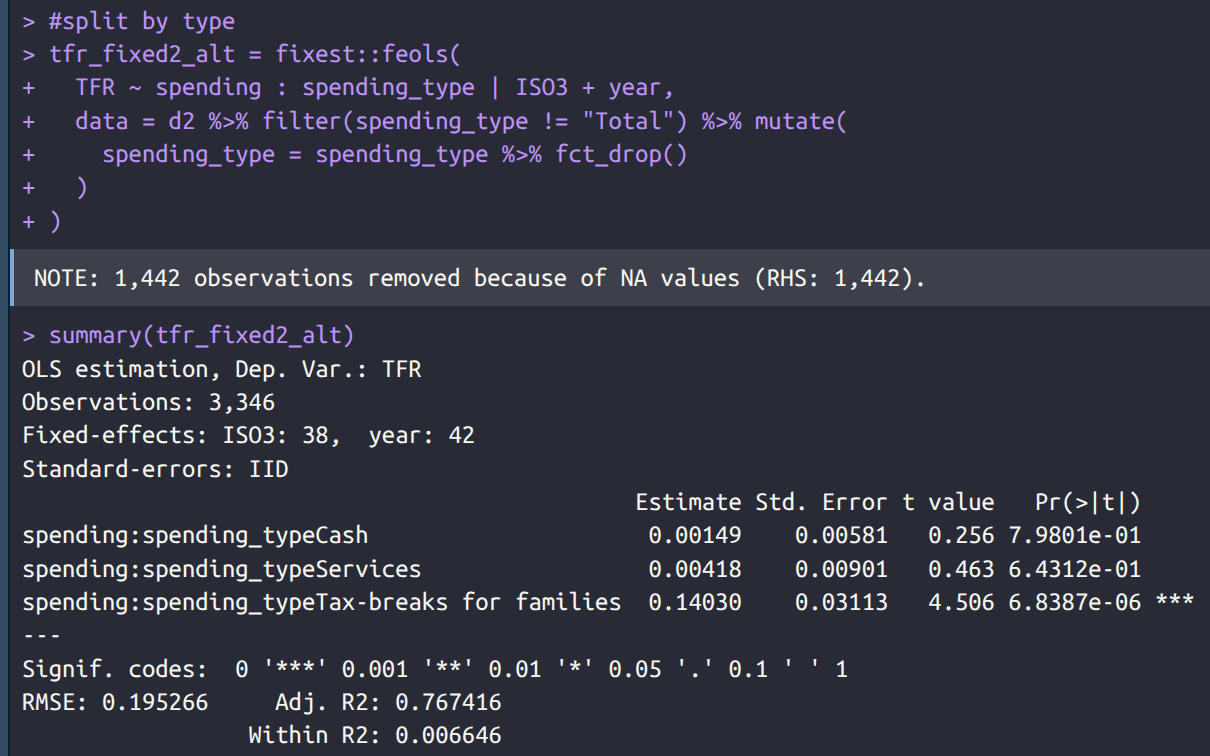
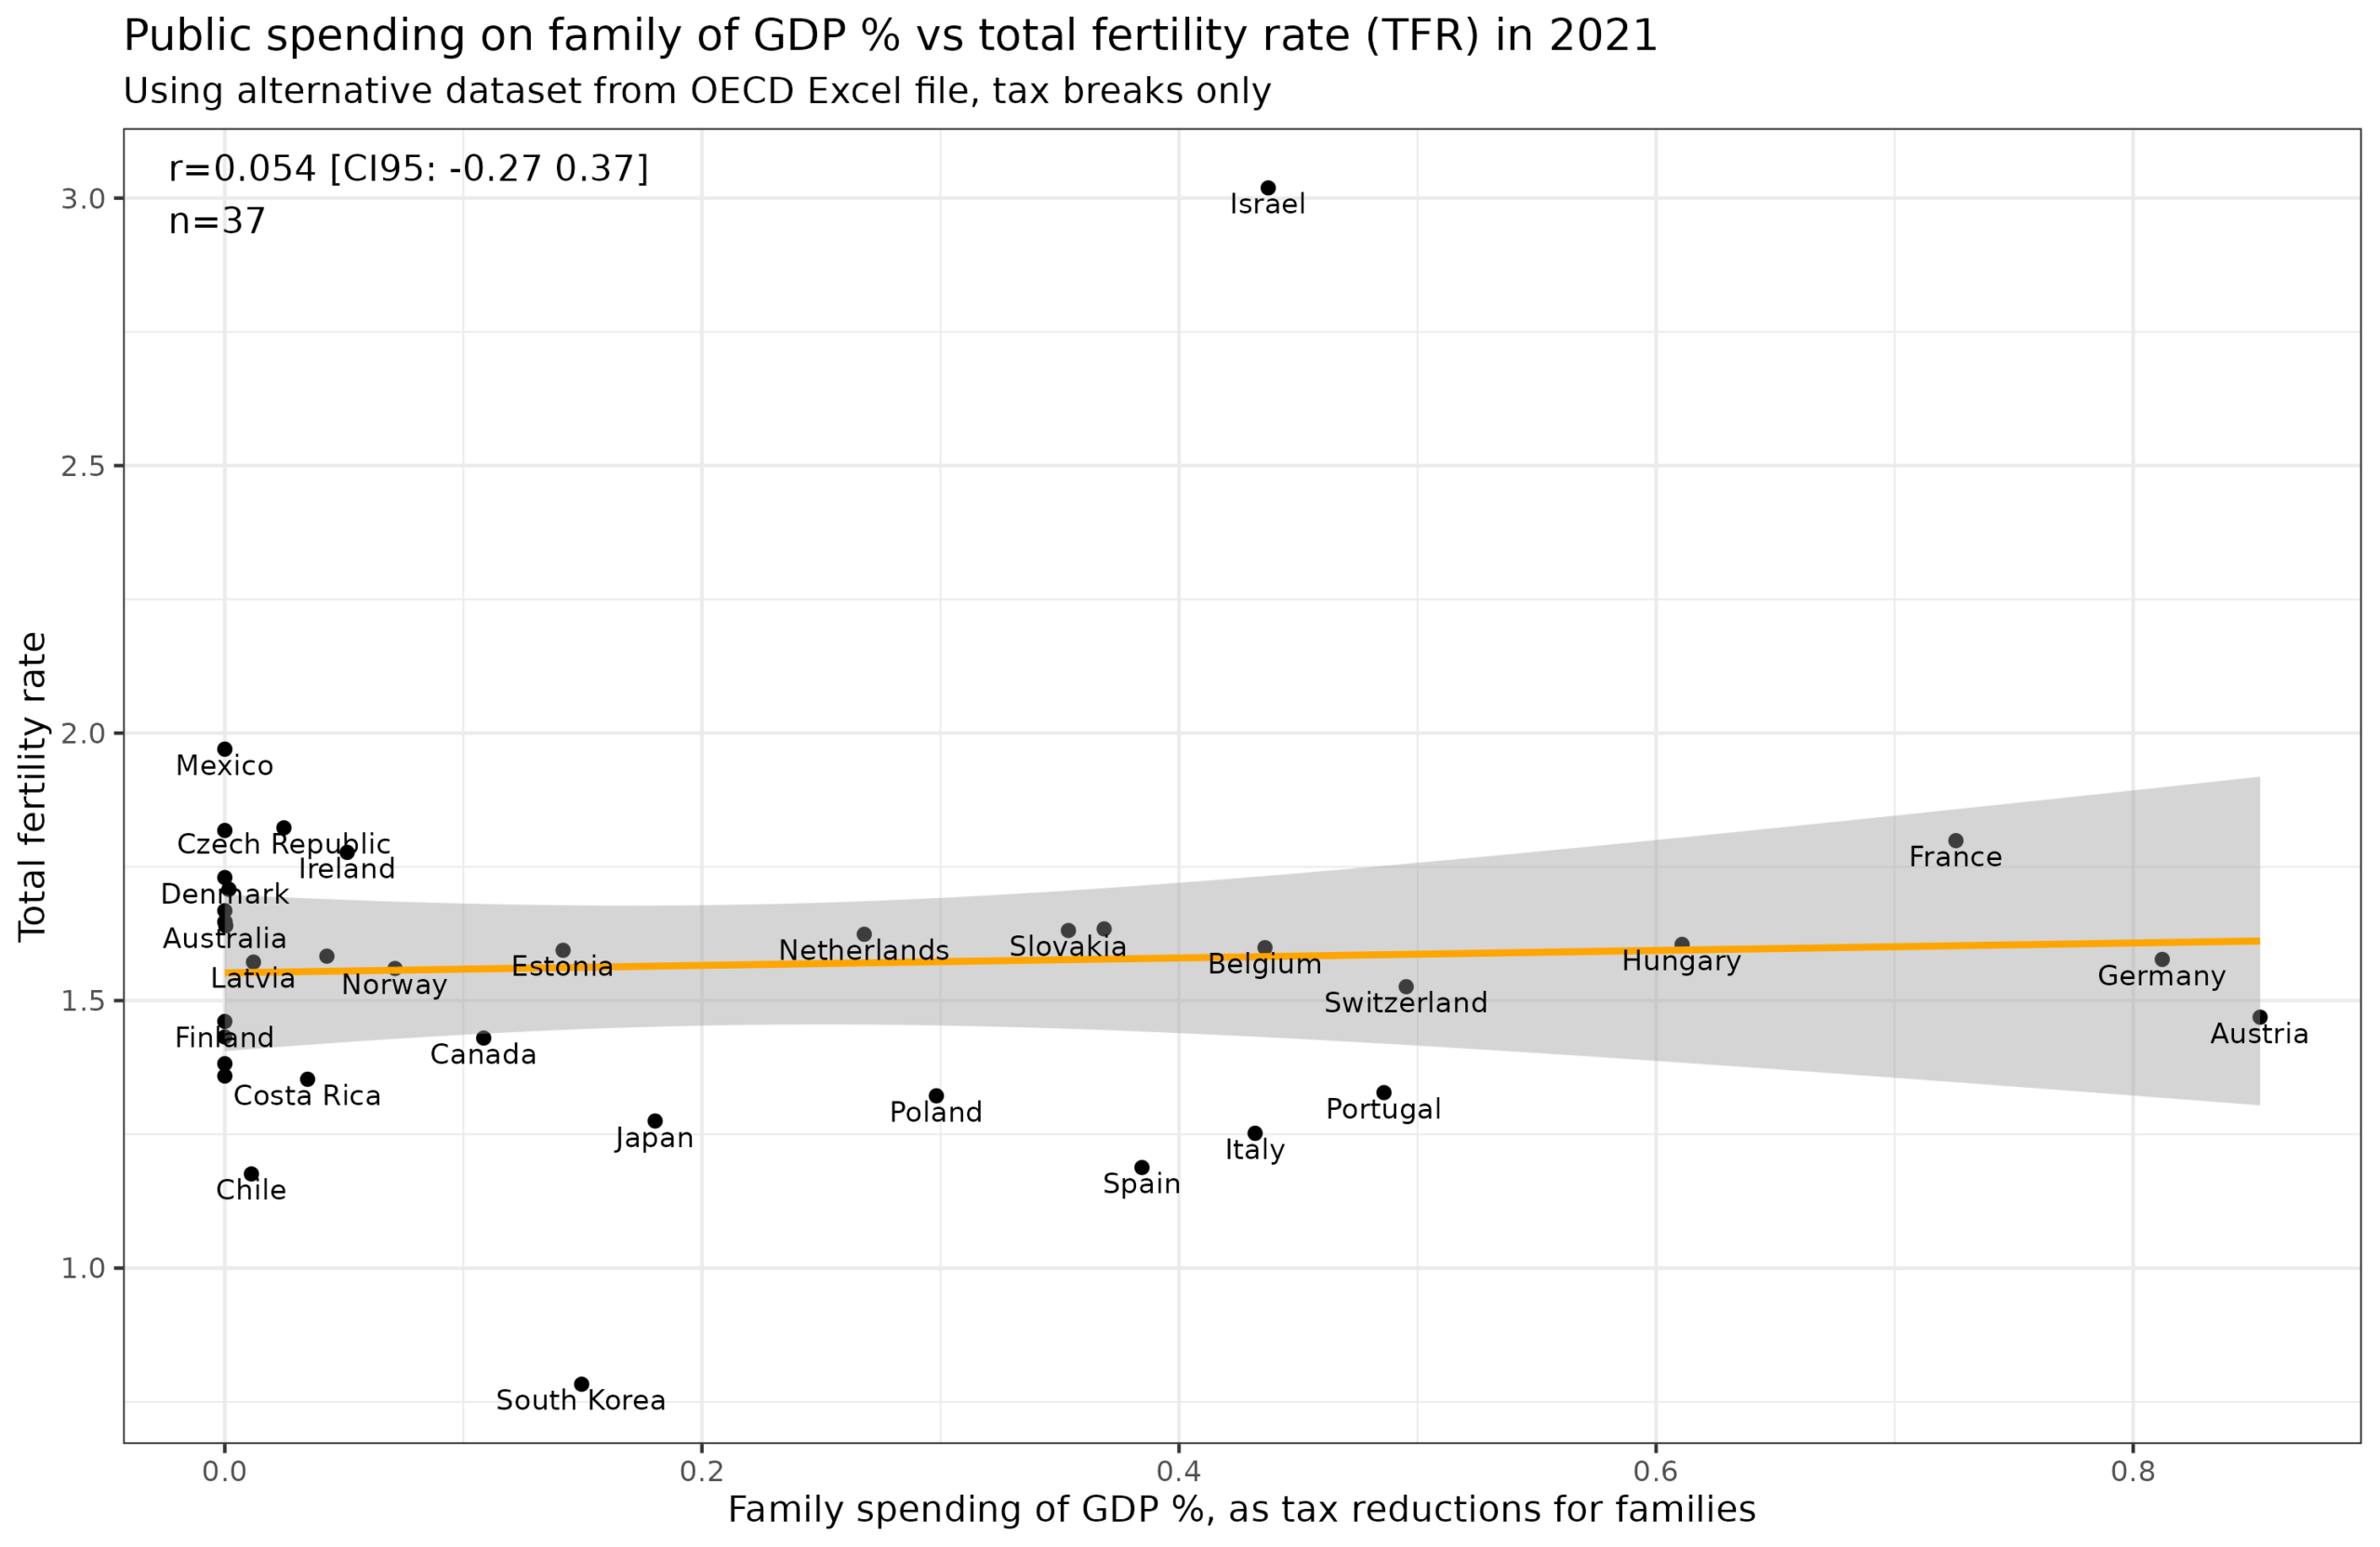
Even with all my p-hacking, p < 1e-6 is pretty good (even for a physicist). We can also confirm this result by looking only at tax breaks:
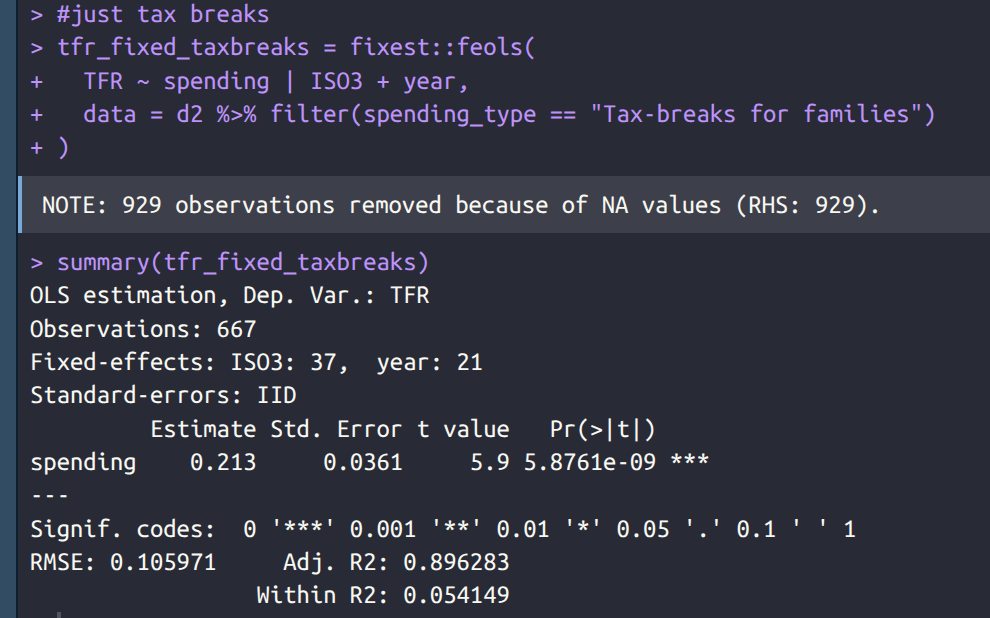
It would appear tax breaks for families are awesome. Since this is done using fixed effects for year and country, any confounding factor has to be something that changes over time as well and manages to correlate even better with fertility rates than this variable does.
Does it pass a smell test? Well, the cross-sectional data shows nothing of interest:
Digging into the original of this seemingly large effect, we can compute the slope by country over time:
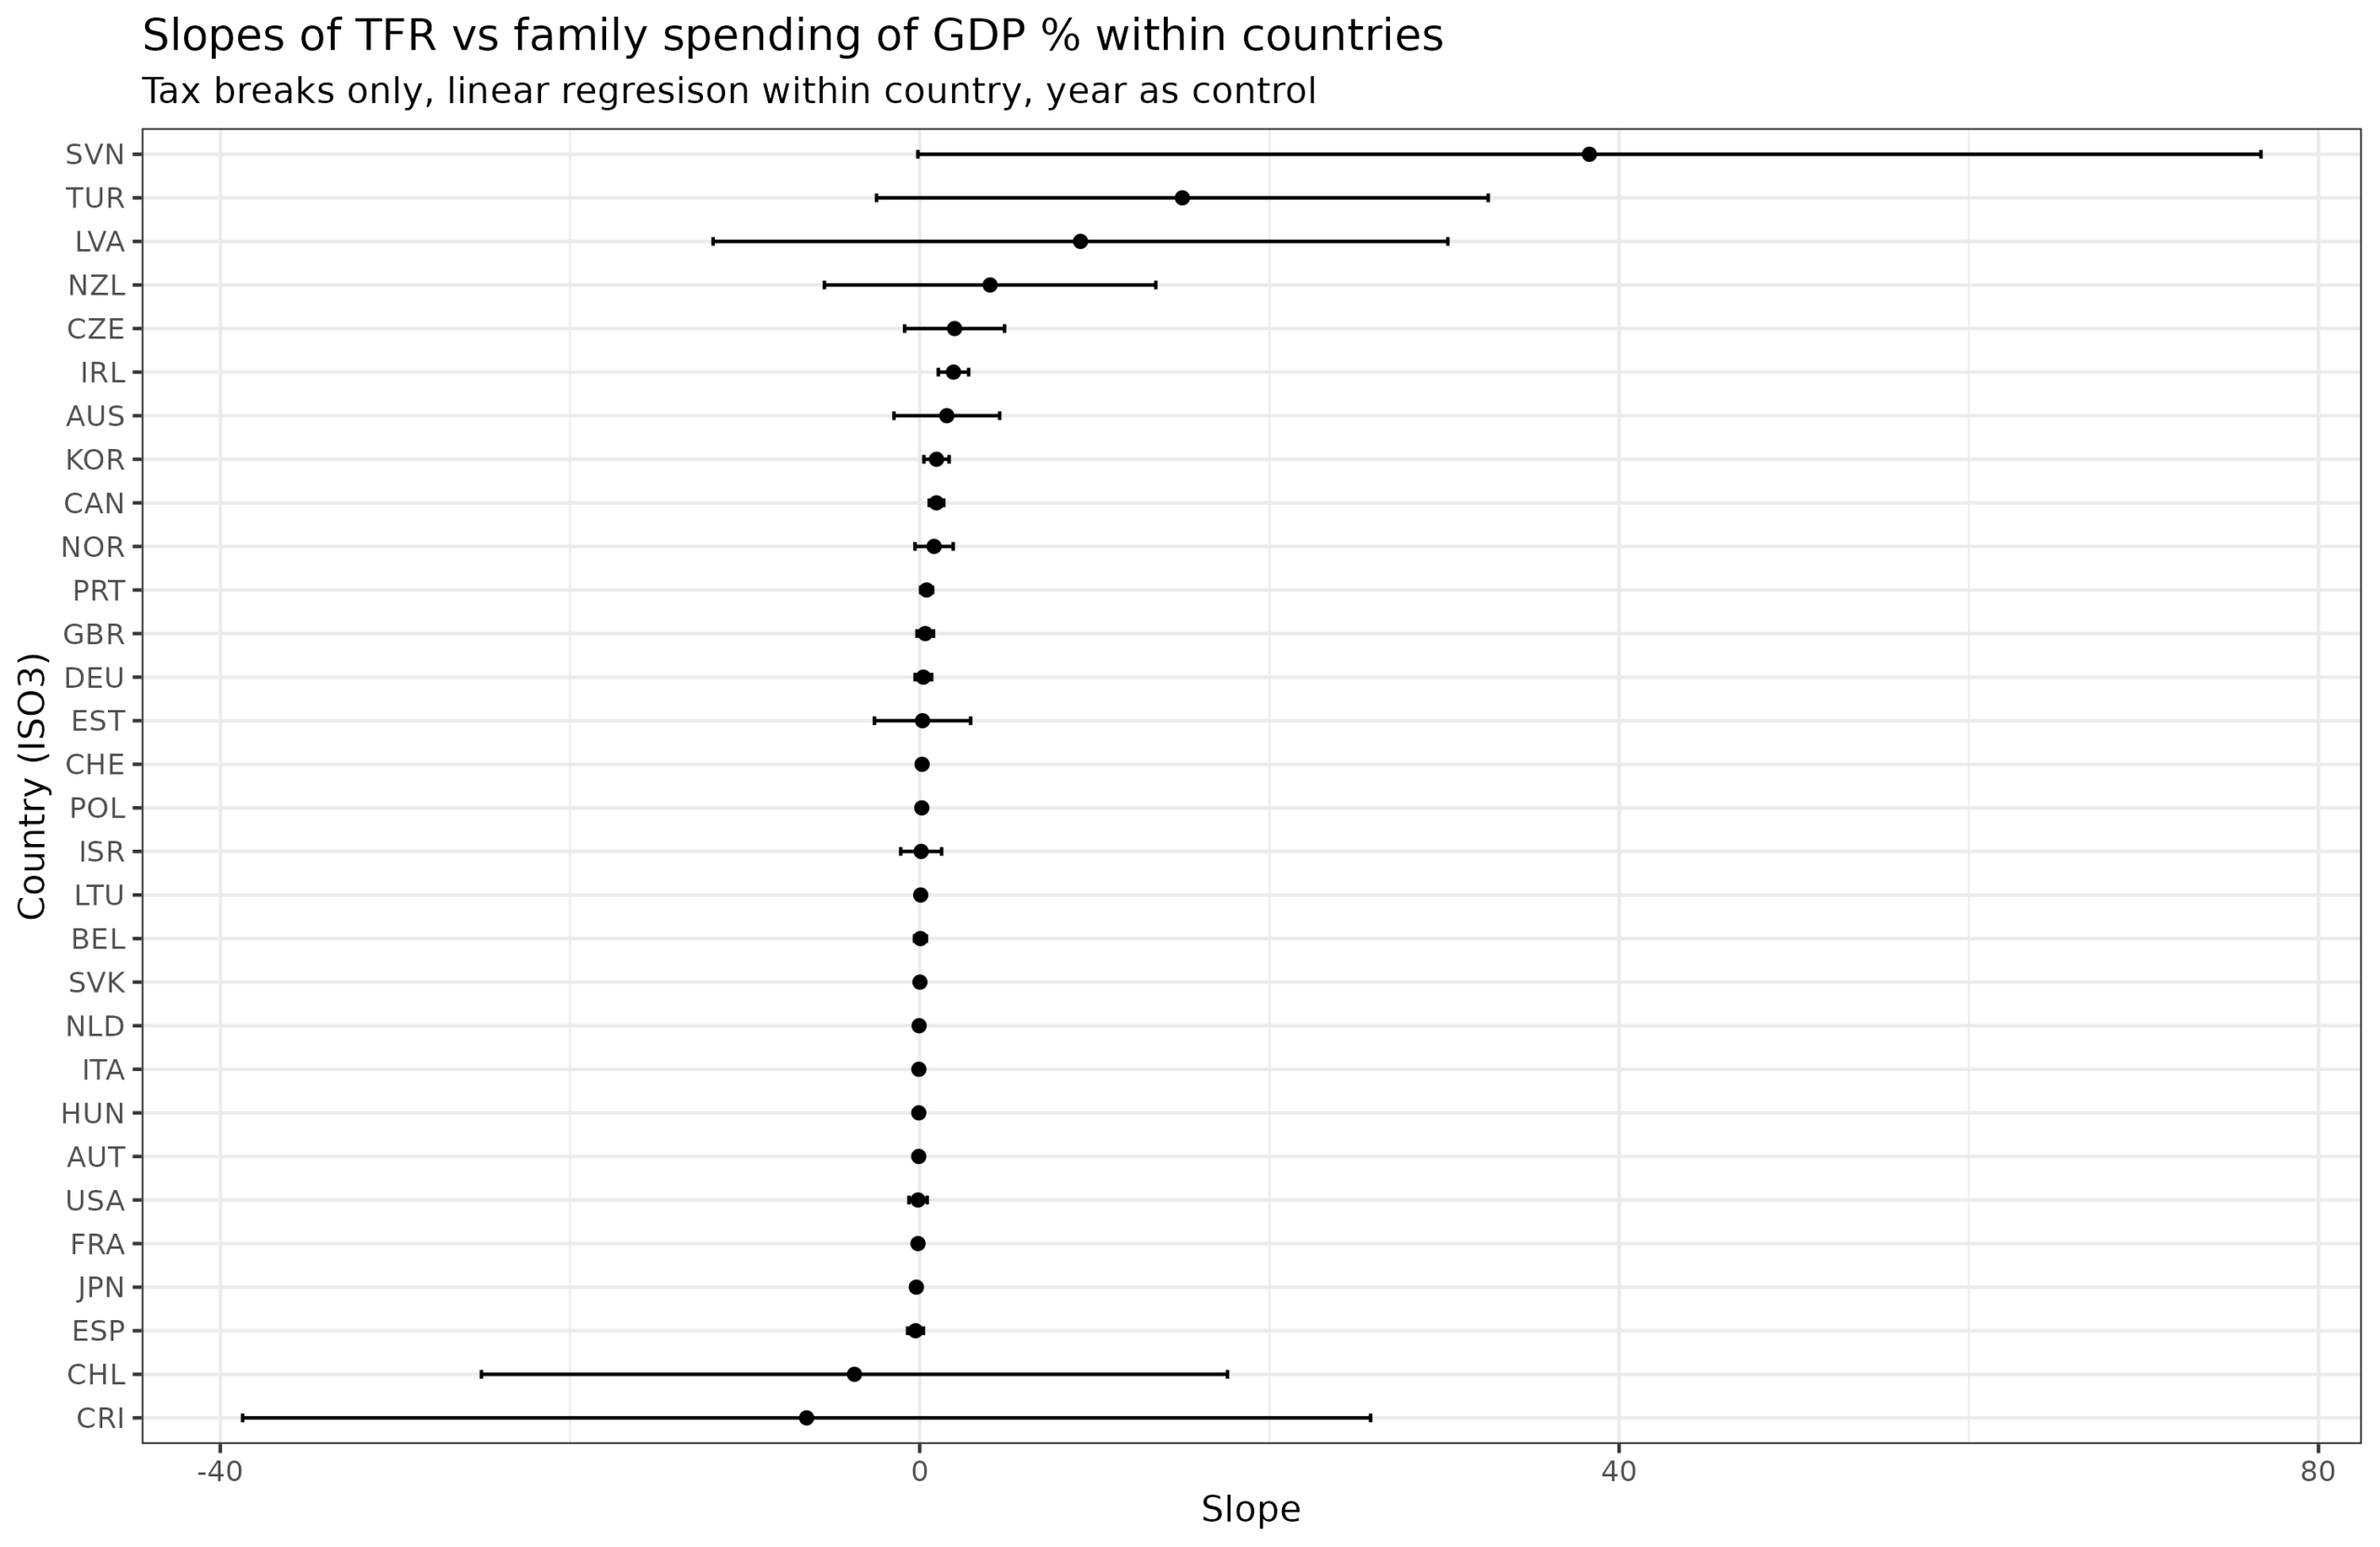
It doesn’t look very credible. Recall that before we found an effect of 0.21, and we see that this originates from complex average of these implausible values. As a matter of fact, the largest positive result is from SVN (Slovenia), which is because the data looks like this:
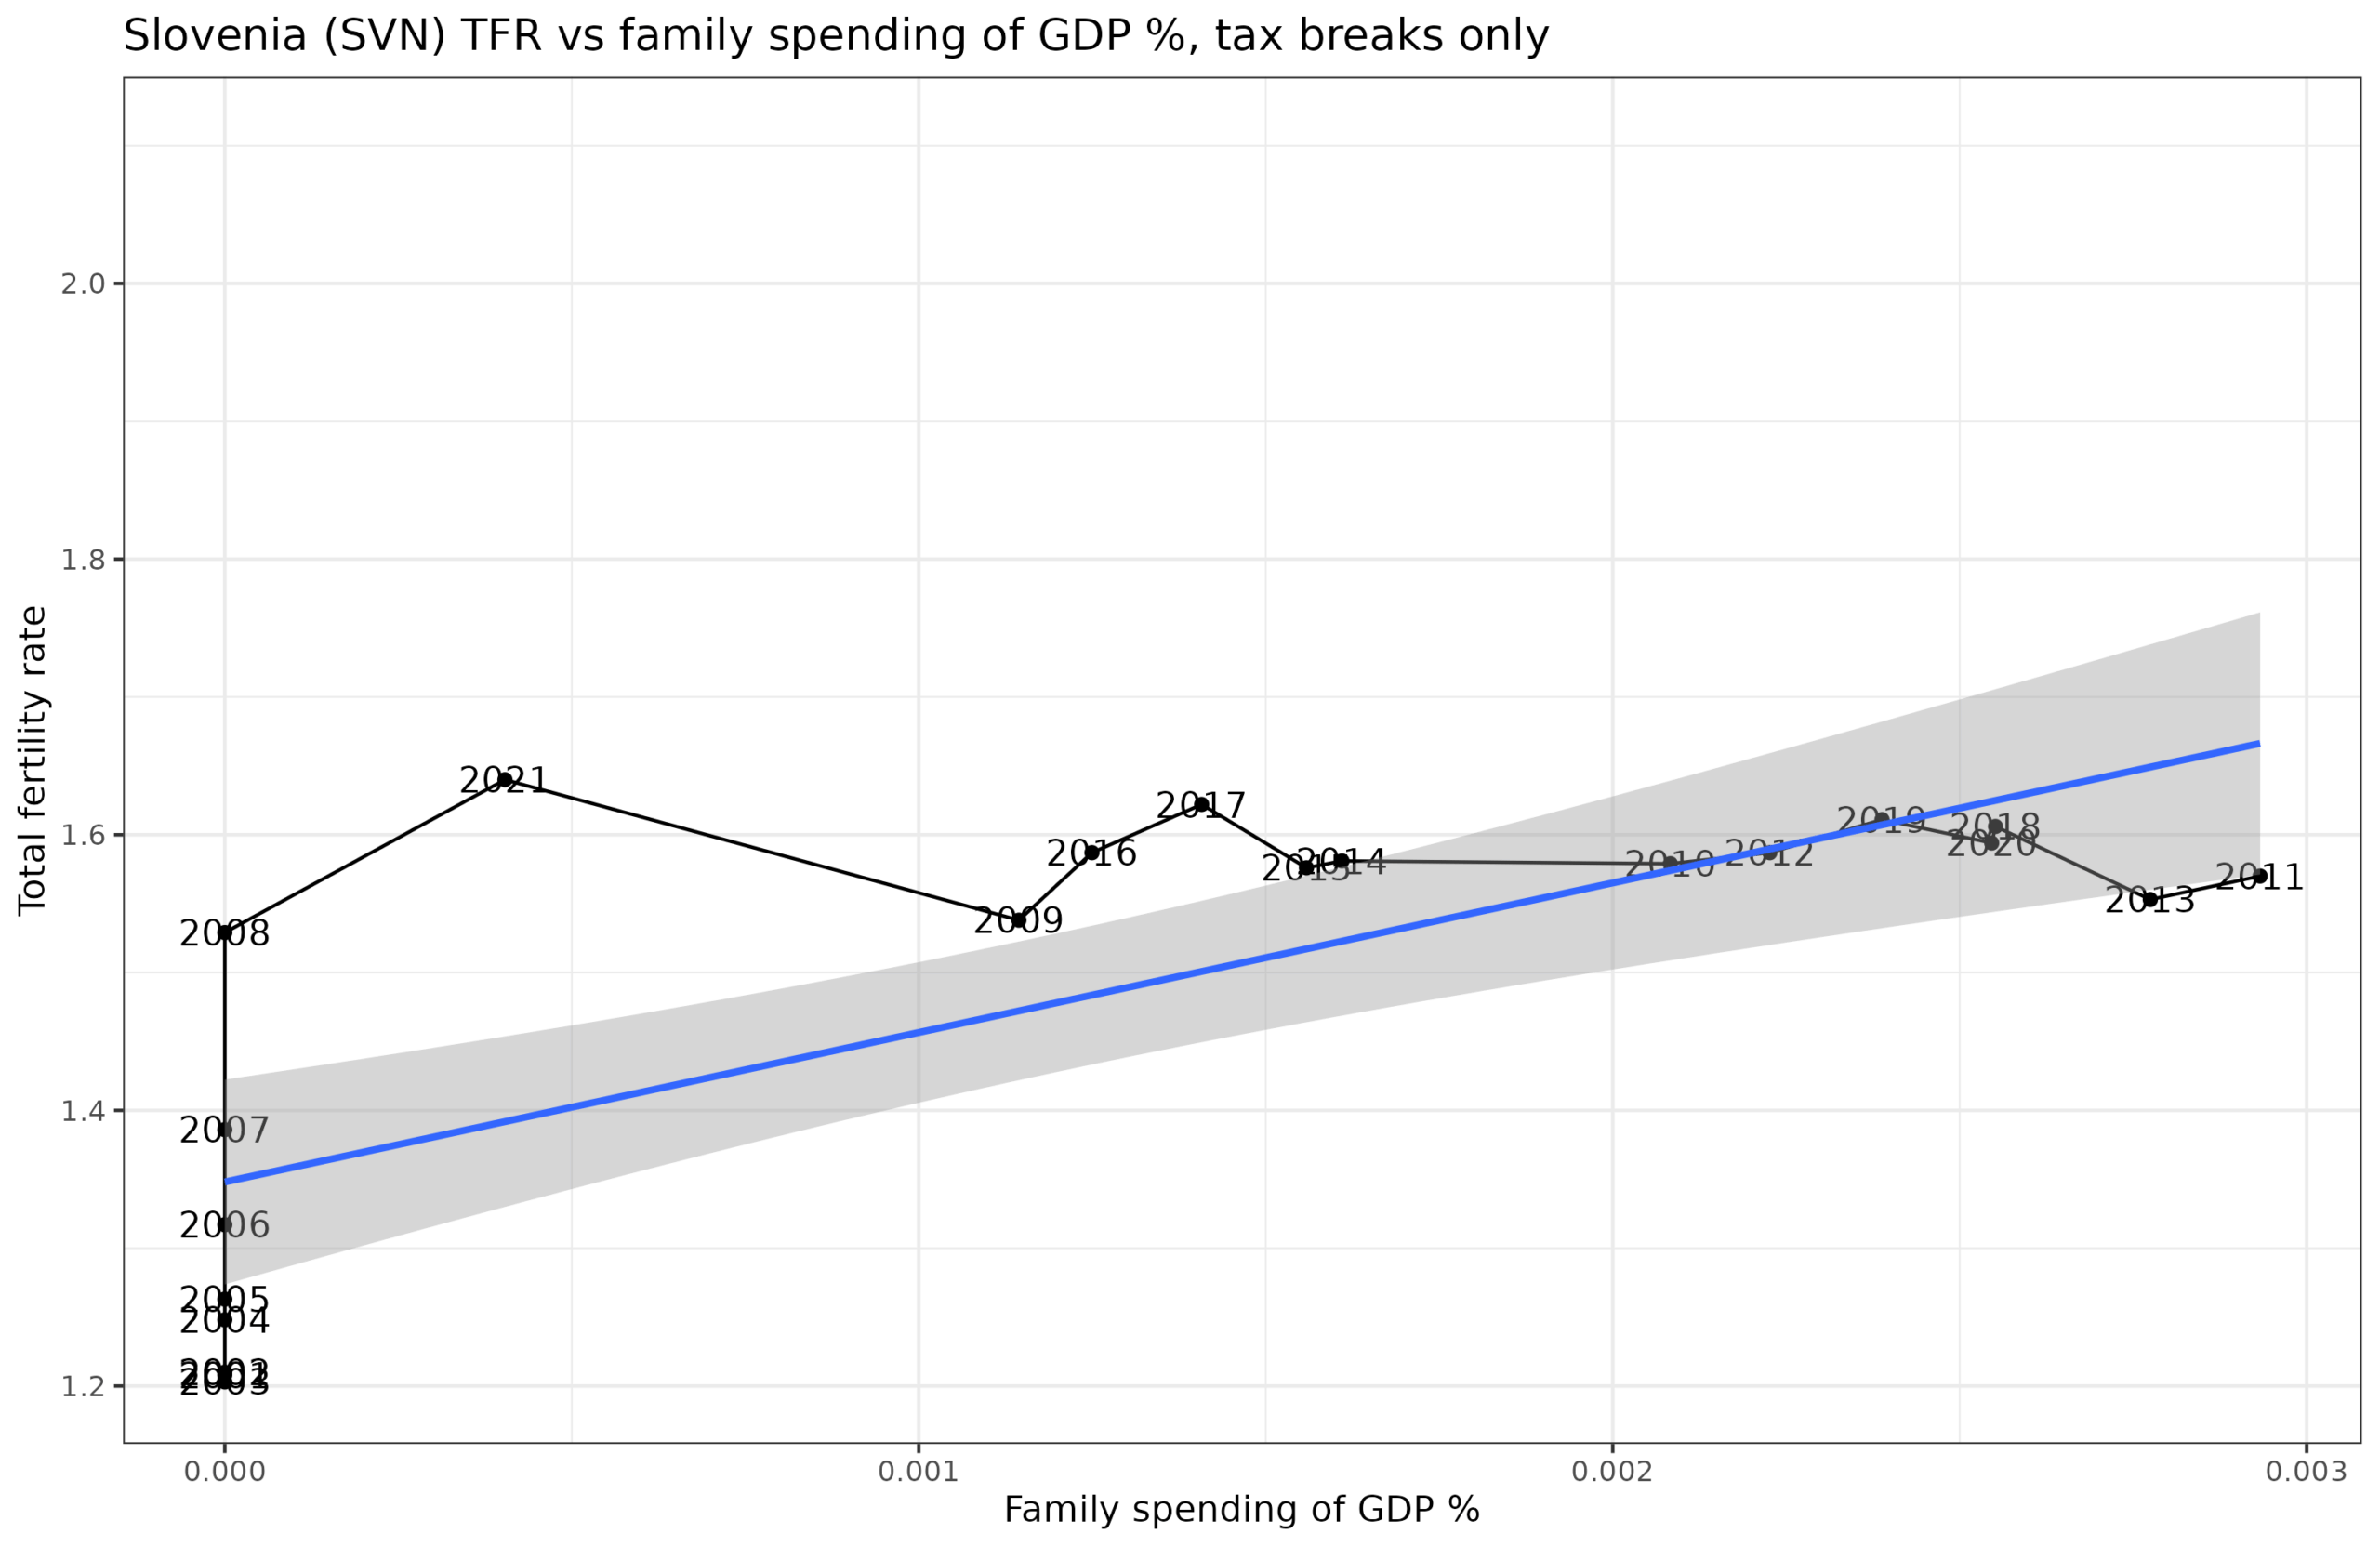
Looking at the X axis, we see that Slovenia spends ~0% on tax breaks, but the the tiny variation that exists leads to a large positive result by coincidence (beware temporal auto-correlation!). OK, so let’s try using only data from countries with at least 0.1 SD variation in tax breaks and at least 10 years of data:
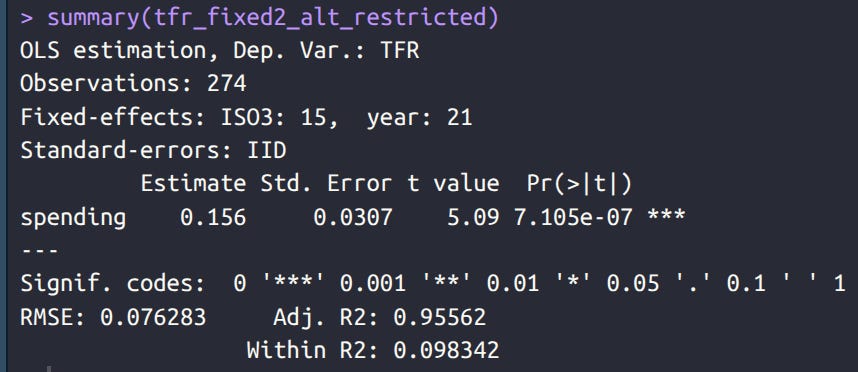
It is a bit smaller, 0.156, down from 0.213. If you carefully at the plot of models within countries, you can see that a number of countries contribute relatively precise positive estimates (Latvia, Czechia, New Zealand, Australia), while few contribute precise negative estimates.
A final idea is to look at the first differences. That is, change in fertility between two years, and changes in tax breaks the same years, or with lags and leads. A causal effect should show an effect for the current year (maybe if people are really fast) and the year before:
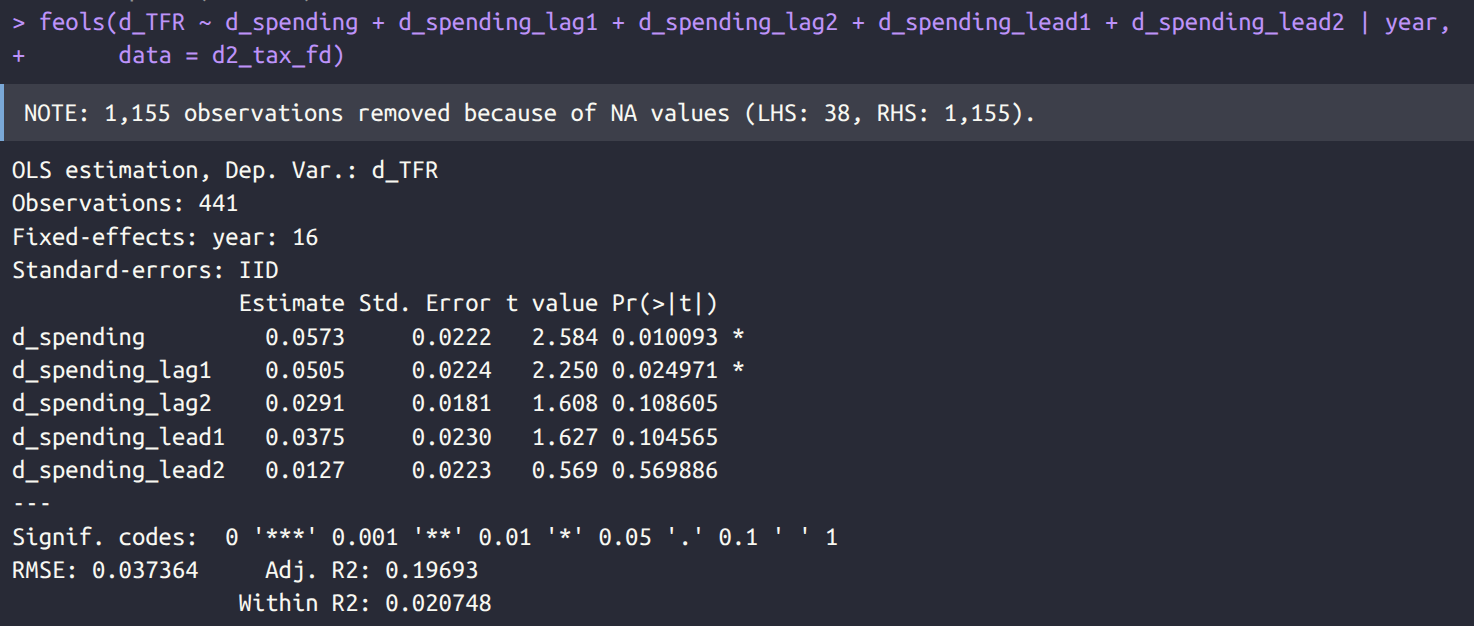
And this is also what we see, though with quite small effects now and marginal p values. However, there is not much to see if we also use country fixed effects (above only year). Year to year data are rather noisy and it’s unlikely citizens would notice small changes and adapt quickly, so I (also) don’t think first differences are a good idea here.
Since Hungary is often making the news for their fertility policies, let’s look at Hungary’s data:
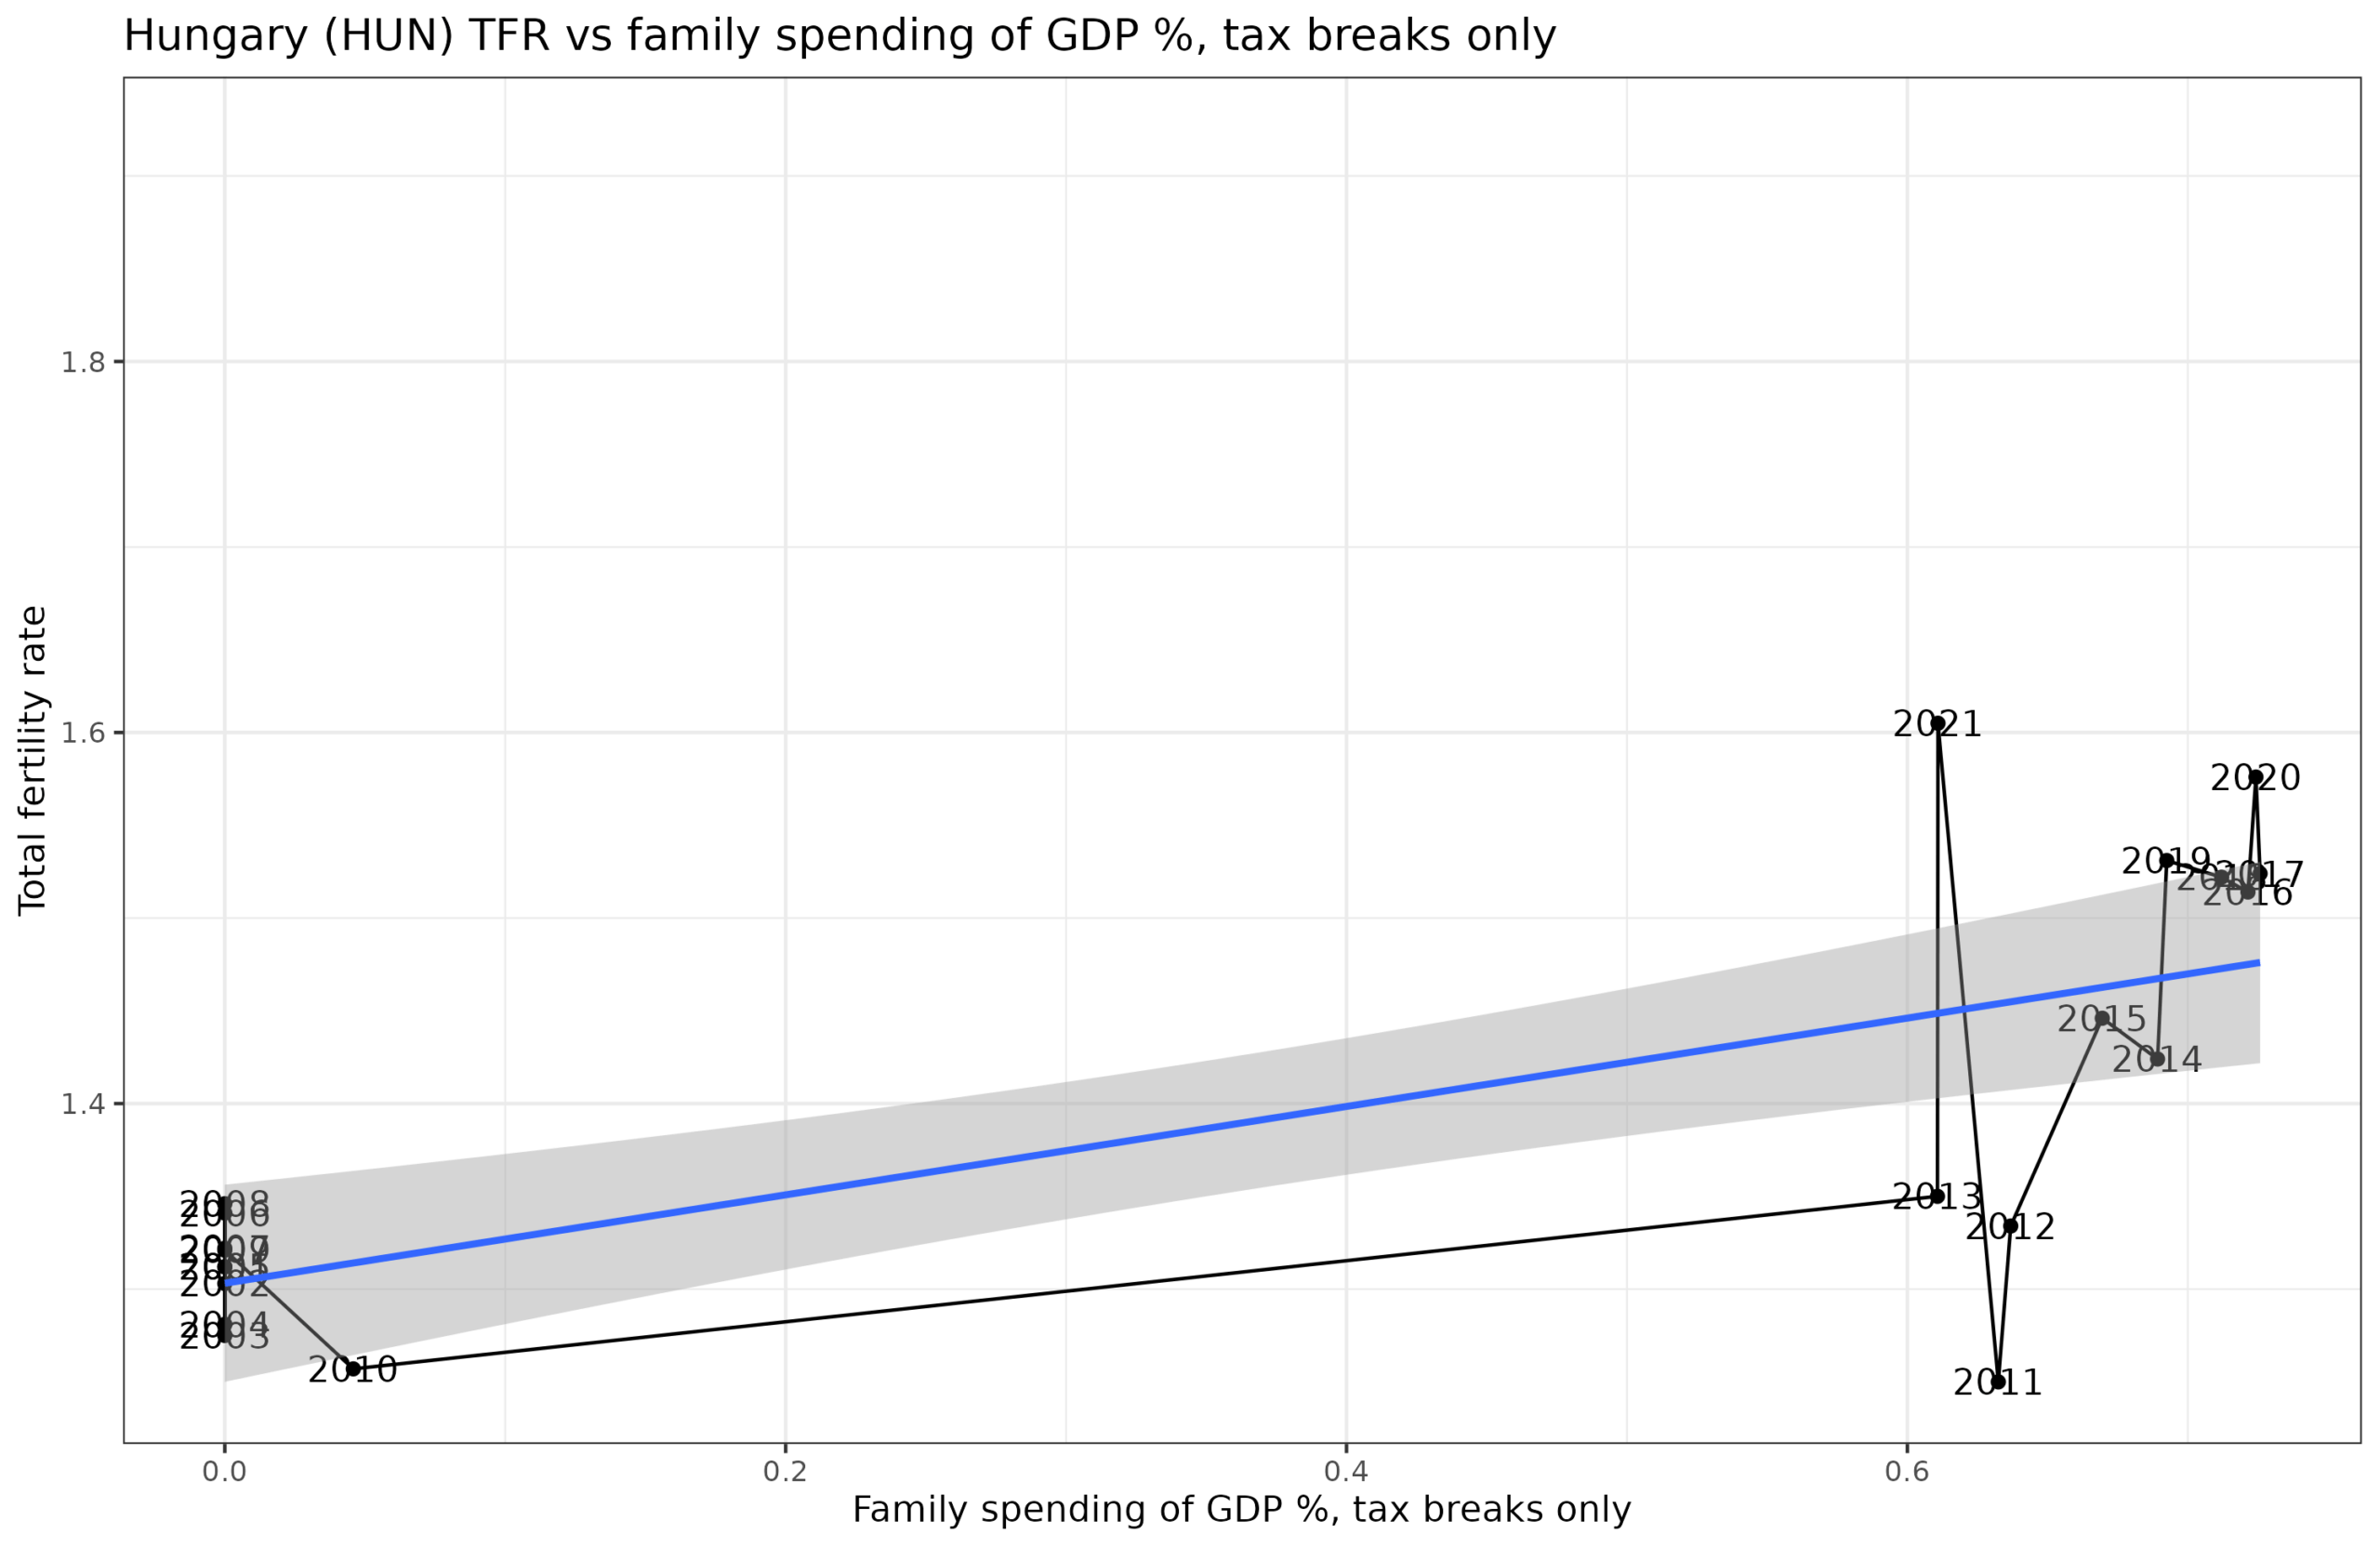
It looks OK, until you look at the full time series of Hungarian TFR:
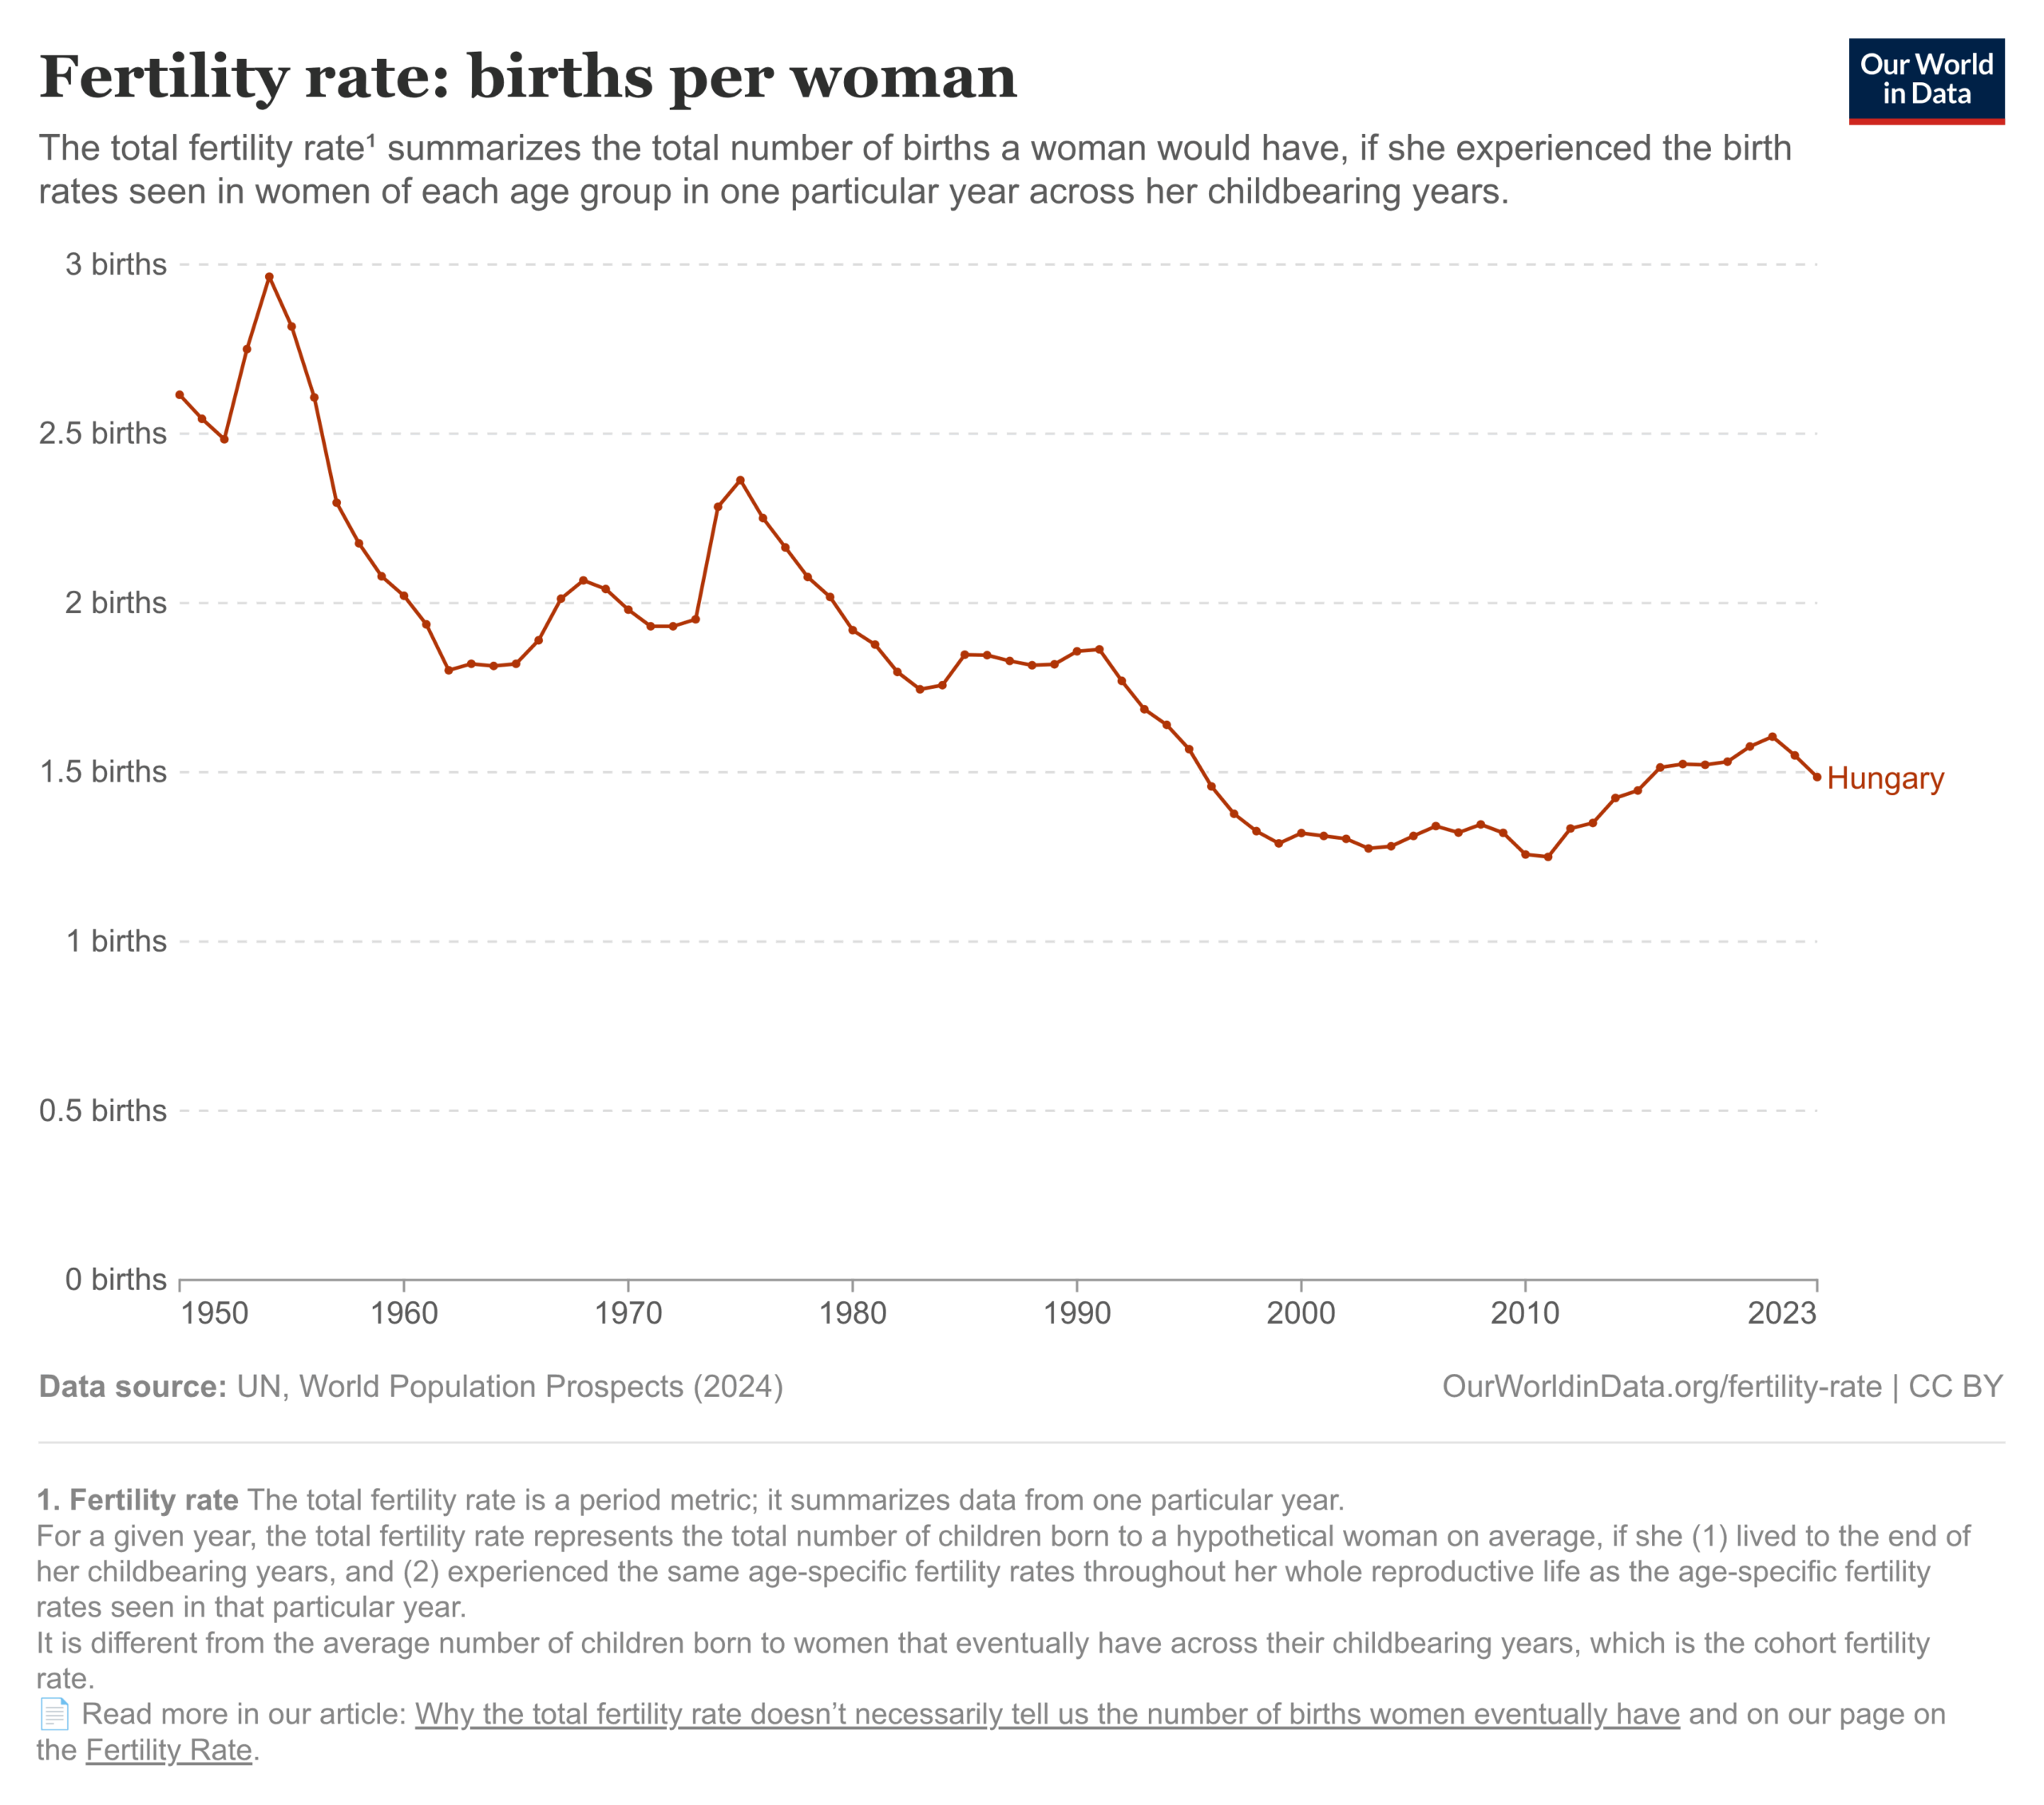
Since the OECD data only covers the period in Hungary from 2001 (tax breaks data) to 2021, it looks better than when looking at the full timeline.
I’ve run out of ideas. Someone with more experience in time series modeling can give it a go. My code output is here. You can download the data here.
Summary of findings:
Most countries are experiencing rapid fertility decline.
Some countries try to pay people ( in various ways) to have more kids.
Modeling suggests this doesn’t work in general.
Modeling gives some suspiciously low p-values for tax breaks.
But looking into the details of the results does not inspire trust in the findings because the overall small positive result is based on averaging a large number of ~0 values and some positive outliers with too large to believe effect sizes.
The data are in general a mess, but I guess some economist could write a 60 page paper dressing this stuff up as being super reliable (AER when?).
No one ever had kids because the cost-benefit analysis looked good. (Maybe some immigrant brides) In the long run, kids do not make economic sens: in fact, in the long run nothing does. But in the long run, nothing makes as much non-economic sense as kids.
Not to dissuade you from interesting quantitative research, but we are far more prosperous than ever, it's not lack of resources that prevents people from having kids. Who has the most children in Europe? Gypsies and immigrants - the poorest lot.
IMO it's almost completely cultural
https://x.com/MoreBirths/status/1944066771050188894
Most young people just do not envision themselves having children early, perhaps when they're 30, and then it's suddenly hard to find a partner or fertility problems kick in. Hedonistic individualism, feminism, overall value confusion.