
Heritability of achievement tests at age 10-14 in Norway's entire population
A tour de force in register data studies

Since discussing heritability estimates is all the rage, with Seb Jensen producing a new meta-analysis, and Scott Alexander providing a great review (which was somehow praised by both sides since Gusev wrote a favorable comment), let's talk about this other new study:
Eftedal, N. H., Eilertsen, E. M., Sunde, H. F., Kleppestø, T. H., Ystrom, E., & Czajkowski, N. O. (2025). Beyond additive genetic effects: Explaining family resemblance in school performance across millions of pairs of Norwegian relatives. Proceedings of the National Academy of Sciences, 122(25), e2419627122.
We investigate the hypothesis that family resemblance on school performance can be fully explained by additive genetic effects and assortative mating. Our sample consists of all schoolchildren who took Norwegian national standardized tests between 2007 and 2019 (N = 936,708). These tests measure aptitude in math and reading comprehension, and are taken the years children turn 10, 13, and 14 y old. We identify millions of pairs of relatives within our sample (82 different kinds, in total), including not only conventional biological relatives such as siblings and cousins, but also relatives-in-law, relatives through adoption, twins, and relatives connected through twins. When fitting models which assume that family resemblance arises solely from additive genetic effects and assortative mating, we find that they describe much of our data well, but that they systematically underestimate the similarity of close relatives (particularly monozygotic twins), maternal relatives, relatives-in-law, and relatives through adoption. We discuss potential explanations for these deviations, including shared-environmental effects, nonadditive genetic effects, and gene–environment interplay.
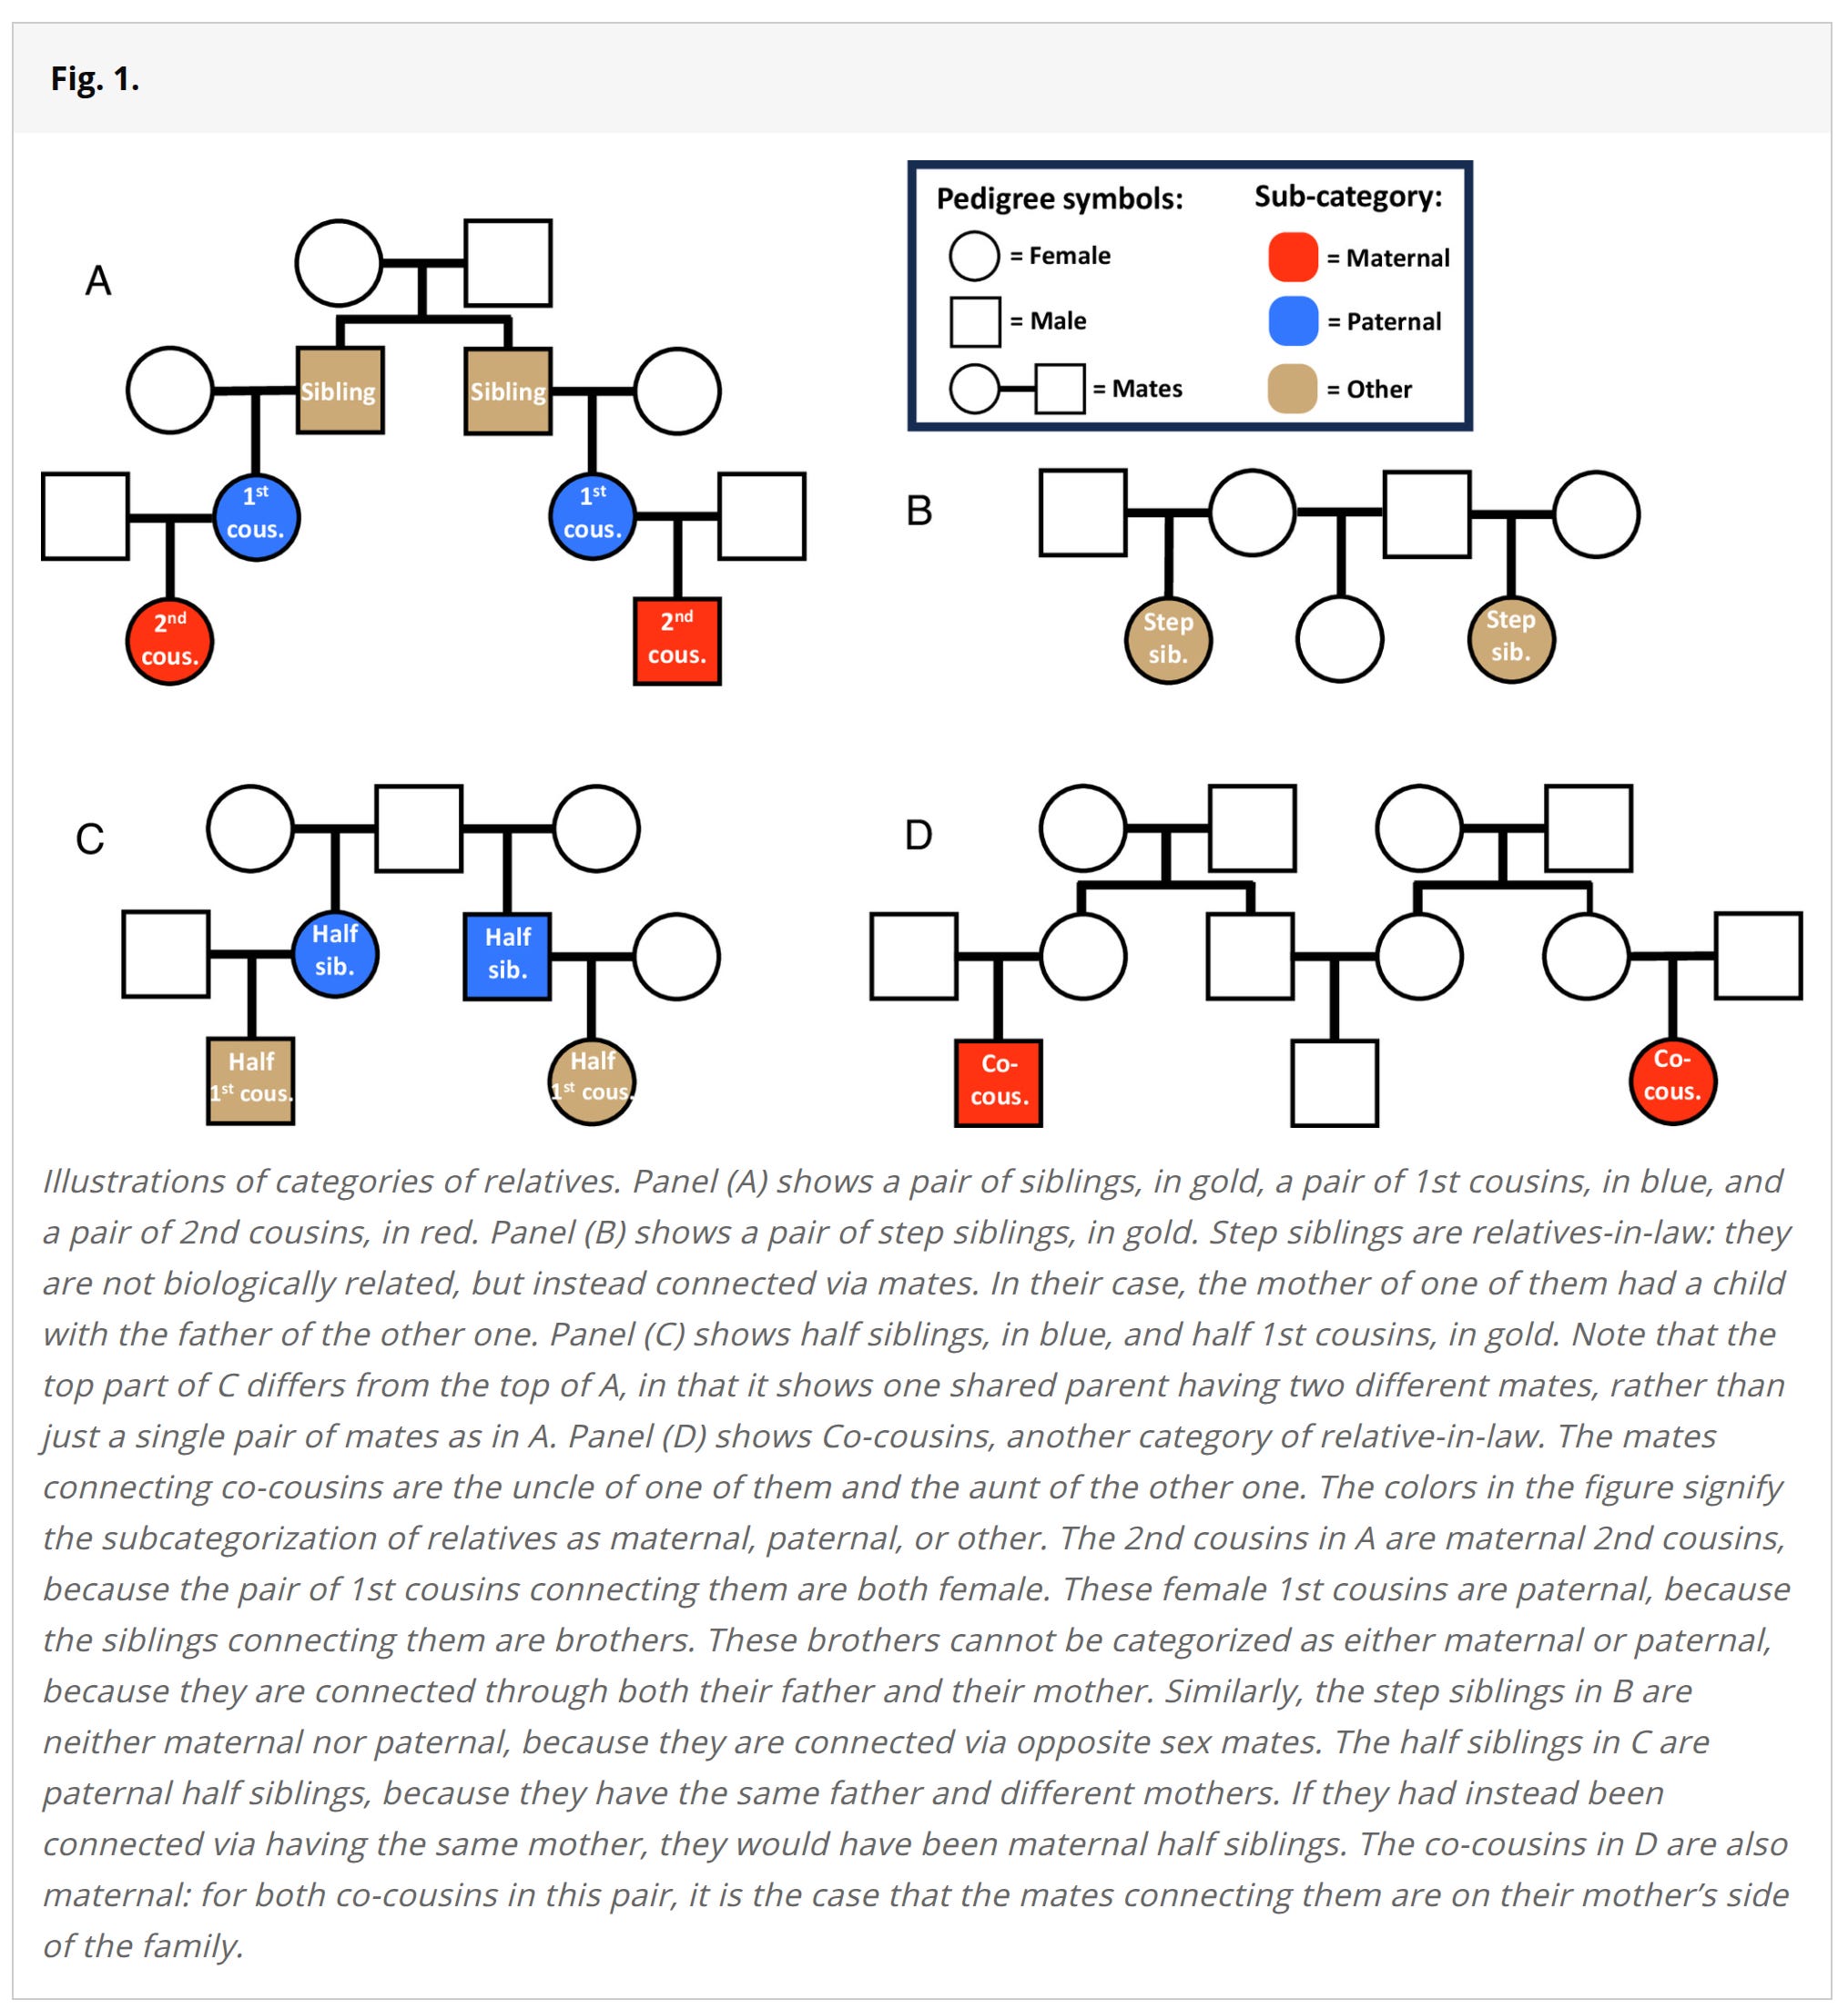
Using the awesome Norwegian register database of all persons living in Norway, it is possible to study just about any kind of family relationship. Traditionally, family studies have used just a few kinds of relationships:
Adoptive children and their adoptive or biological parents or siblings (any mix).
Monozygotic and dizygotic twins raised in the same families (MZT-DZT).
Some rare cases of monozygotic twins reared apart (MZA).
Using various assumptions that differ between these designs, one can estimate some parameters of a full relationship model. A full model would include various kinds of different causal paths. On the environment side we have among others: siblings affecting each other's traits, parents affecting their children, children affecting their parents, special twin-only effects, cousins affecting each other, in-laws. On the genetic side we have the total heritability, which can be separated into additive heritability, non-additive heritability (dominance/nonlinear or heterozygote advantage), and any gene-gene interactions. Finally, there is the murky, somewhat philosophical question of how best to categorize gene-environment correlations and interactions. Usually distinctions are made between:
Active correlation: you create your own environment to some extent
Reactive: others modify your environment in response to you, e.g. strict parenting for unruly children
Passive: smarter parents give their children better genes for intelligence but also a more enriching environment with books and other stimulation.
Given the usually employed methods above, most of these potential causal paths cannot be estimated, at least not in the same study. However, they can be estimated if one has 82 types of family relationships as in the new Norwegian study. A key parameter (m) is the degree of genetic assortative mating for a given trait (phenotype to be more precise). The authors discuss the recent Clarkian findings:
There has long been controversy around the importance of genetic effects in explaining this family resemblance, with opinions ranging from the view that genes are the main reason relatives have similar socioeconomic outcomes, to the view that they play hardly any role. An important contribution to this debate was recently made by Clark (8), who studied an English genealogical database of 422,374 people going back to the 17th century. He reported correlations on socioeconomic outcomes for a wide range of relatives, going out as far as 4th cousins, on outcomes such as occupational status, higher education status, literacy, and dwelling value. To these correlations, Clark fitted models based on theory from Fisher (10), in which only genes can explain similarity between relatives, and found that they could explain his set of correlations almost perfectly, with values of R2 above 0.95. Importantly, these models, which we will refer to as “Fisherian,” account for the effects of assortative mating: the tendency for people to have children with others who are similar to themselves. With random mating, the expected genotypic similarity between relatives rapidly diminishes with increasing genealogical distance, going from 1/2 for siblings, to 1/8 for 1st cousins, and further on to 1/32 for 2nd cousins, meaning that they are about as genotypically similar as random pairings of people, and that they will be predicted to be phenotypically uncorrelated as well, no matter how high the heritability is. But, as Fisher showed, when there is assortative mating, these expected correlations of genetic propensities can start off higher for siblings and drop off less steeply. For distant relatives, they can then be many times higher than under random mating. And the phenotypic correlations reported by Clark were indeed so high that his models estimated genotypic mate correlations at 0.57 to be able to account for them.
Using data from "everyone who took national tests between 2007 and 2019 (N = 936,708). As the tests are taken by more than 95% of children going through the Norwegian school system, our sample is largely free from sampling biases.", they can calculate all sorts of correlations. Some examples:
They have test scores for multiple subjects, which they duly report the intercorrelations of in their appendix:
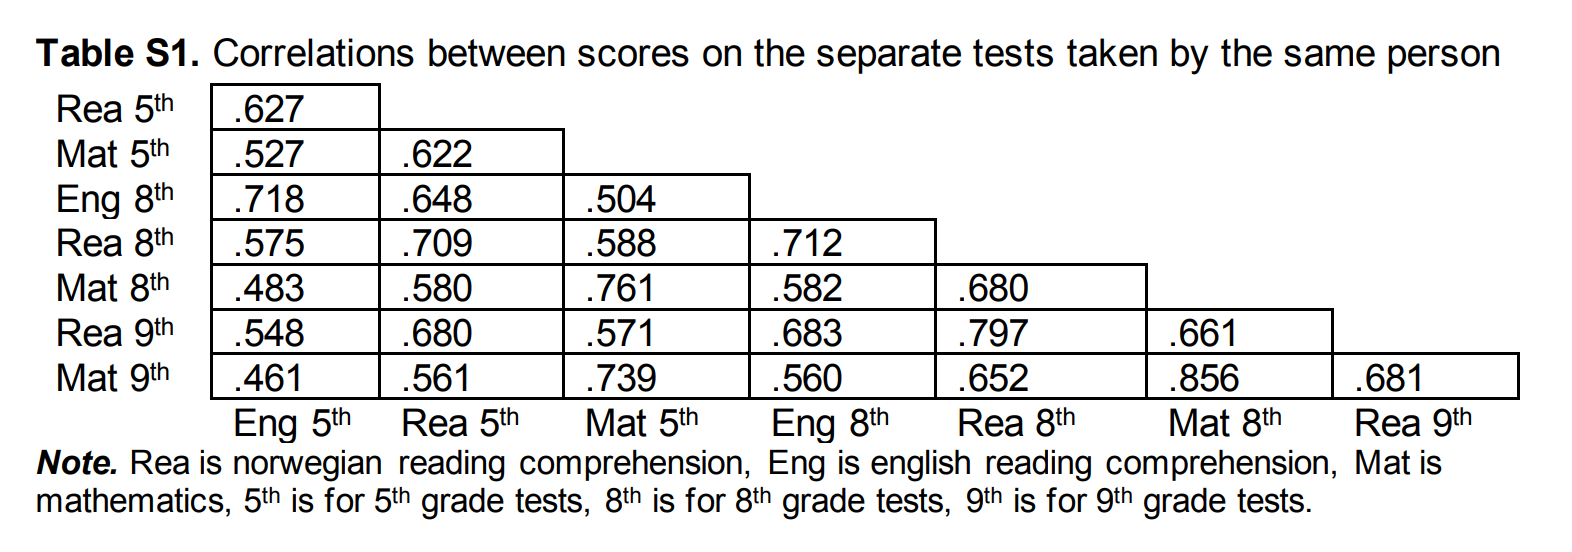
For their main results, they only used the average of the 8th grade (I guess age 13) scores, that is, from English, Norwegian, and Math. Thus, the tests have somewhat of a verbal tilt. Strangely, they don't adjust for reliability or even mention it as an issue. However, given the factor scores are a composite of variables with correlations of 0.582, 0.680, and 0.712, the composite should have a reliability of about 0.852 (Cronbach's alpha). This is pretty good, but not perfect. The correction factor needed for each correlation is then given by the Spearman correction equation, sqrt(0.852*0.852)=1.174. Their figure 2 provides the uncorrected correlations by family type:
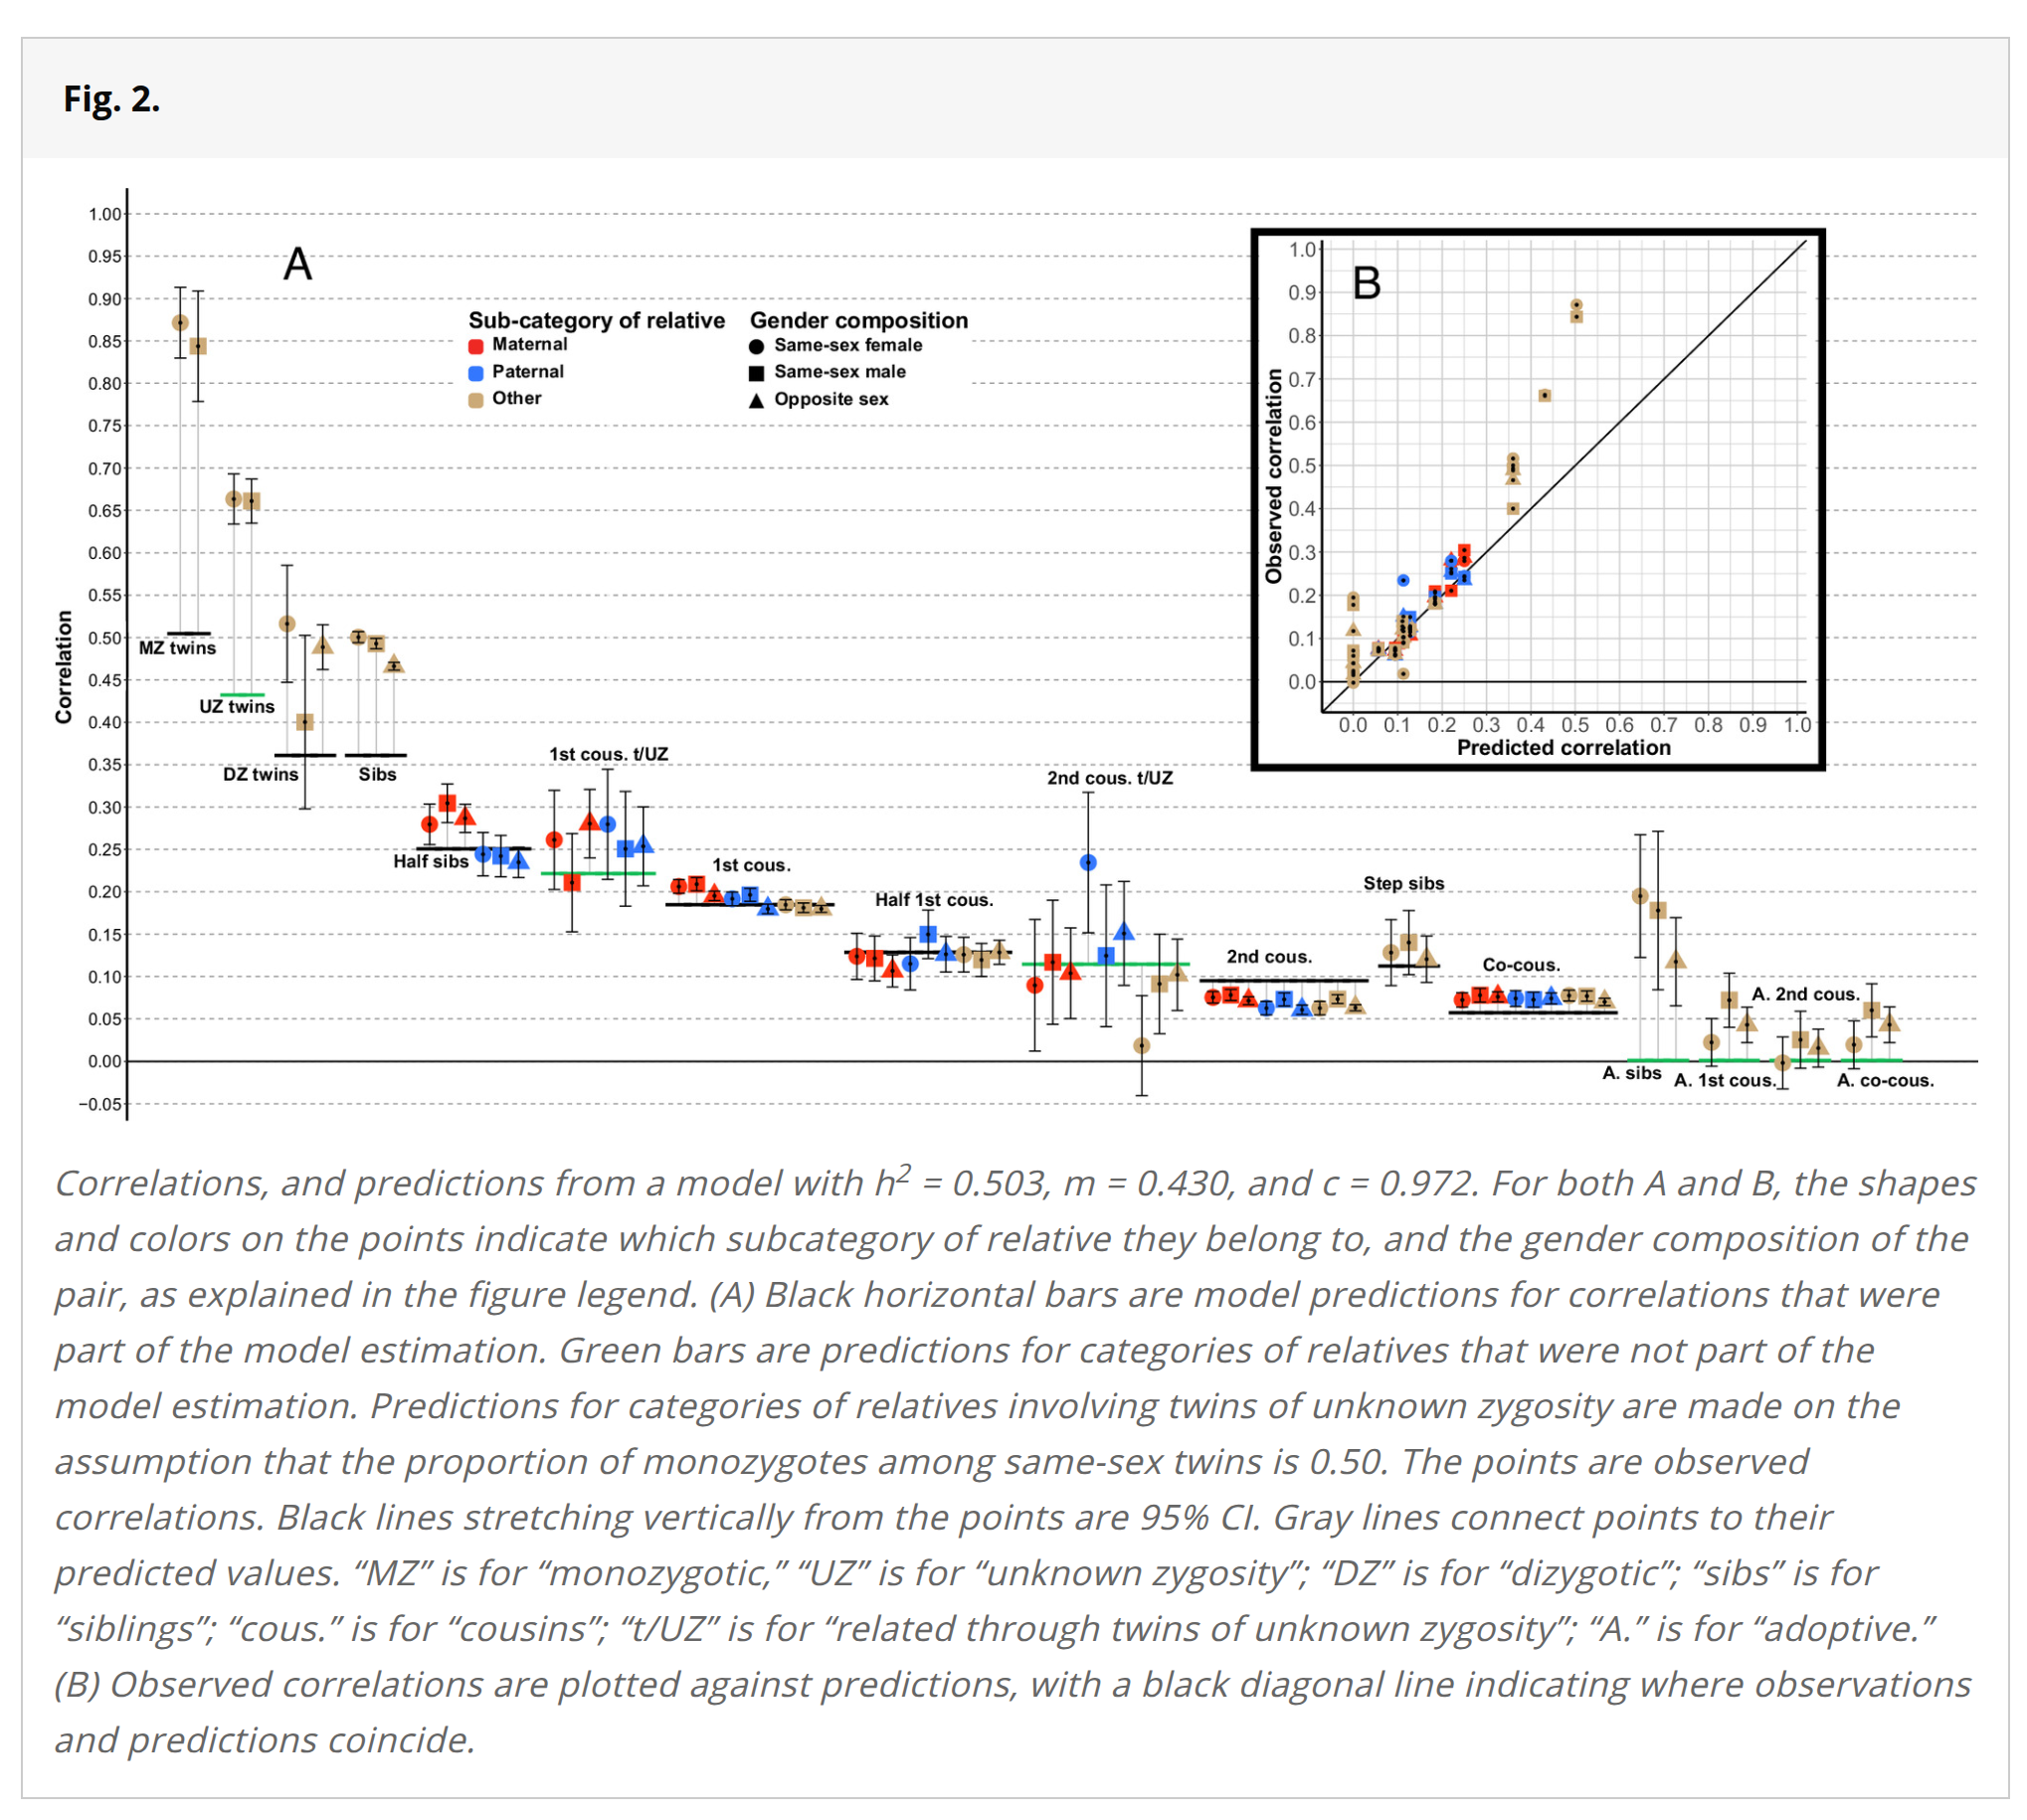
They also provide the numerical values in a table, which I have reproduced here along with the reliability adjusted values for those who want to fit their own models. As a matter of fact, the MZs correlate at 1.01 when adjusted for reliability. In the purely genetic (Fisherian) model, this means a heritability of 100%, or using the classic twin design, unshared environment = 0%. So probably Cronbach's alpha underestimated the reliability of the composite score here. (There is a Norwegian language master's thesis analyzing some data for the tests, finding a reliability of .89 for the reading test and a correlation of .61 with Raven's (n=109). Assuming that Raven's has a g-loading of .70, the g-loading of the reading test should be around .89.) Though it should be noted that some prior studies have also found that MZs correlate almost as much as is possible given the reliability of tests.
Another worry was that the tests may show 'grade' inflation over time, but their methods section notes that:
The tests in math and Norwegian reading have time limits of 90 min, while the English test has a limit of 60 min. They all consist of ~40 questions each. New tests are developed for each year, with comprehensive work using item response theory going into ensuring that results are comparable from year to year, and that the tests are sensitive to individual differences across the entire range of ability (15).
My next worry was that the adoptives will mostly be foreigners, especially from poor countries. If there are some tendencies in some families to adopt Africans vs. Indians vs. Koreans, this will perhaps bias the correlations a bit, maybe up or down. I didn't find any information about this in the study. They also don't discuss the general issue of selective placement. Given that all of their adoptive relation correlations are positive, we might suspect some of this bias in addition to true environmental effects.
For comparison purposes, the provide the full estimates along with the classical twin design ones in the appendix as well:
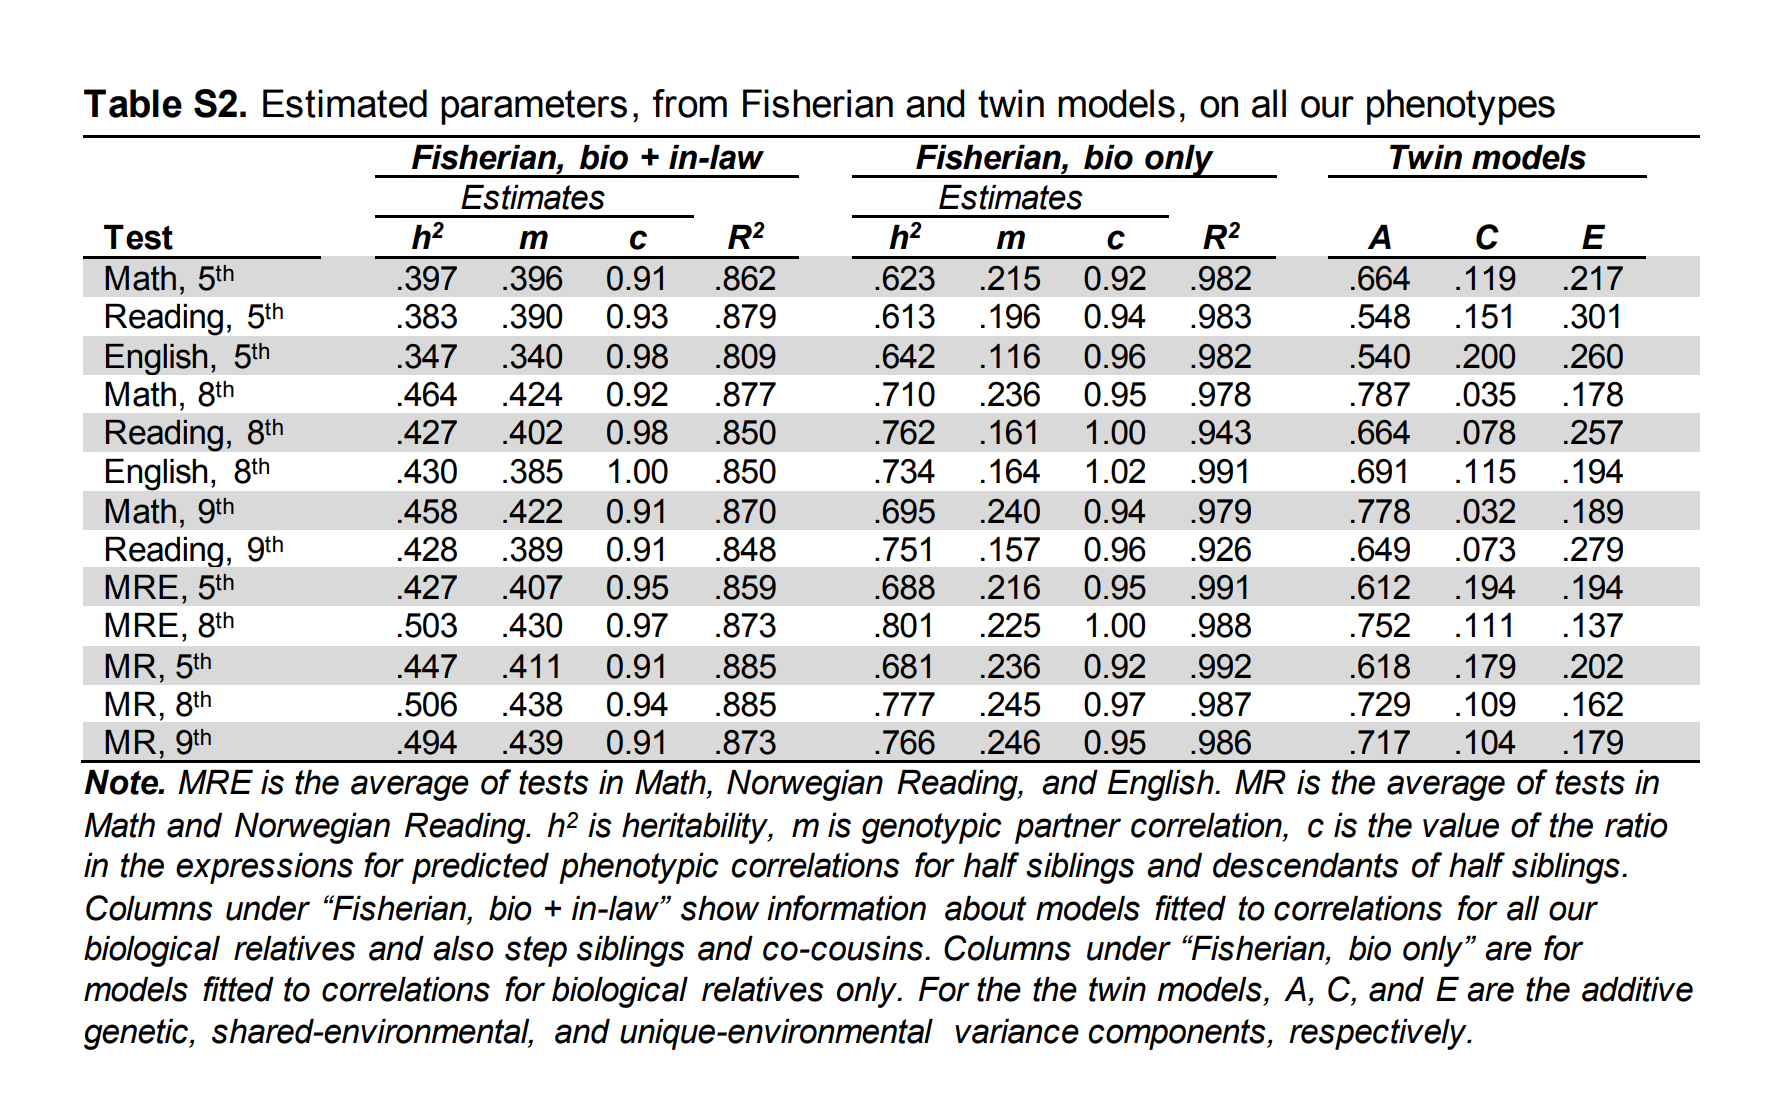
Here we can note that the Wilson effect -- the increase of heritability with age -- is replicated as the older samples show stronger heritabilities. Beware that their 9th grade composite is only based on 2 tests, not 3 as are the 5th and 8th grade. For this reason, it is not surprising that the heritabilities are slightly higher for the 8th grade based on the more reliable composite score.
The results in the above table suggest heritabilities of 50%, 80%, and 75% depending on what method you prefer. Based on the model fit and also shown in the figure above, the in-laws correlations do not fit the Fisherian-Clarkian model well:
When excluding relatives-in-law from the model, R2 increases from 0.873 up to 0.988. Parameter estimates also change dramatically, with h2 increasing to 0.801, and m decreasing to 0.225. These values of h2 and m produce poor predictions for relatives-in-law: For step siblings, predicted correlations are about half as high as those we observe, and for co-cousins they are about a third as high (all predictions from this model are also included in Table 1). Excluding all twin correlations, on the other hand, only minimally affects parameter estimates and R2 (all changes <0.01), due to the small proportion of twin pairs in our sample (<1%).
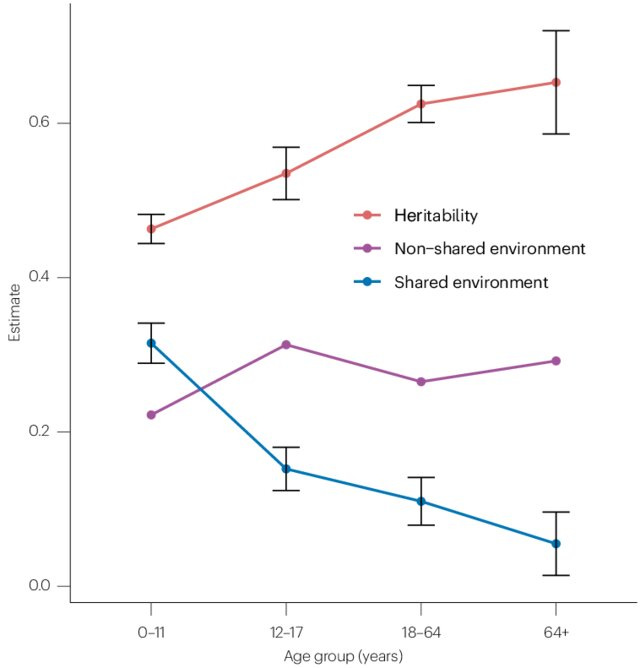
To be fair to Clark, he was analyzing adult data for social status indicators, and these are data for 13 year olds taking school tests. For this age group, we expect some shared environment to remain (see also Inquisitive Bird's review):
For some reason, they did not calculate parent-child and parent-parent correlations. While the tests were taken in their teens, presumably some of these people have become parents already, so we should at least be able to get the phenotypic parent-parent correlation (the observed assortative mating correlation).
For some reason, the authors chose not to try to fit complex models that also include environmental factors, choosing instead to publish all the correlations and let others deal with the model fitting competition. This is great of course (sadly, such intermediate results are usually hidden, presumably because academics are afraid of getting scooped). They should in fact do a many teams analysis of the same data. We can perform a few other simple model inferences using their data:
Sibling vs. adoptive siblings: 0.48 vs. 0.15. Assuming no selective placement, C = 15%, and ½A = (0.48-0.15)=33%, so A = 66%, and E = 19%.
Step siblings: 0.13, this should be ½A*m*½A (cf. plot above), so if we assume e.g. A = 65%, C = 15%, parent-child should be about ½A+C=0.47, thus, 0.475²*m=0.13, solve m, m = 0.58. This is not too far from the usual Clark results.
Maternal vs. paternal half-siblings: 0.29 vs. 0.24. While some of this can be due to false paternity, the rate of this is usually estimated to be around 2% in modern Western countries, so should not have a large effect here (not to be discounted entirely given that we are already talking about families with half-siblings, and also 0.98² = c. 4% chance of being unrelated). Most of the difference between maternal and paternal correlations is probably due to true shared environment effect with mothers having a greater impact on school outcomes for this age group because their half-sibling children tend to grow up together, whereas the paternal ones don't. For instance, if you think mothers are twice as important, we get these equations: MHS = 0.29 = 1/4A+1.32C, and PHS = 0.24 = 1/4A+0.66C, solve A, C: A = 76%, C = 8%. The math here isn't exactly right, but something along these lines.
They have cousins where the linked parents are same-sex twins. Since they don't know if these are MZ or DZ, usually the estimate is made they are about 50-50 (for same-sex, because 67% twins are DZs, but only 50% of those are same-sex), giving a genetic relatedness of 0.75 (plus any assortative mating boost). Because of this, these special twin-cousins (children of twins design) are related about the same as half-siblings: 0.50*0.75*0.50=0.19. Their correlation is in fact 0.26, about the same as half-siblings, which suggests assortative mating or cousin-shared-environment effects.
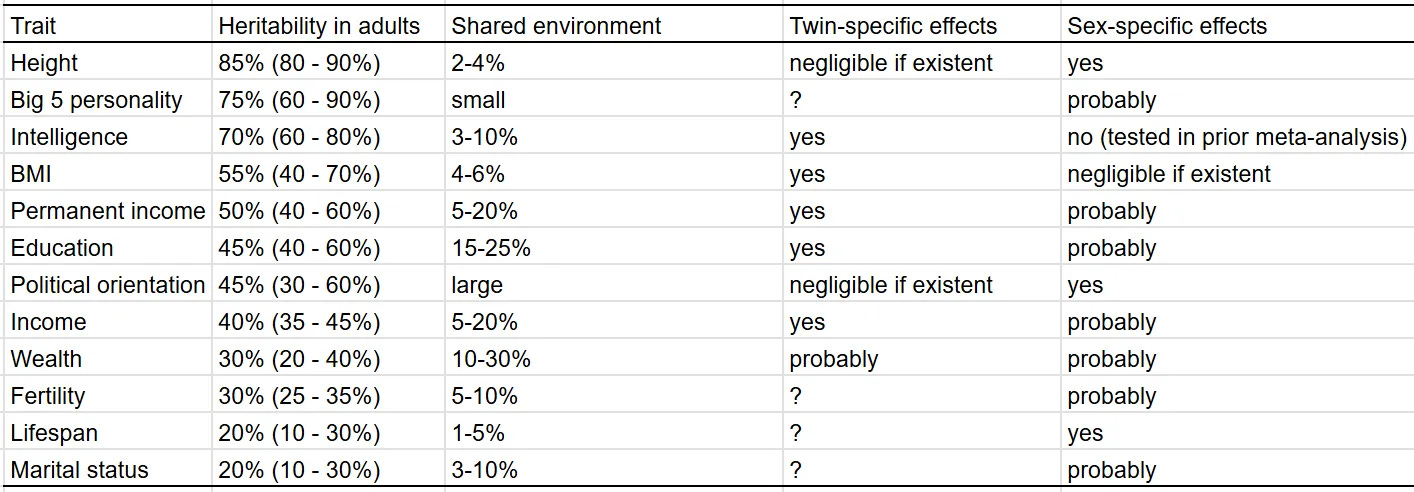
Once they start genotyping the entire populations in the Nordic countries, it will be possible to do very large-scale RDR method (see Scott's review) studies and get potentially very nice estimates. Denmark already has genotyped some 140k people in our iPsych database. What is clear from this massive study, however, is that Gusev's estimates of heritability are nowhere near reality. For good measure, here are Seb's new estimates:
> Since they don't know if these are MZ or DZ, usually the estimate is made they are about 50-50 (for same-sex, because 67% twins are DZs, but only 50% of those are same-sex)
In Europeans, hopefully? I understood that the rate of MZ twins was more or less constant cross-racially, but the rate of DZ twins is not.
Hey, kicker guard I have a question.I know you've written studies in the past about mental health.But I found a recent study claiming that the disparity between conservatism liberals disappears.When you account for things like mood is this true https://sites.tufts.edu/cooperativeelectionstudy/2024/04/09/do-conservatives-really-have-better-mental-health-perhaps-not/