
How bad is low level lead poisoning? Probably not that bad
Worry about something else

For some months, I've had a window open with some lead poisoning studies by economists. We know generally not to trust economist work without carefully checking out their tables and data (like the recent case with Lisa Cook's fantastic black patent results) as these people are known to cheat like crazy. BUT that said, the prior is not the posterior, and some economics work is solid. So let's have a look. I was sent these two studies by Twitter people, so they are my starting point. If you know of some better evidence, send it along!
Grönqvist, H., Nilsson, J. P., & Robling, P. O. (2017). Early lead exposure and outcomes in adulthood (No. 2017: 4). Working Paper.
We exploit the phase-out of leaded gasoline to isolate the impact of early childhood lead exposure on outcomes in adulthood. By combining administrative data on school performance, high school graduation, crime, earnings, and cognitive and non-cognitive skills with a novel measure of lead exposure, we follow 800,000 children from birth into adulthood. We find that reduced lead exposure improves the adult outcomes, particularly among boys. Below certain thresholds, the relationship becomes much weaker. Non-cognitive traits (externalizing behavior, conscientiousness, and neuroticism) follow a similar non-linear dose-response pattern and seem to be the key mediators between early lead exposure and adult outcomes.
There is a lot to like about this study: 1) huge and representative sample size because of the use of Swedish register data, 2) good quality measures of intelligence and 'non-cognitive skills' (surely a bizarre term) from the Swedish draft examination, 3) good and varied follow-up data. So let's dive in!
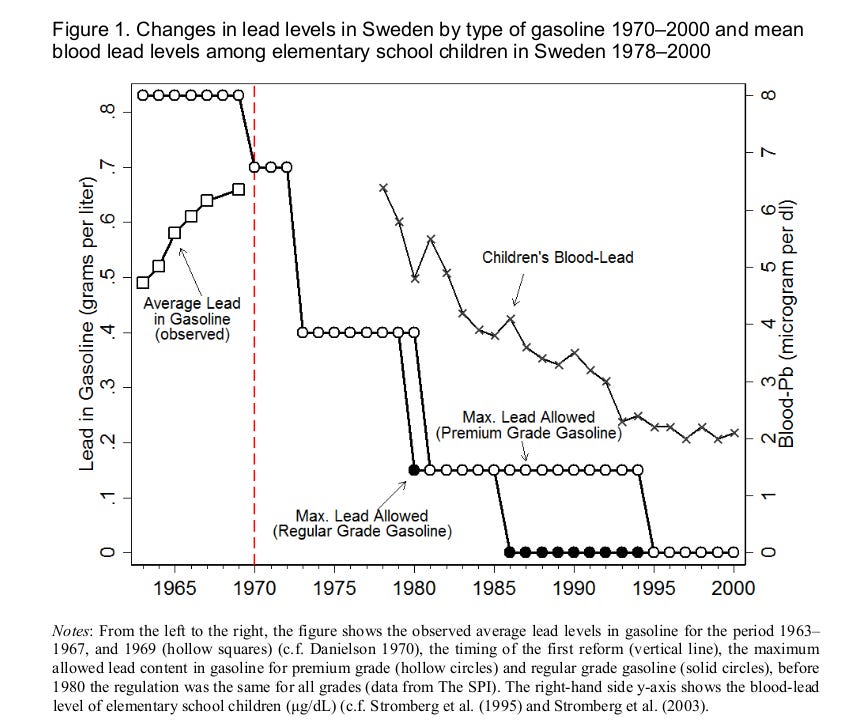
The situation in Sweden is that they introduced lead in car fuel ('gasoline', another misnomer, it's not a gas!) in and then later phased it out;
Lead started to be added to gasoline in Sweden in 1946 (Danielson, 1970). In response to the increasing trend in lead emissions from motor vehicles (see Figure 1), Sweden initiated a gradual phase-out of leaded gasoline in order to protect the environment and public health in 1970. While the 1970 reform prevented further increases in gasoline lead content, the main reductions in gasoline-lead levels occurred between 1973 and 1981 when the maximum amount dropped by 79% (see Figure 1). Gasoline lead was the main source of lead exposure in the general population and, as shown in Figure 1, there was a sharp decrease in children’s blood-lead levels (B-Pb) from the 1970s until the mid-1990s when leaded gasoline was banned.
Looks like this:
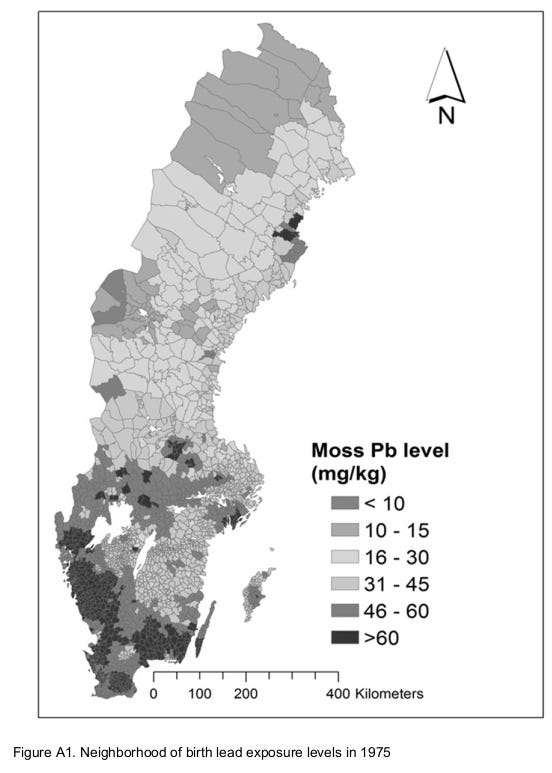
They have also been measuring the lead content over the years using mold, looks like this in 1975:
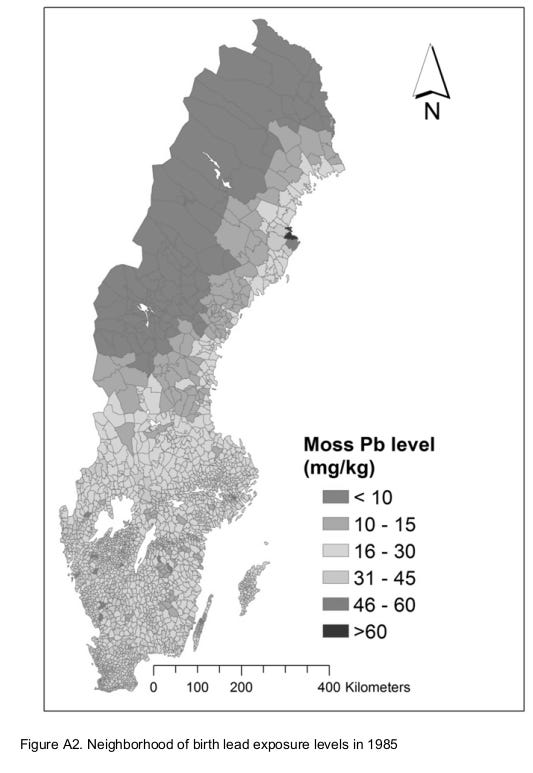
And then in 1985:
So all cool stuff, we finally get to their main results:
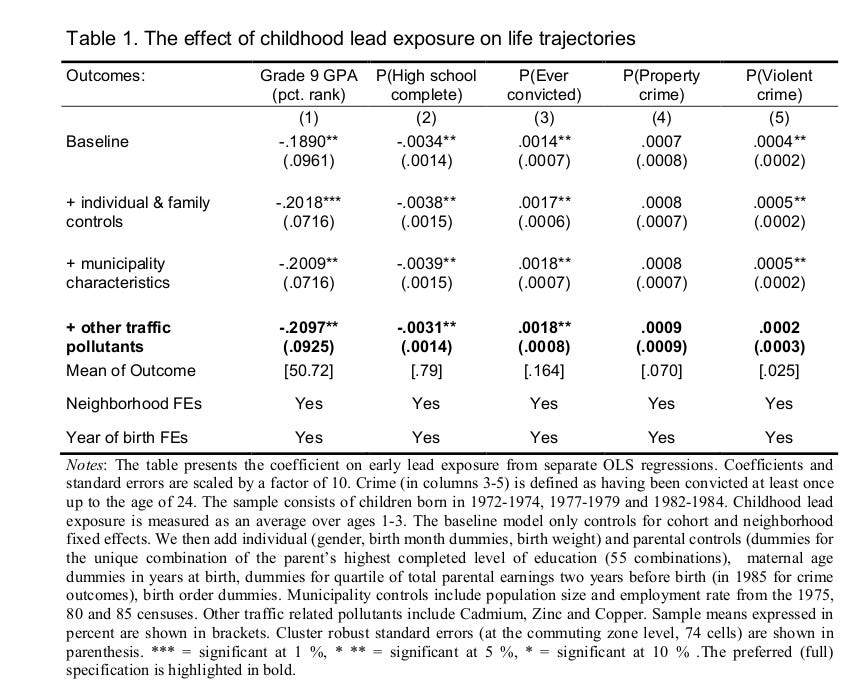
And you start wondering. Wait, so they have a sample size of 800,000 persons, but look at these p values. They have changed the usual asterisk meanings, one star is 10% not 5%! They report 20 results in this table, and of these, ONE has p < .01! That's terrible! Everything else is merely p < .05 or not at all. Their preferred results (bold row) have p's of 0.011, .013, .012. This is truly amazing and even fails the TIVA. (You compute the p values using pnorm(-.2097/.0925), pnorm(-.0031/.0014), pnorm(-0.0018/0.0008) in R.) TIVA? Test of insufficient variance. If you ran a bunch of real tests without p-hacking, the p values follow a uniform distribution, so their expected variation is pretty high. If there is no signal, the expected standard deviation is 0.29 (R: sd(runif(10000000))). If there is signal, it will be smaller, but not extremely small unless you have very high power (>95%). Here's some play results:
> set.seed(1)
> lotoftests = map_dbl(1:100000, ~t.test(rnorm(50), rnorm(50, mean = .56))$p.value)
> #power
> mean(lotoftests < .05) [1] 0.79 > #sd of p
> describe2(lotoftests)
# A tibble: 1 × 10
  var        n   mean  median    sd     mad      min   max  skew kurtosis

1 X1    100000 0.0482 0.00601 0.115 0.00881 2.75e-12  1.00  4.31     22.4
Here we run 10,000 t-tests with 2 samples of n=50, with a true difference of 0.56 d. 79% of the p values are below 5%, so that's power of ~80% (i.e. far beyond most social science). This results in an average p value of .048, which is not at all impressive (it's actually depressive). The standard deviation is 0.115. Yet the authors above obtained a standard deviation of p values of about 0.01 based on their 3 results highlighted. Either something fishy or fantastic coincidence. Basically I don't trust these results at all.
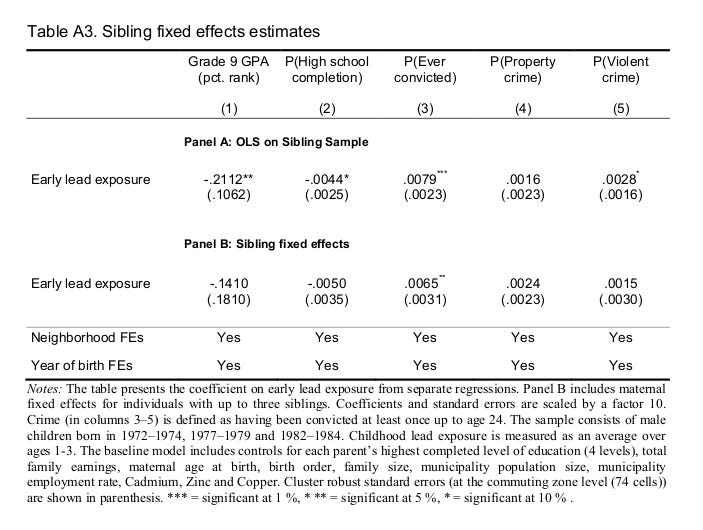
They also reported a sibling fixed effects in their appendix, which shows a single p < .05 (ever convicted, p = .018), but it's woefully underpowered for the effect sizes they claim:
Basically we give up with this study, despite how great the data are.
Gazze, L., Persico, C., & Spirovska, S. (2020). The spillover effects of pollution: How exposure to lead affects everyone in the classroom.
Evidence shows that lead-exposed children are more disruptive and have lower achievement. However, we know less about how lead-exposed children affect the learning environment of their classroom peers. We estimate these spillover effects using new data on children's blood lead levels (BLLs) matched to all education data in North Carolina. We compare siblings who attend the same school, but whose school-grade cohorts differ in the proportion of children with elevated BLLs. We find that having more lead-exposed peers is associated with lower test scores and graduation rates, increased suspensions and dropping out of school, and a decrease in college intentions.
Their claim is even more fantastic: low level lead poisoning is powerful enough that one can detect it by studying someone's peers in a classroom who are enriched in blood lead. They again have a very nice dataset:
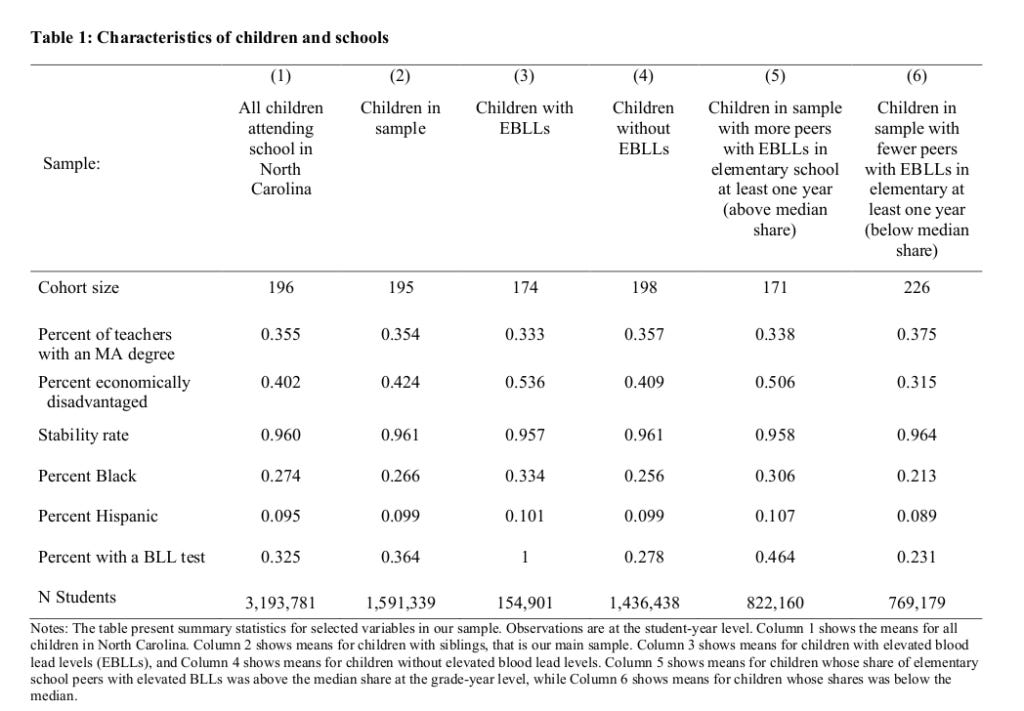
A whopping 1.6 million children in their sample. However, when they describe their results we go 🤨:
We find that a ten percent increase in the share of peers in a child’s cohort that are exposed to lead is associated with a 0.54 percent of a standard deviation decrease in test scores and a 1.3 percentage point increase in the likelihood of suspension from school, which represents a 17 percent increase in suspensions. We also find a 0.06 percentage point increase in the likelihood that a child drops out of school, which represents a 30 percent increase in the dropout rate. In addition, having one additional lead-exposed peer in a child’s elementary school classroom of 20 is associated with 1 percent of a standard deviation lower average test scores in eighth grade and a 0.12 percentage point increase in the likelihood that the unexposed child will ever drop out of school. We also find that having more lead-exposed children in a child’s elementary school classroom is associated with a lower likelihood of ever graduating high school, while having more middle school peers with elevated BLLs is associated with a reduction in plans to attend a four-year college and a decrease in the likelihood of taking the SAT.
A 0.54 percent of a standard deviation? They apparently mean to have detected a Cohen's d of 0.0054! This is 0.081 IQ for a 10% point increase in enriched peers. Laughable small, even if we accept their results. There is also a 1% of a standard deviation lower test score in the eighth grade, or 0.15 IQ. A drop-out of 0.06 of a percent point, I think that's 0.0006%. Let's actually look at their main table:

Despite the sample sizes, not even all their p values are small. Here we like something with at least 2 stars, meaning p < .01. I think their main results are those in row B, as this is where we find something that looks like the 0.54 mentioned. What's even weirder is how the effect size is something like 3x as large in panel C for test scores, BUT reduced by something like 80% in the second column in panel C. The difference is that C is about the same classroom vs. potentially different classrooms but same class level (cohort). So effects should be uniformly stronger as children in the same classroom obviously spend more time together, but somehow they get wildly divergent results. In panel D, they look at grade 8 outcomes, where they now see a 4x effect size for peers with lead enrichment compared to the same year (!), but the other results are now p > .05. So eh?? My interpretation of this table is just that they have some misspecification in their models somewhere, and that's why the results are all over the place between their models.
Their long run effects are even worse:
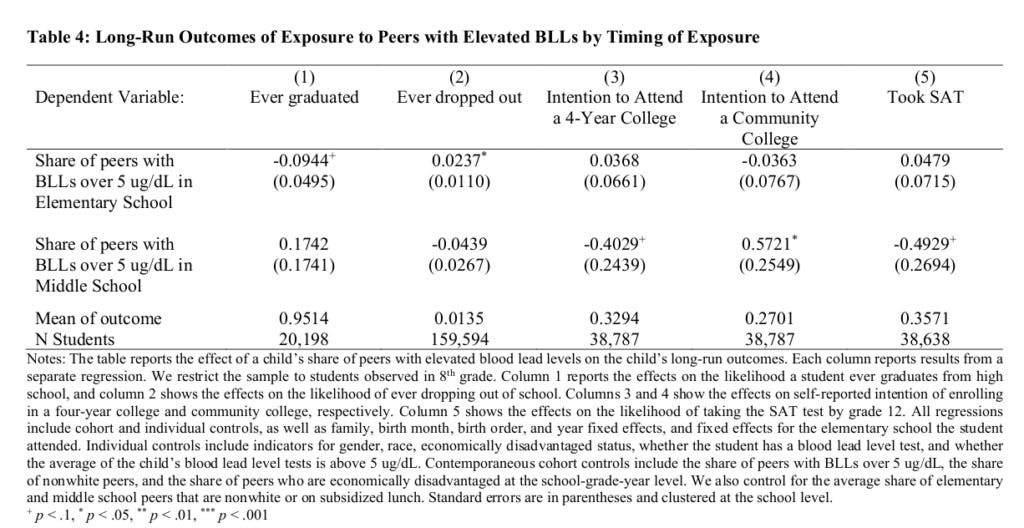
There's not even one p < .01 despite samples with between 20k and 160k students.
Unsatisfied with the above two studies, I checked one of the papers they cited as good evidence:
Aizer, A., Currie, J., Simon, P., & Vivier, P. (2018). Do low levels of blood lead reduce children's future test scores?. American Economic Journal: Applied Economics, 10(1), 307-41.
We construct a unique individual-level dataset linking preschool blood lead levels with third grade test scores for Rhode Island children born 1997–2005. Using two identification strategies, we show for the first time that reductions of lead from even historically low levels have significant positive effects. A one-unit decrease in average blood lead levels reduces the probability of being substantially below proficient in reading (math) by 0.96 (0.79) percentage points on a baseline of 12 (16) percent. Since disadvantaged children have greater exposure to lead, lead poisoning may be one of the causes of continuing disparities in test scores.
I admit I was unable to make sense of their fancy instrumental variables models, but even the abstract says their effect sizes are seemingly trivial. Units of lead is measured in micrograms per deciliter I think (BLL), and they explain the implications if we accept their results:
In order to address these issues, we develop two instrumental variables strategies. The first exploits the fact that there are multiple measures of blood lead levels for most of the children in our data. Using this instrument increases the estimated impact of a unit of blood lead on reading ( math) from −0.188 (−0.124) to −0.436 (−0.305). These figures suggest that for the average public school child, eliminating lead (by reducing lead levels from 2.7 to zero micrograms per deciliter) increased mean reading and math scores by 1.18 and 0.82 points, respectively, corresponding to 9 and 6 percent of a standard deviation. These are relatively modest gains. However, the effects are larger at the tails of the distribution. The same reduction in lead reduced the probability of being below proficiency in reading by 2.6 percentage points, or 22 percent. For math the comparable figure is 2.1 percentage points or 13 percent. These estimates seem generally consistent with estimates in the epidemiological literature though direct comparisons are difficult because of differences in methods, adjustments for measurement error, and the higher lead levels examined in previous work.
Read this again: their models says that even if completely removed all lead, this would boost test scores by something like 6-9% standard deviation, which is equivalent to between 0.9 and 1.3 IQ. Utterly trivial even if we accept the estimates. Besides, lead level are already dropping fast:
We have obviously not seen any explosion in talent in the schools, or any notable changes in gaps between the usual demographic groups.
Giving up on the economist evidence, I knew that there were some actual randomized controlled trials where they experimentally reduced lead levels in children and studied how much this helped. I searched for such studies on Google Scholar, looking over the first 5 pages of results based on the query: lead poisoning "randomized controlled trial". Here is what I found:
Taiwan, 1999: An n=32 with patients suffering from chronic renal issues, who were also elevated in blood lead. They were given chemical treatment to reduce lead poisoning (Chelation therapy). This kinda worked, that is, some outcomes showed small p values, most were large, and some were dodgy.
USA 1986: An n=14 treatment, n=35 controls from USA. The study is about home dust control, basically fancy cleaning. Why are the samples so lopsided if it was randomized? Well they used a non-balanced design, and then 8 people from treatment group were dropped. 8 of 22 is 36%. They write that 2 moved, 3 families stopped being home or refused treatment, and 3 children started spending a lot of time somewhere else they weren't cleaning. Anyway, based on this comparison, the treatment group reduced their lead levels in the blood (p value convincing).
USA, 1999: n=99 study of cleaning like the one above. They began with 113 children, then had drop-out until they had "46 children in the lead group and 53 children in the control group", so again differential drop-out. Their results are basically null with some p-hacking/luck, e.g. main result was "Adjustment for baseline blood lead in a regression model provided an estimated intervention effect of 1.9 mg/dL (0.09 mmol/L; P < .05, one-sided)".
USA, 1999: n=246 children for home cleaning like the above (initial n=275). "We conclude that dust control, as performed by families and in the absence of lead hazard controls to reduce ongoing contamination from lead-based paint, is not effective in the primary prevention of childhood lead exposure.".
Meta-analysis, 2002: Includes some of the other studies and has overlapping authors, finds: "Four trials met the inclusion criteria. We examined mean blood lead concentration and elevated blood lead concentrations (> or = 10 microg/dL, > or = 15 microg/dL, and > or = 20 microg/dL) and found no significant differences in mean change in blood lead concentration for children by random group assignment (children assigned to the intervention group compared with those assigned to the control group)."
USA, 2011, 2013: A large clinical trial of a drug for lead reduction. It became two papers, but the clinicaltrials.gov listing is much more informative:
At TLC enrollment, the children were between 12 and 33 months of age with baseline blood lead levels (PbB) between 20 and 44 microg/dl. Of 1,854 referred children who were screened for eligibility, 780 were randomized to the active drug (oral succimer) and placebo groups, stratified by clinical center, body surface area, blood lead level and language spoken at home; only the New Jersey Clinical Center enrolled Spanish-speaking participants. Up to three 26-day courses of succimer or placebo therapy were administered depending on response to treatment in those who were given the active drug. Eighty-nine percent of children had finished treatment by six months, with all children finishing by 13 months after randomization. Residential lead clean-up and nutritional supplementation with multivitamins and minerals were provided to all study children, irrespective of treatment group. Children were followed for three years, with regular physical exams, psychological and developmental testing, and measurement of lead concentration in venous blood. Treatment and follow up are closed for this trial; it is open for scientific analysis and report writing only.
Although succimer lowered blood lead levels much more effectively than placebo, there was no difference between the two groups on any of the psychological tests at three years post randomization, when most children were about five years old. Follow up of TLC children continued into school age. At age seven, 647 of 780 subjects remained in the study. Children were tested at age seven and again at seven and a half on standardized neuropsychological batteries that tap cognition, behavior, learning and memory, attention, and neuromotor skills. While chelation therapy with succimer had lowered average blood lead levels for approximately six months, it resulted in no benefit in cognitive, behavioral and neuromotor endpoints when measured at school ages in these children. These additional follow-up data confirm our previous finding that the TLC regimen of chelation therapy is not associated with neurodevelopmental benefits in children with blood lead levels between 20 and 44 microg/dL.
Basically, it had a short-term reduction in lead levels, and nothing happened later from this.
OK, I don't claim to have looked over every possible study, but I've made a good effort to find evidence of low level lead poisoning on humans. The economist studies were not plausible (p-hacking was evident), or had trivial effect sizes such as reducing a test score by some 0.15 IQ equivalent. The randomized controlled trials were unfortunately not much more convincing. Some showed one could reduce blood lead levels, but the largest study basically found that this didn't do anything for later life, even when done using an effective drug.
Whatever low level lead poisoning does, it is not something that is obviously evident from the existing studies despite the hype. I don't think we need to be worried about this. I do think society scale lead poisoning can be important, as in Roman times of literally cooking food in lead pots.
I have always suspected approximately this was the case (I would have been open to the possibility of a small, absolutely non-large effect such as a lowered IQ of perhaps of 1/6 of a SD at adulthood at the very most, but what you have found I would call no significant effect) although admittedly based on rather weak arguments.
My skepticism on the effect of lead on IQ and criminality has come from low level lead posioning being a much hyped explanation, together with legalized abortion, for the shrinking crime in 1990s US, while the explanation that the harsher punishments of criminality that started to become mainstream in the late 80s and were adopted in many states in the early 90s (After the long period of 60s-induced insanity of lowering punishment to near Scandinavian levels all the while having a large population of highly criminal black people) were a much more common sense explanation that better satisfied the premises of Occam's razor.
Add to that that the left has hated common sense since at least the 60s - which as all phenomena the left was first to denounce has since long become anathema to the center-right as well (As Steve Sailer says, political correctness is a war on noticing - ie common sense).
Common sense was/is responsible for such phenomena such as non-scientific racism as regards white racism (Ie noticing that other races except East Asians behaves in a way oppositional to the core of western civilization as it has existed for centuries), stereotyping (accurately), using ethnic/cultural/religous profiling, using appearance-based profiling (That started to intersect with class-based profiling since in the 60s the working class gave up their earlier norms of putting on their costumes when out int their free time on sundays - a behaviour first partly induced by the benevolent paternalism of the nordic early social democratic parties who were adamant about educating the working classes, to make the working class appreciate high-brow culture and in general better themselves intellectually and mentally) and other such things that are a natural part of our evolved tribal collectivist danger-avoiding brains but very much in opposition to the radical individualist liberatory project that the left has been committed to since the 60s.
Since the harsher punishment in the US especially targeted repeat offenders, who it is well known is reponsible for the overwhelming amount of crime in almost all western societies (At least all western societies I have checked the data for, roughly ten countries) with the incapative effects of putting especially violent criminals of the anti-social type (Ie those that are the repeat offenders) in prison for long times being the obvious explanation for the shrinking crime in the US during the 90s, leaving the lead-level and legalized abortion arguments as a quite obvious expression of ideology to avoid the even broader applications of laws such as "three strikes and you're out" and so on.
Anyway, thanks for the interesting post. I find your blog almost always interesting and illuminating.
/Rationalist pro white-ethnocentism nationalist
PS. As I heard somebody say sometime:
"It takes a criminologist to come to the conclusion that harsher punishments do obviously not affect the level of crime in a society".
At least in Sweden (My home country - which I will leave for either Denmark, Finland, Hungary or Poland in a few years) that statement seems to hold up quite well.
The last poll I saw on this in Sweden indicated that among voters of all parties in the parliament there was an overwhelming majority for harsher punishment - the lowest majority was 62 % found among the Left party (Former Communist party). This poll was done and I saw it at least 10-15 years ago when the current explosion of what i believe in Denmark is called dominance crime plus gang-related crime, shootings and bombings and violent crime hadn't even begun to become an issue existing in any significant amount of people's consciousness (although there has been a steady rise of this type of crime ever since the 80s, which has risen exponentially as totally non-selective high-level legal as well as illegal migration of non-europeans to the country started to become official policy in 90s and turned into maximum level migration in the 00s).
https://www.hoplofobia.info/wp-content/uploads/2021/12/2021-Estimated-IQ-points-lost-to-early-childhood-blood-lead-levels-in-the-US.pdf