
How does one correct for measurement error in sibling models?
Sibling effects are great, but measurement error is a difficulty

There was a lot of discussion regarding the corrections for measurement error used in the recent Herasight intelligence polygenic score paper. I covered it for Aporia. I want to dive into the details of these corrections. The go-to paper everybody cites is Frisell et al 2012 (Sibling comparison designs: bias from non-shared confounders and measurement error). But before we get to that, let’s simulate the simplest possible situation:
Normally distributed cause and outcome variables (X and Y).
A true causal effect of 0.50 without confounding.
Varying amount of measurement error (random noise).
I asked AI to give me some code for doing this, and it succeeded. At least, I end up with sibling correlations for X, and Y of 0.5, with a beta (slope) of 0.5. The correlation of x~y is not .50 because I didn’t standardize the Y variable. It doesn’t matter for this I think.
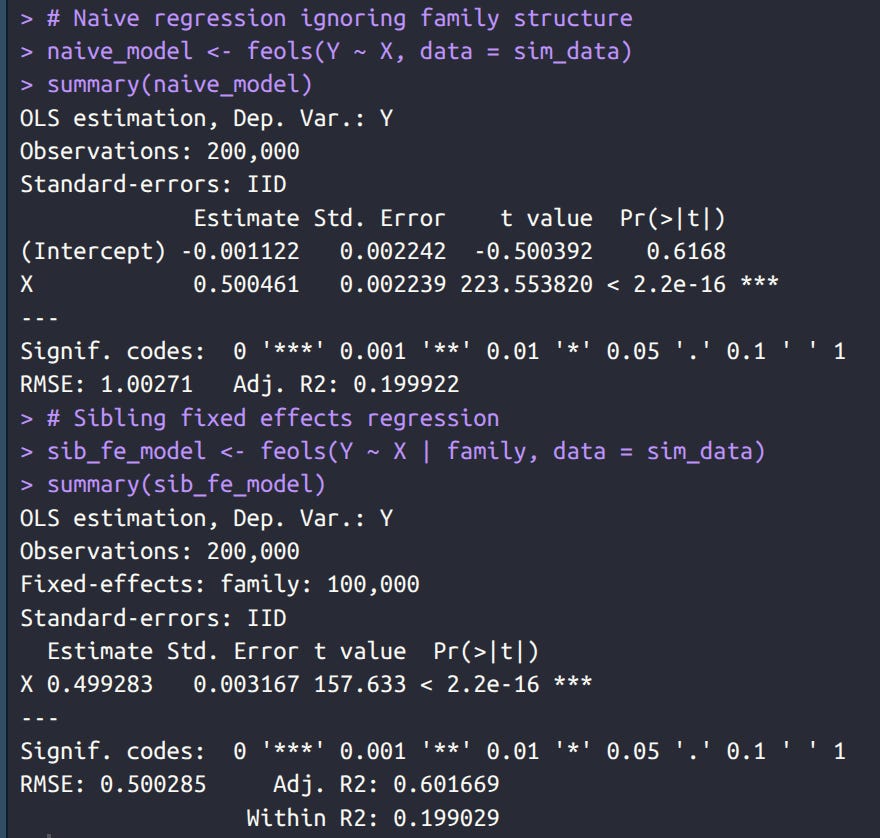
Then we fit between and within family models using fixest package. These both say the effect is 0.50 as well, because, recall, we didn’t have any confounding. Since siblings correlate 0.5 for Y as well, but are only expected to be about 0.25 correlated due to X, it means there is another shared cause of Y but which doesn’t correlate with X (thus not confounded). Model output example:
Next, we add some random error to the measurement of X and refit. I chose an amount of error that corresponds to a reliability of 0.7. Now we see that the estimates have declined in beta:
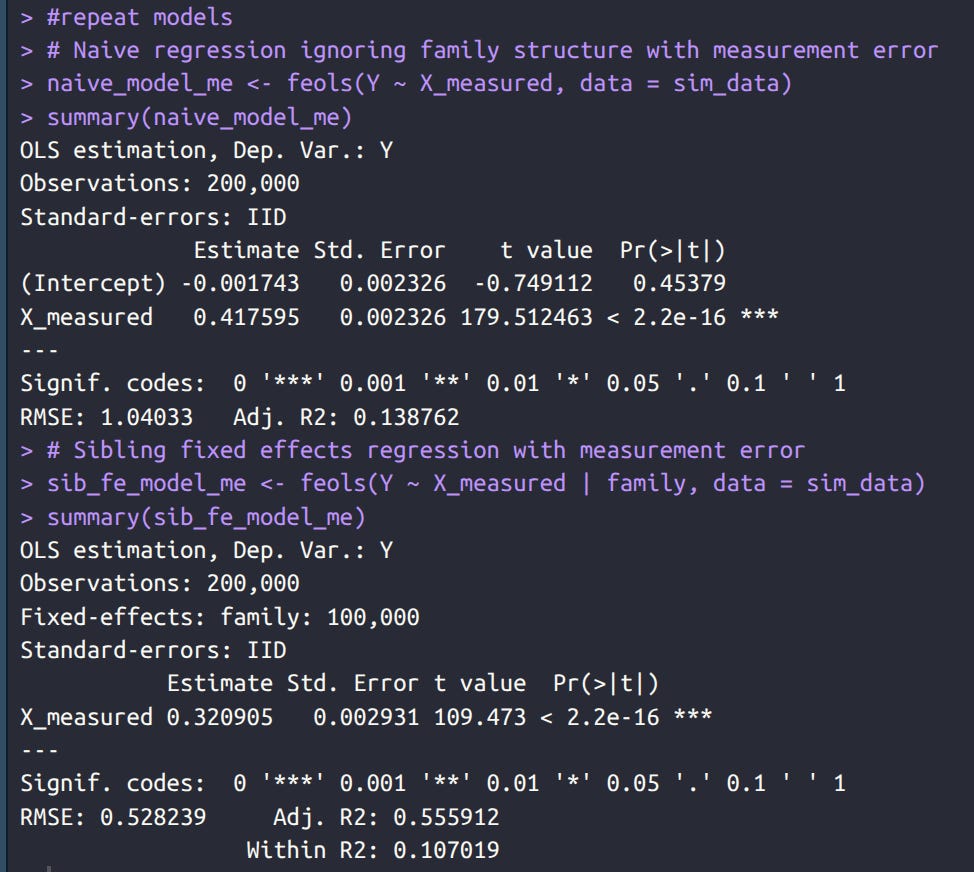
The fixed effects decline more. Why? Because fixed effects involving calculating demeaned data within families, that is, you subtract the family mean value for both variables. Since the family mean, and both observed values have error, the error compounds.
Frisell et al provides equations for doing the measurement error corrections:
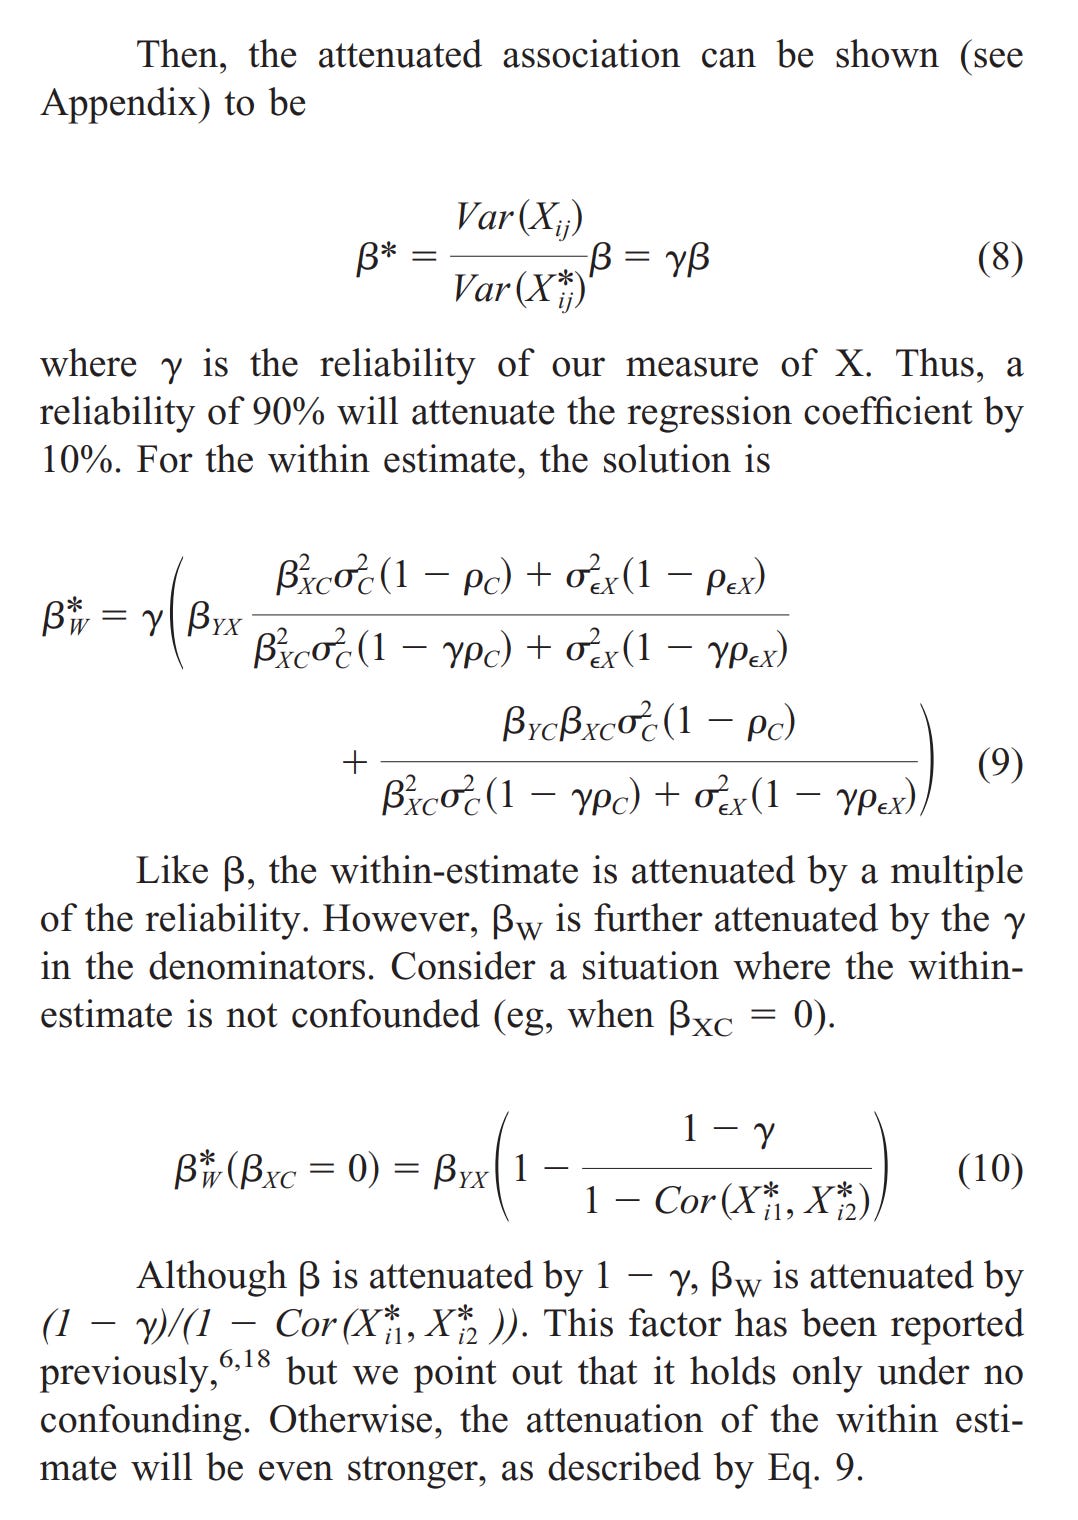
First thing to note is that equation 8 is wrong. You don’t divide by the reliability, but by the square root of reliability. That is, if you rearrange their equation, true beta = obs. beta / sqrt(reliability). I mean, maybe they have defined reliability in an unorthodox way using sqrt, but it doesn’t seem so. Their equations come from Griliches 1979 which is written in economist language. Hopefully, there is a reader here better than me at this who can read this and see where the error is. More importantly, they provide an equation for correcting for fixed effect results for the same bias. So let’s try it out. I simulated data with the reliability of X ranging from 0.50 to 1.00 and applied these corrections (correct version of 8):
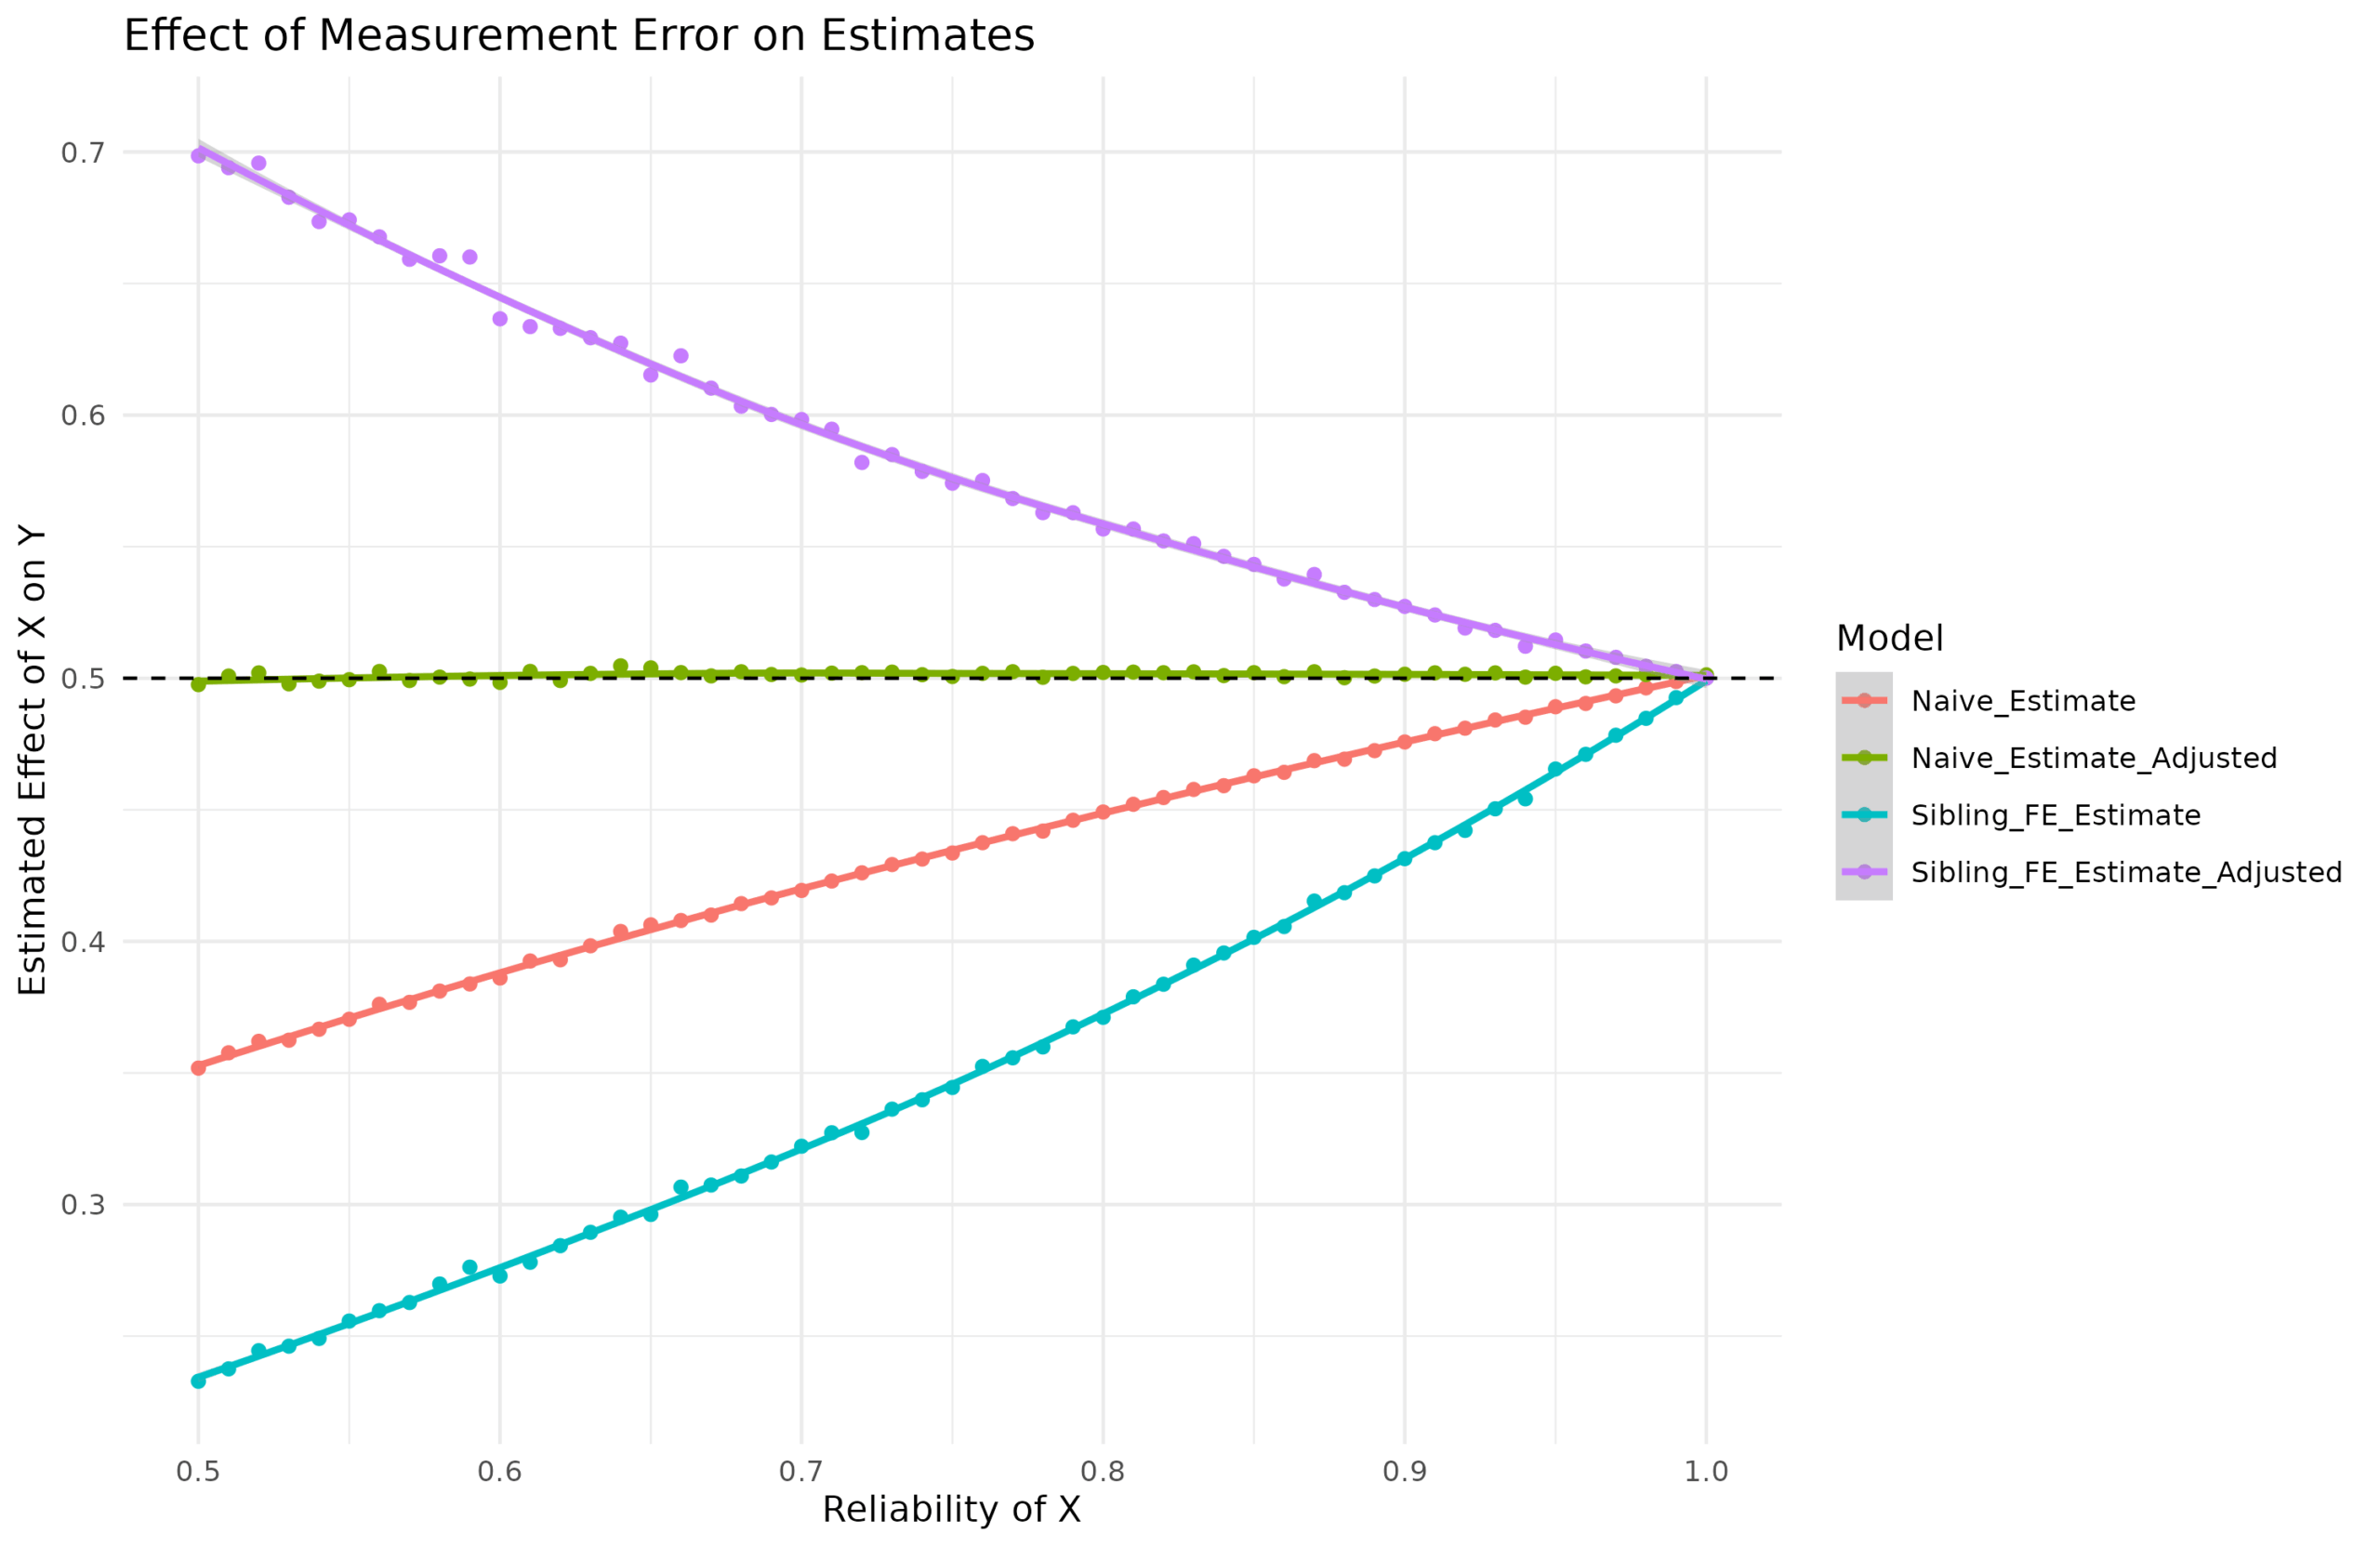
This correction is correct for the ordinary case (the green line stays at 0.5 for any value of reliability), but wrong for the fixed effects data as it over-corrects. Now, I’ve tried some variations of their equation since it could be due to a typo, but I couldn’t find one that works correctly. I am not sure what other people have been using, but hopefully not that one.
Since in this case, we know what the true beta is (0.5), we can inversely ask, what adjustment factor is needed for different reliabilities?:
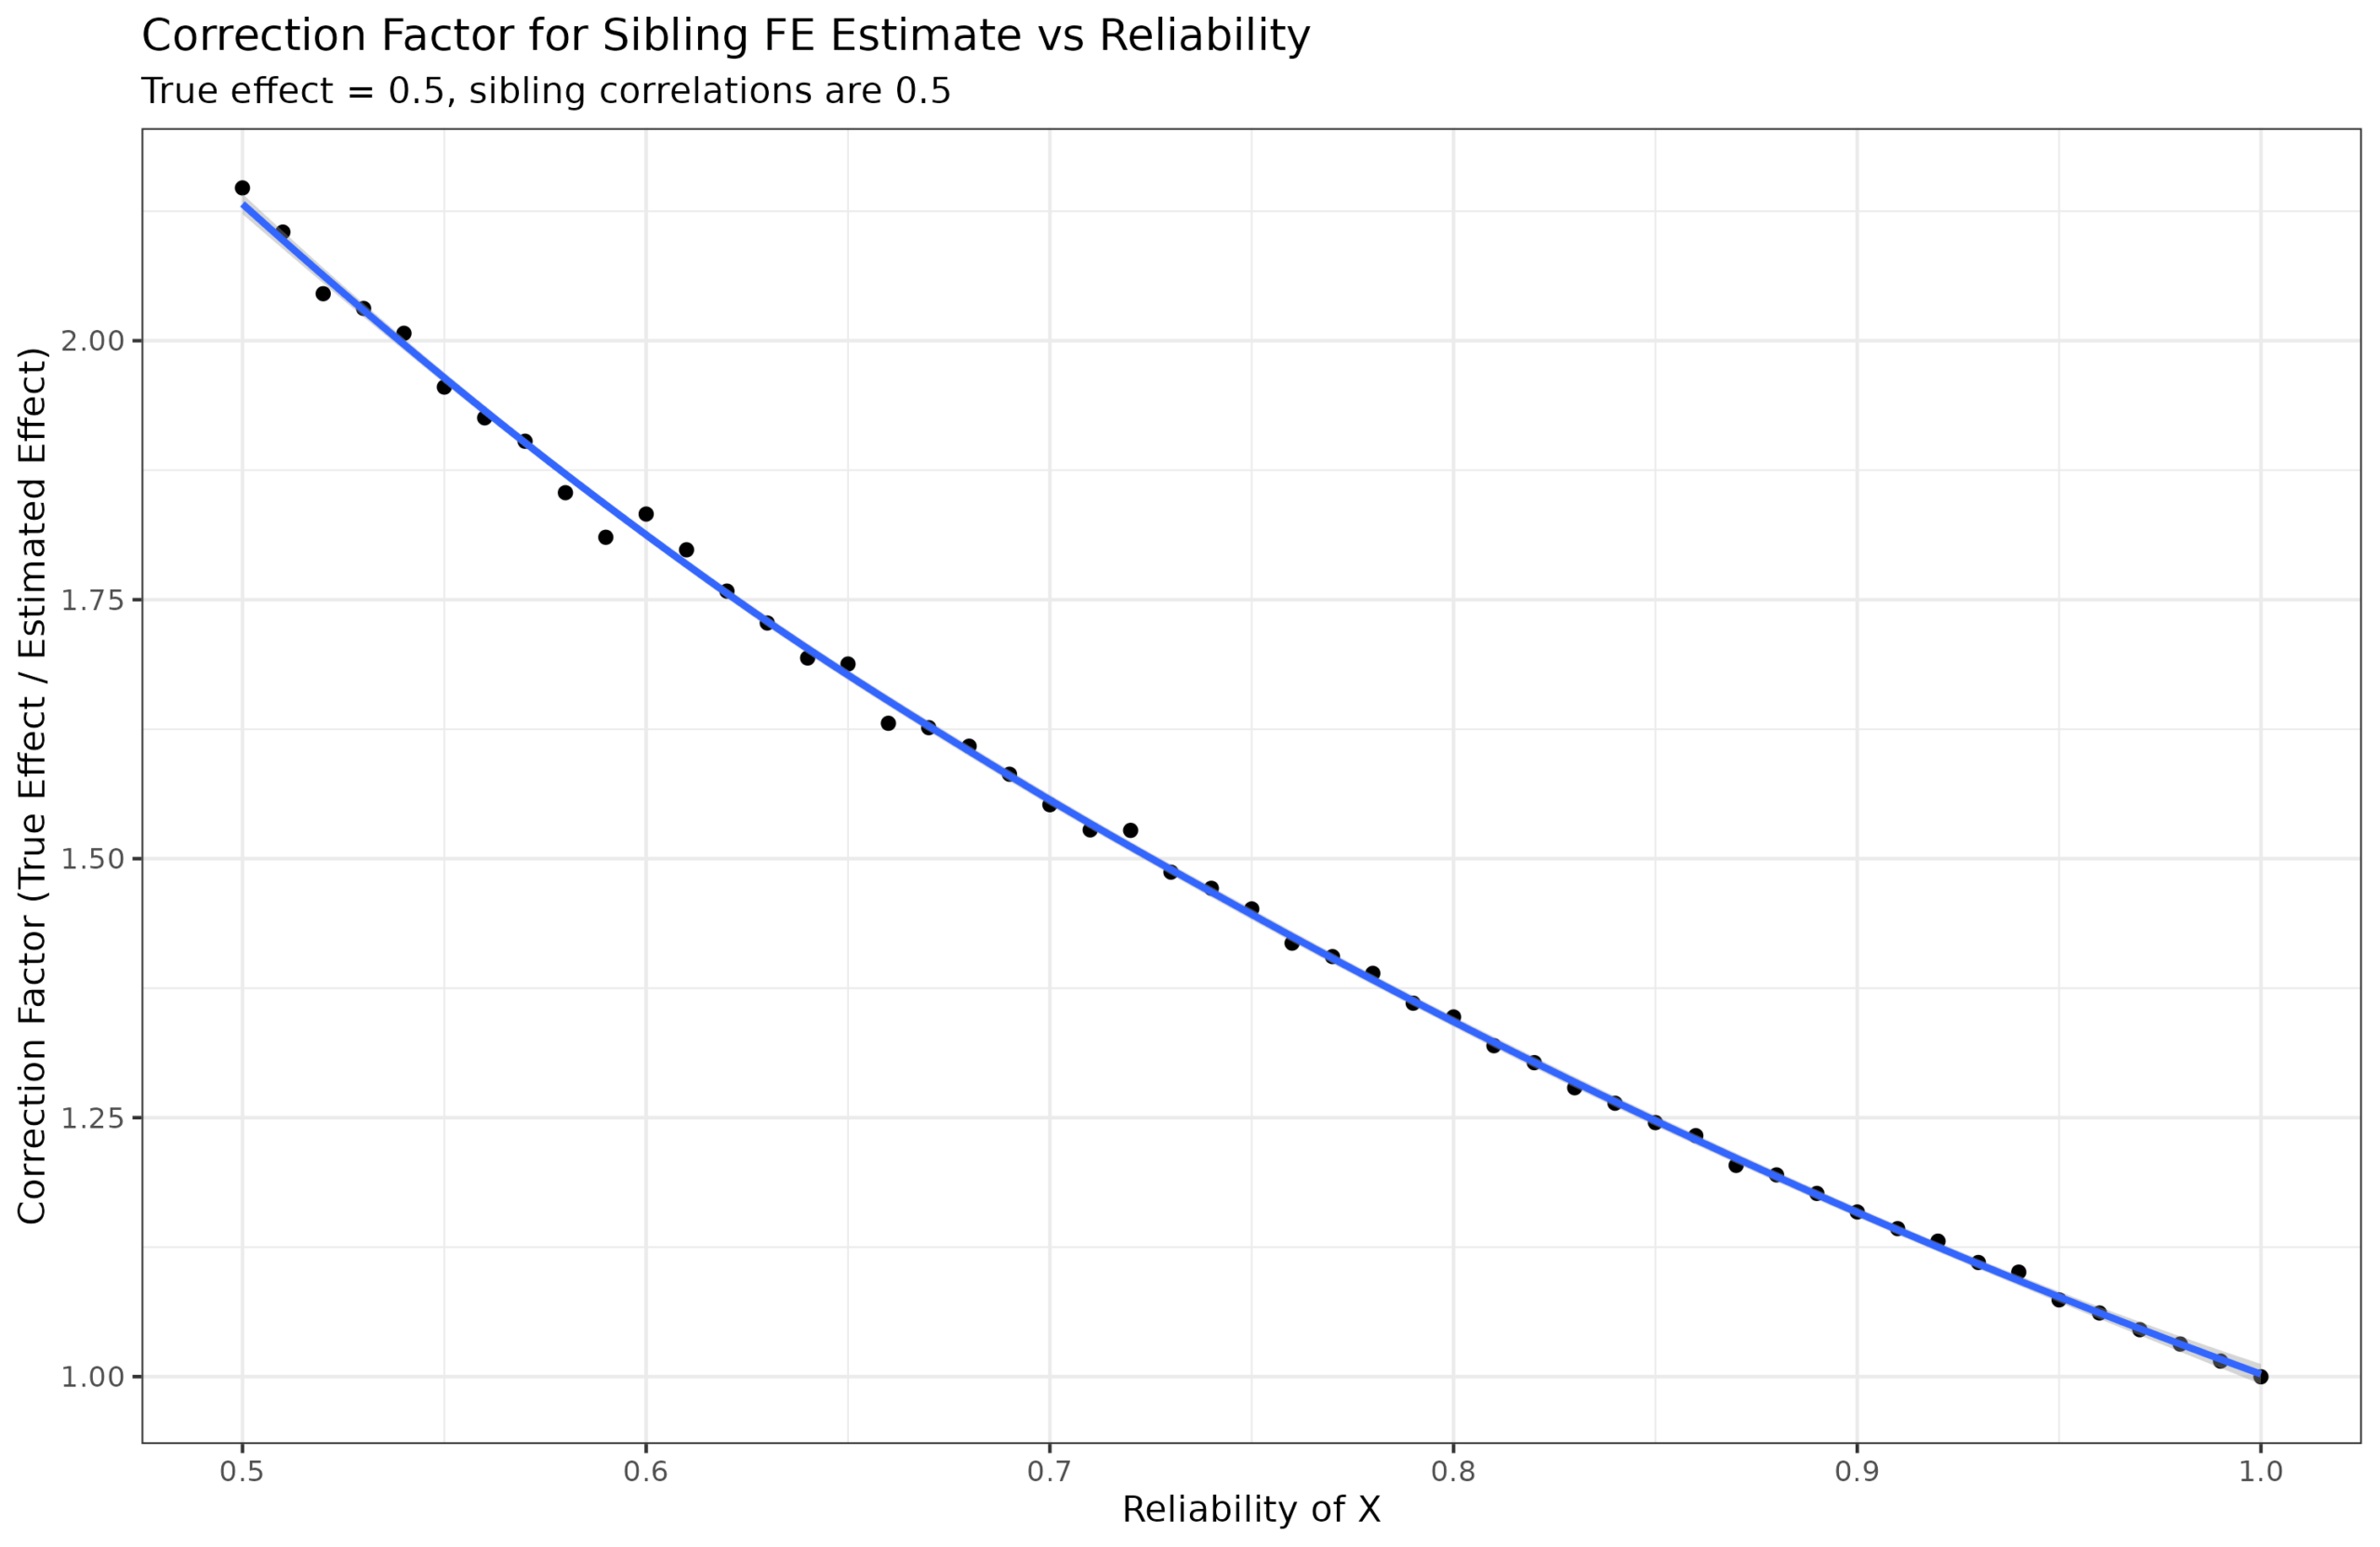
Mathematically, we are looking for a function that such that f(1)=1, and f(0.5)=2. This is almost the inverse, that is, 1/reliability but not quite:
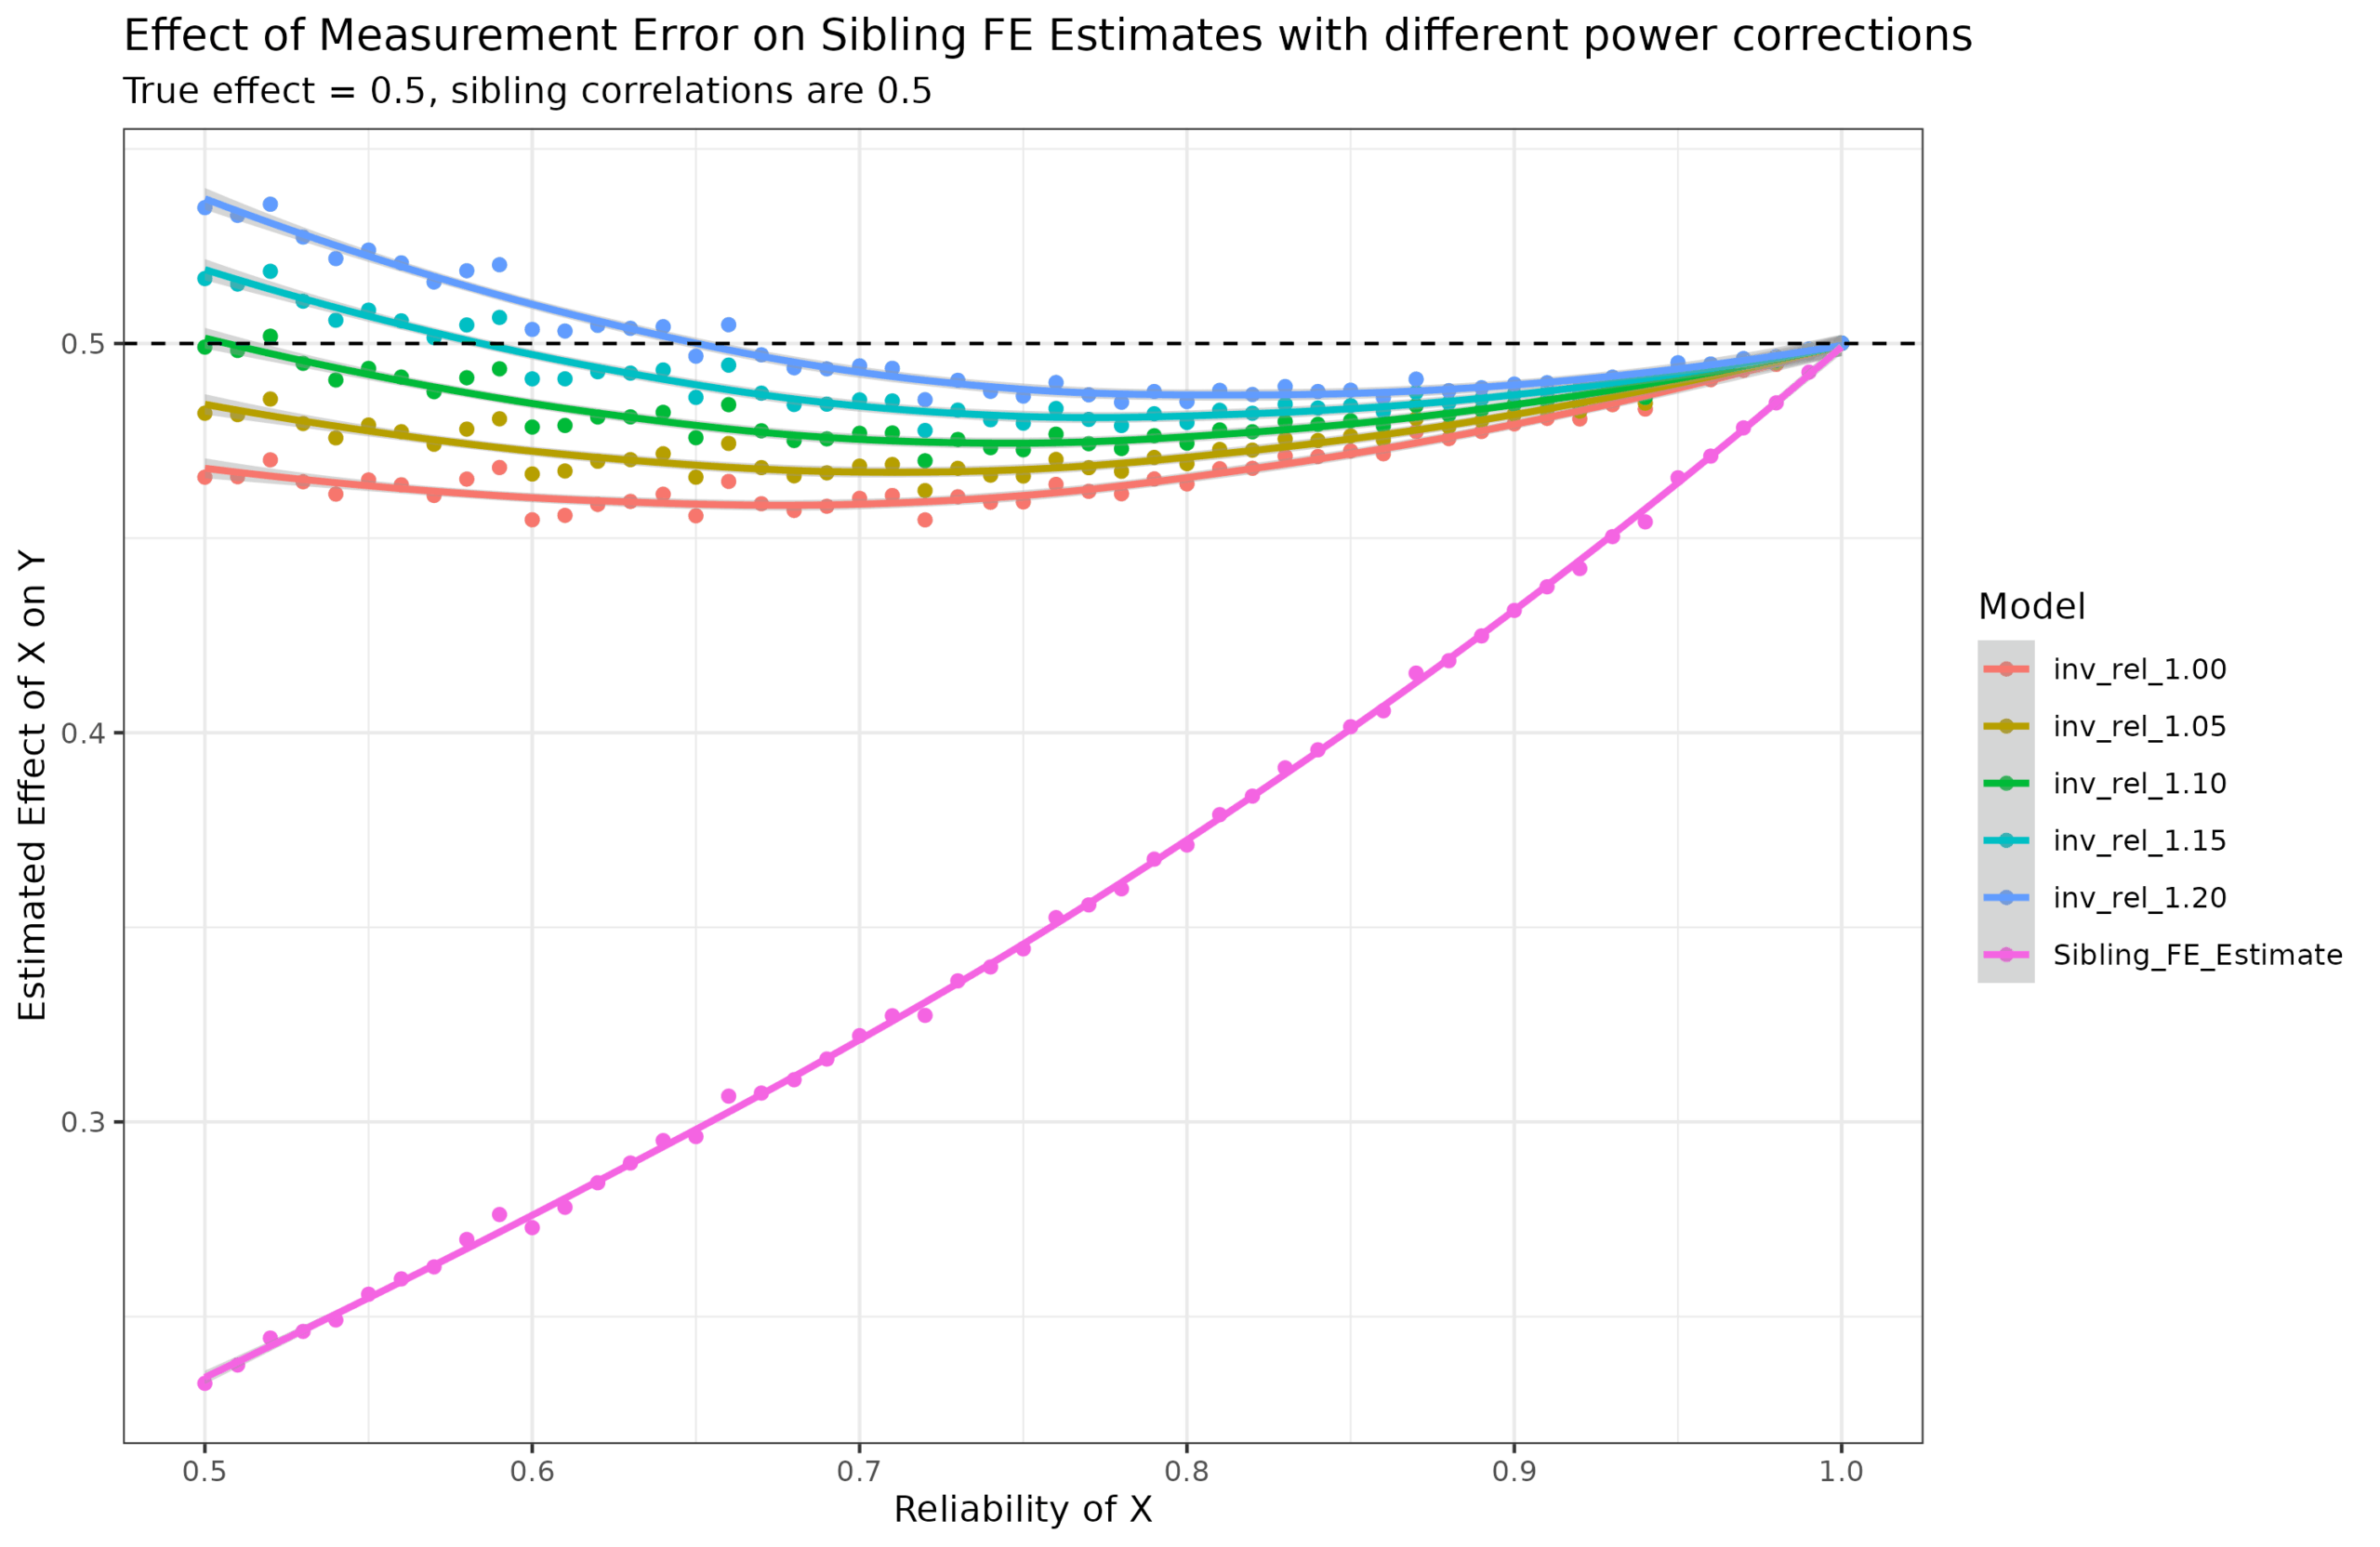
Trying out a few power shows that a value around 1.15 is the closest, but the shape is a bit wrong. I asked the AI to come up with some other function forms and I fit these using nls():
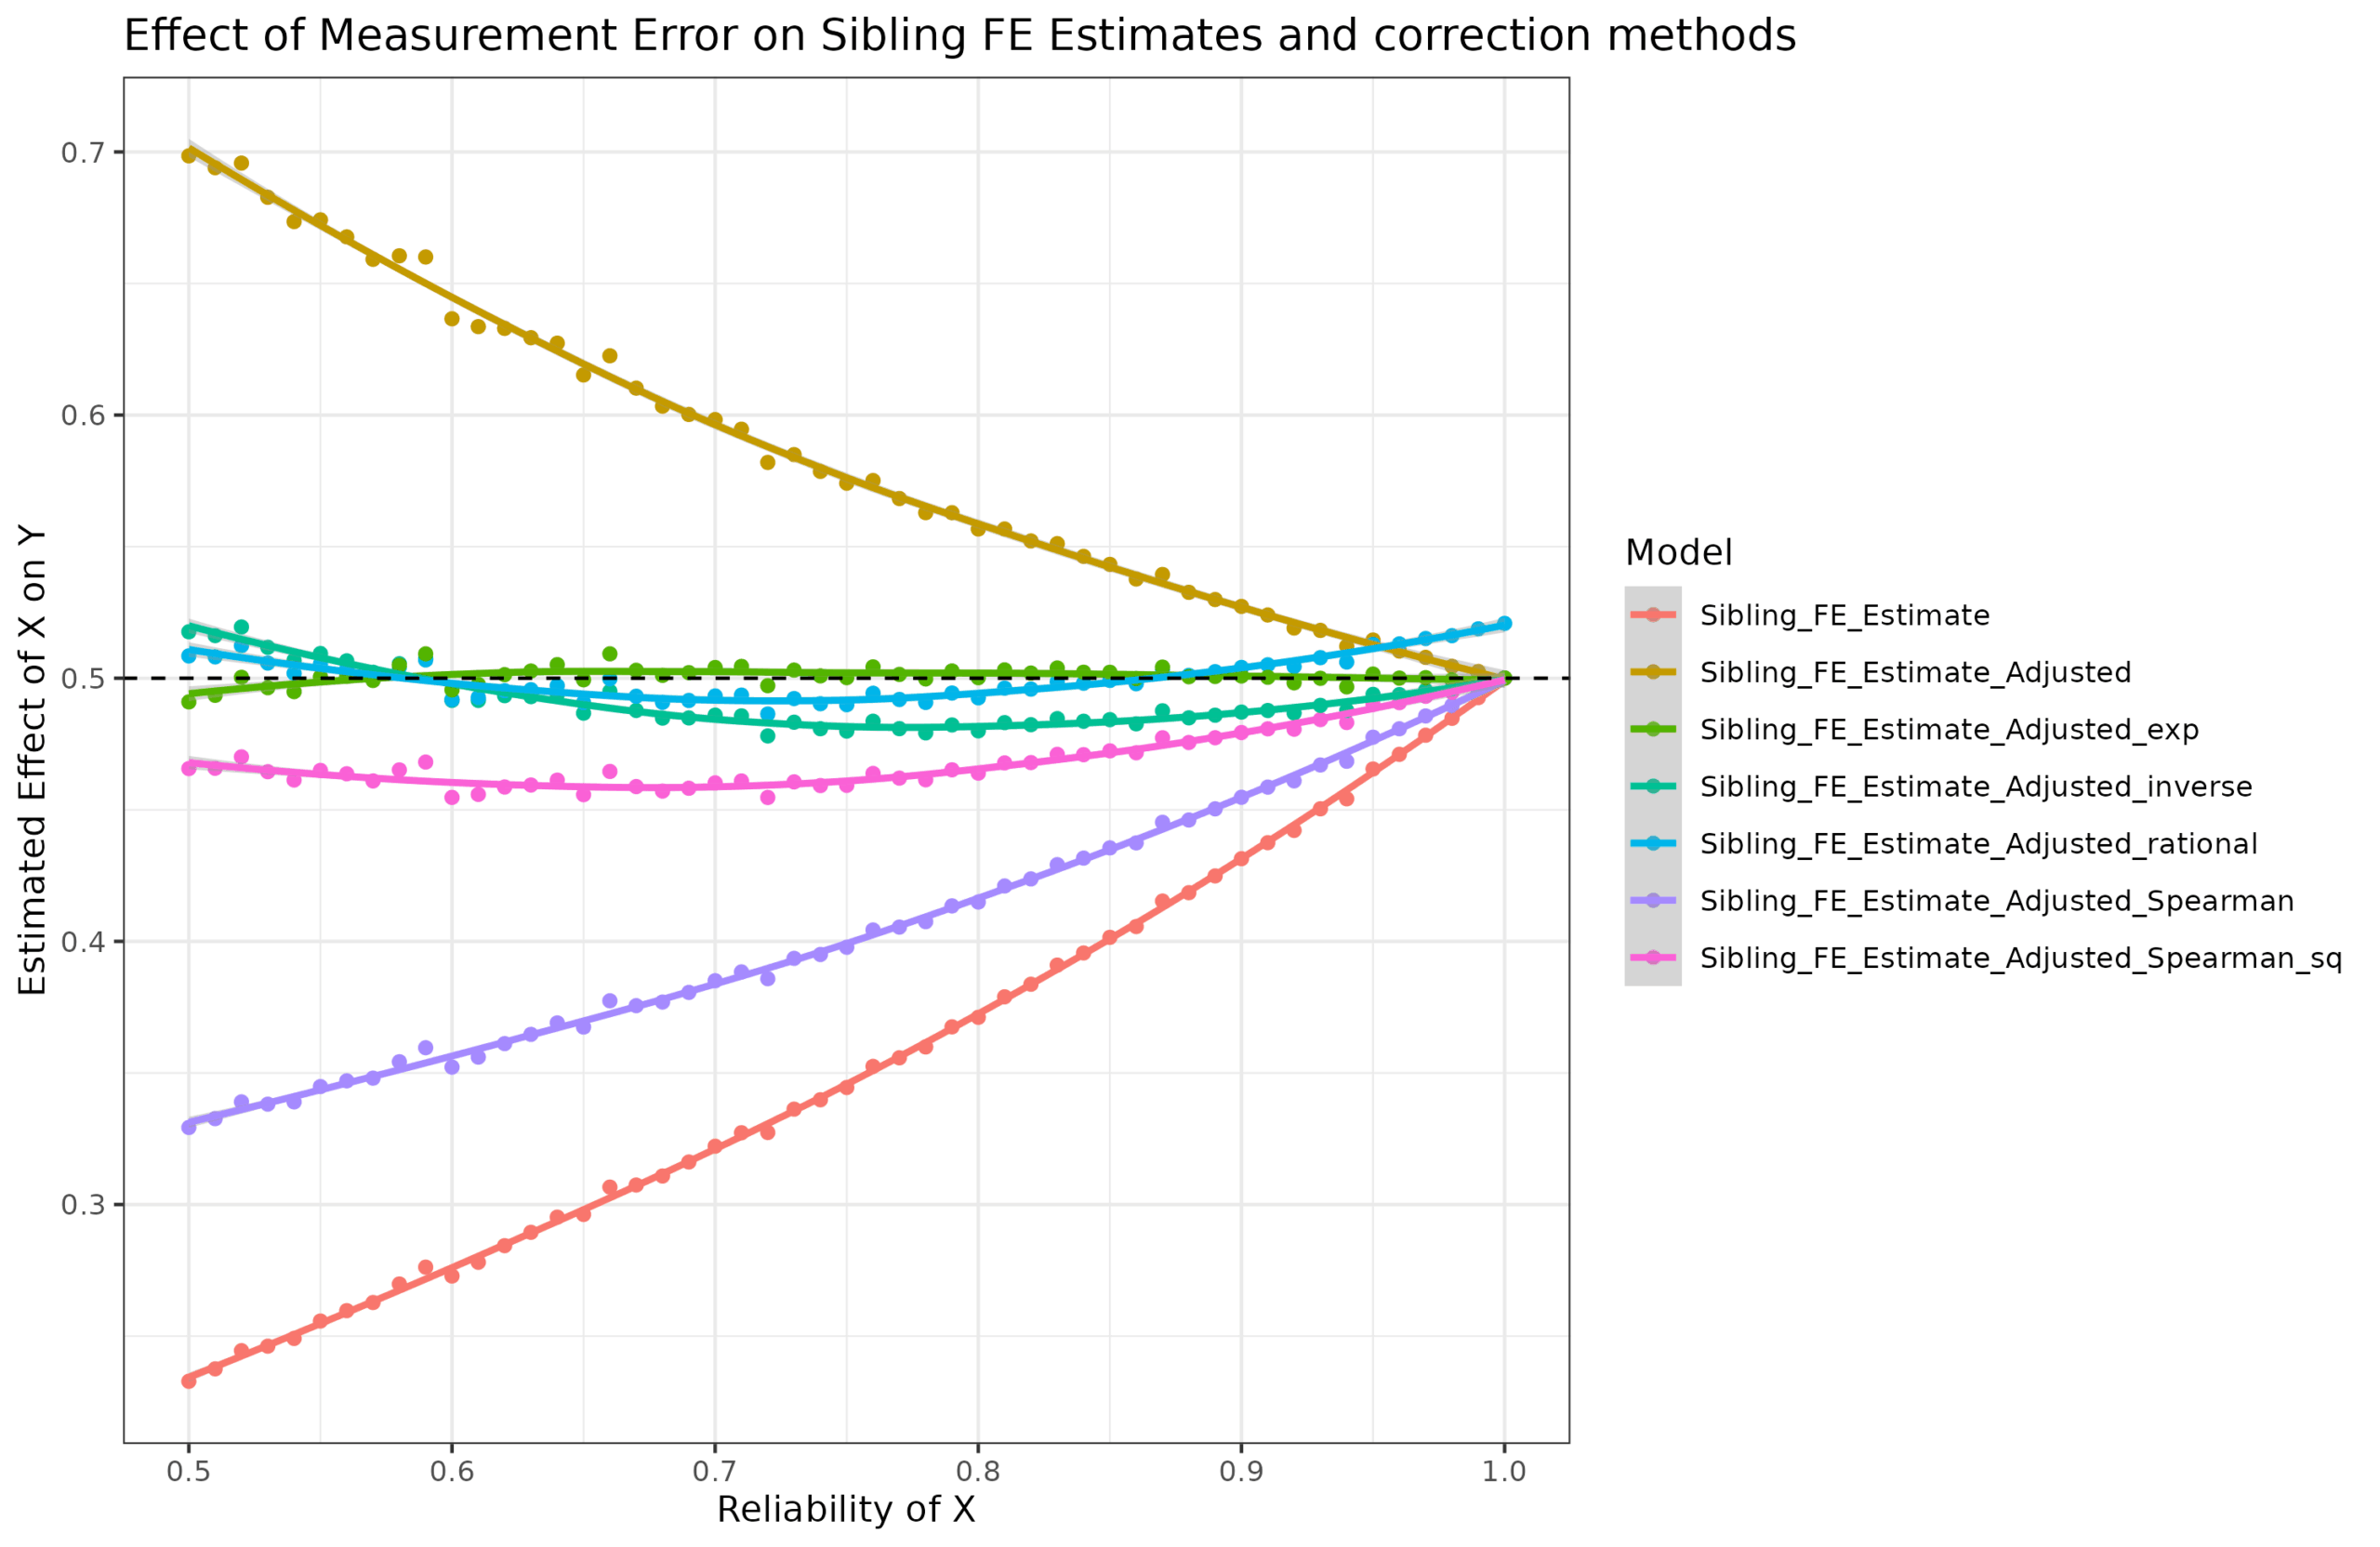
An exponential model provided a near perfect fit (Sibling_FE_correction_factor ~ exp(a * (1 - Reliability))). However, this may be a coincidence given that the sibling correlations and the beta was fixed at 0.5. So let’s try varying the sibling correlation of X, the beta, and the reliability and use the same models (a true out of sample test):
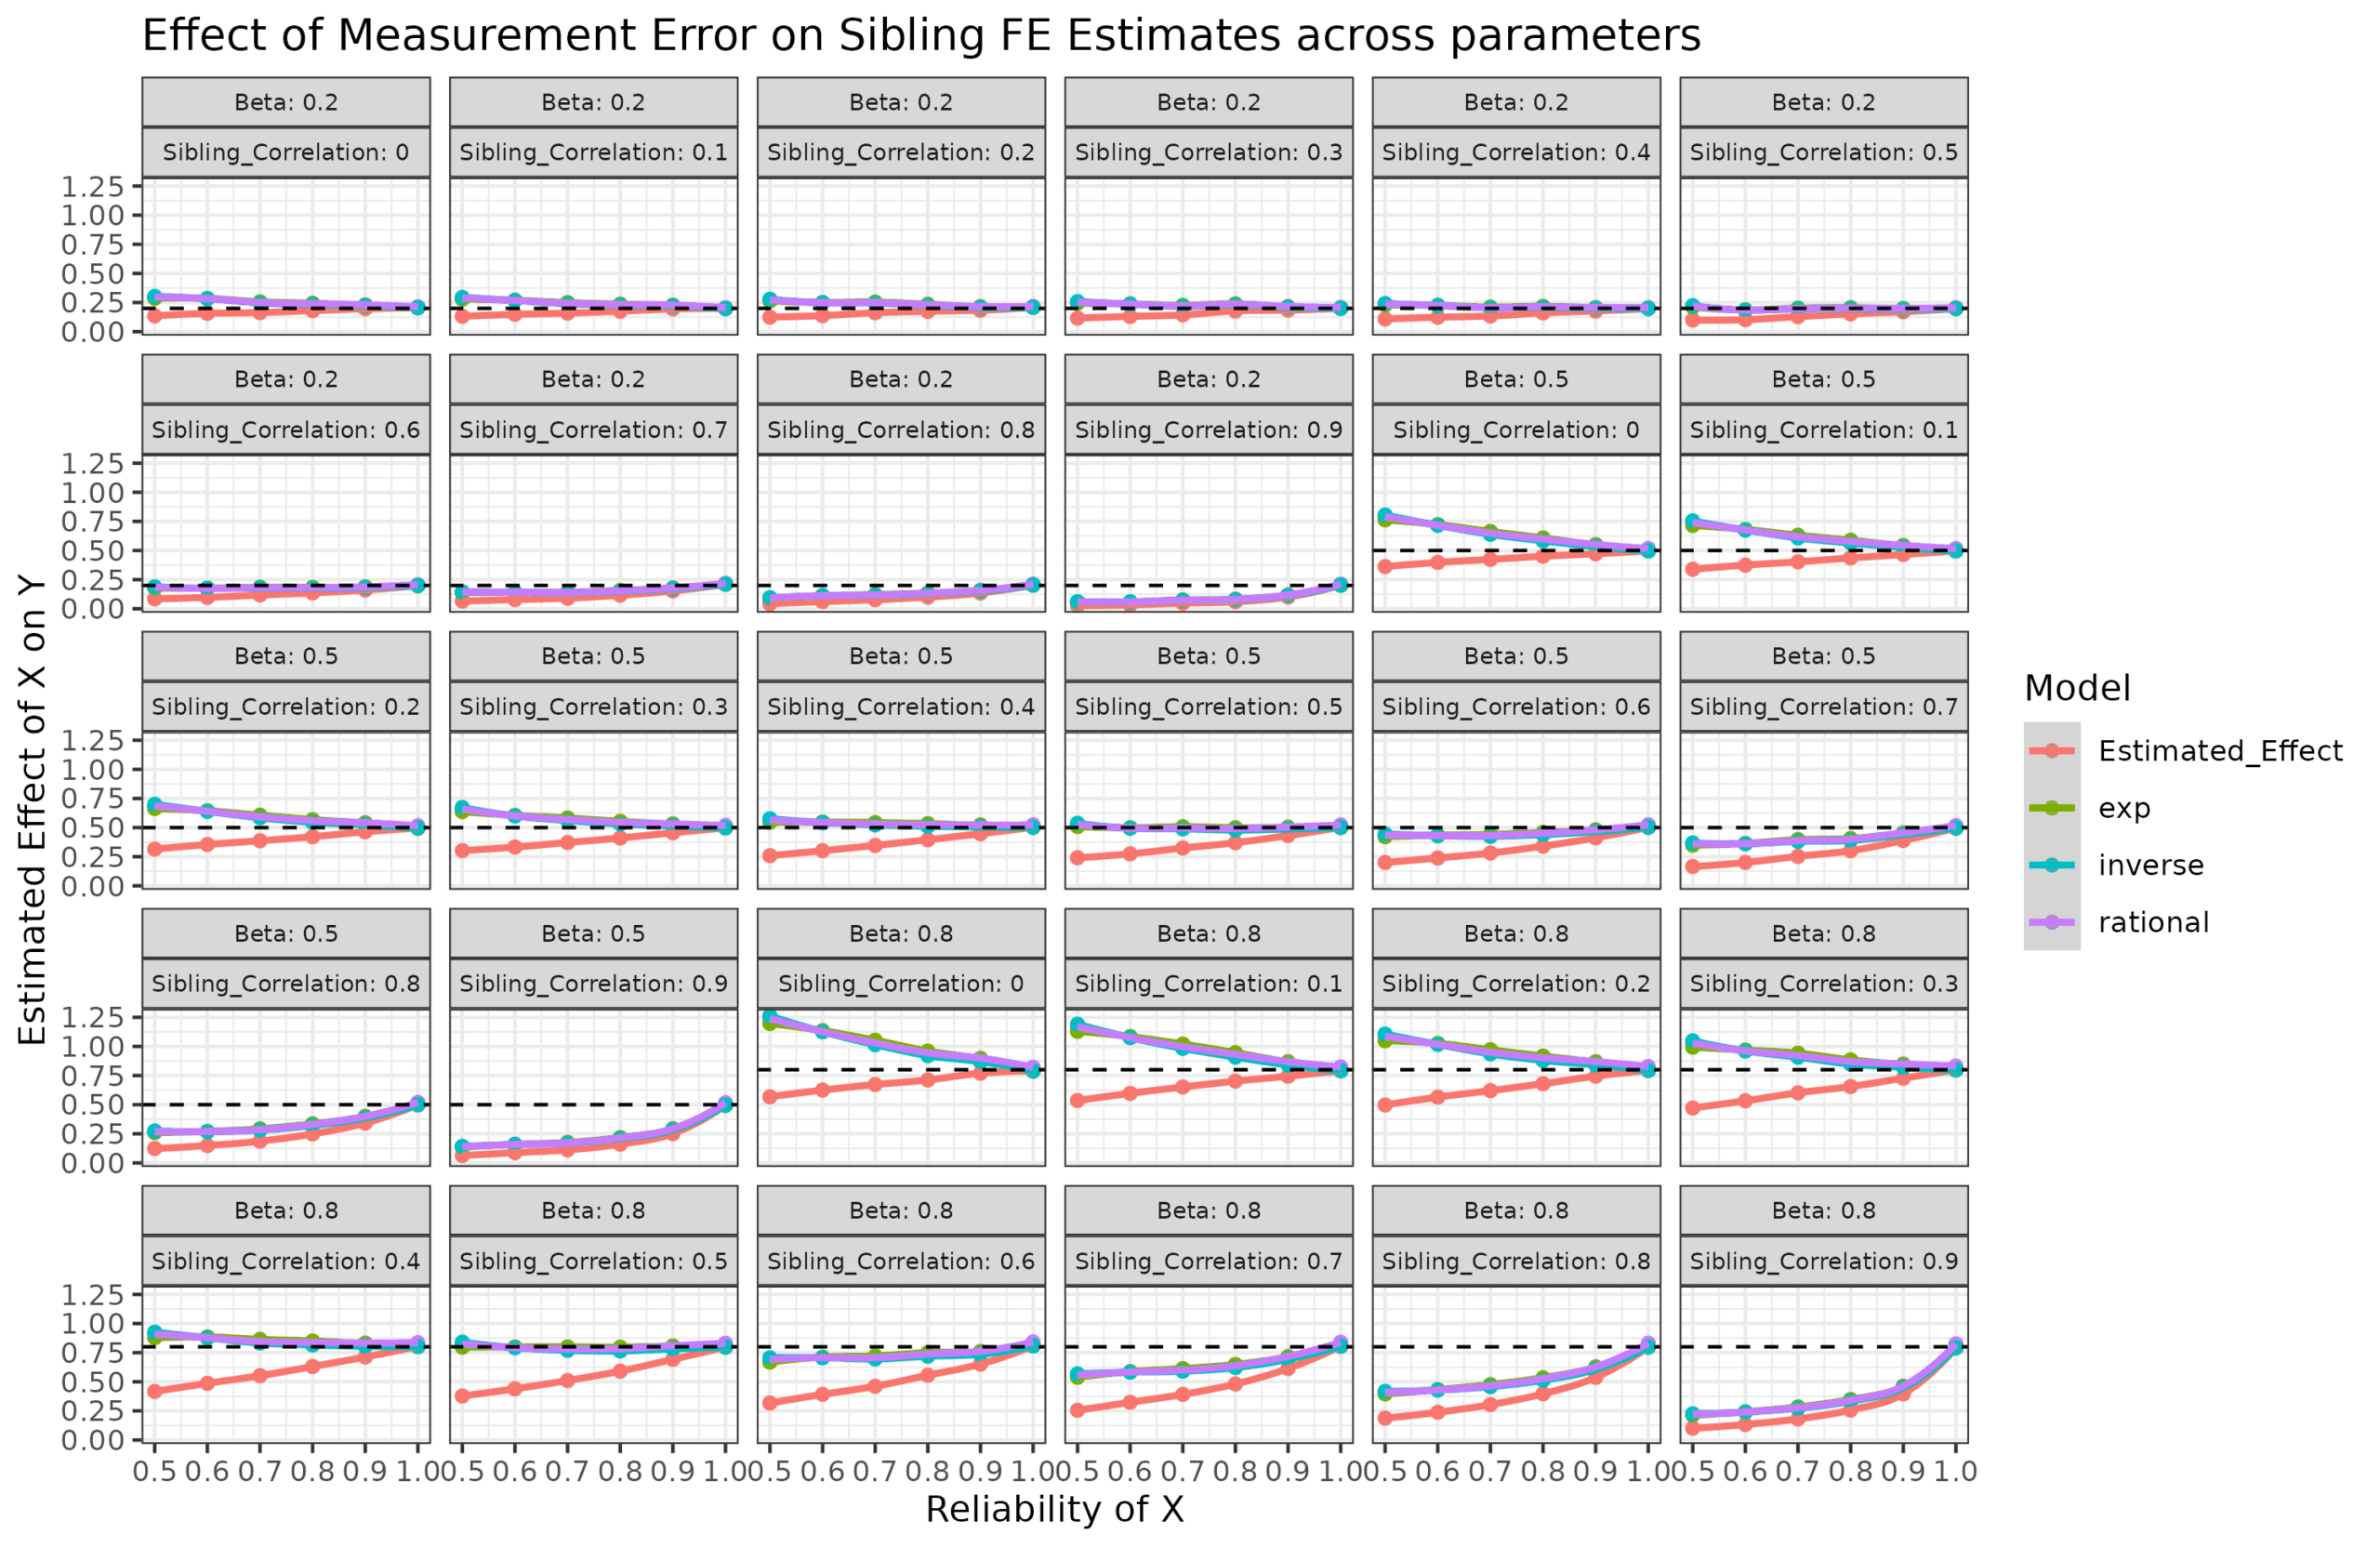
It’s a bit chaotic, but look at the facet texts. Beta = 0.5 sibling_cor = 0.5 is what we used to train the models, and their results are the same as before. However, the other plots show that the correction fails. The correction factor depends on the sibling correlation in X as well. The stronger the sibling correlation, the larger the bias. This is because when siblings are closer in value in X, even small random errors in X can cause them to dramatically change relative positions. Since the fixed effect model depends on estimating relative positions on X within families, this means the beta will be strongly biased towards 0.
I tried some more fancy models taking both variables into account, but didn’t find anything worth reporting. If anything, the fancy mathematical models were inferior to an uninterpretable spline interaction function [Correction_Factor ~ ns(Reliability, df=4) * ns(Sibling_Correlation, df=4)]. Using such a function’s correction is probably good enough in practice though. Here’s my models accuracy measured in MAE and RMSE terms:
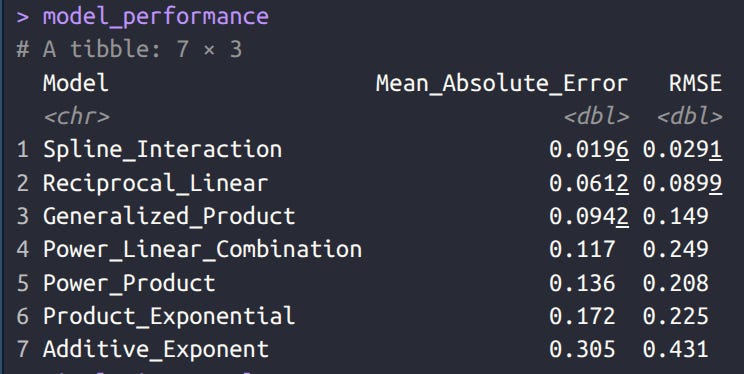
In human language, the model is trying to figure out the value you have to multiple the observed sibling fixed effects beta by to recover the true one (the correction factor). On average, the split model gets this value wrong by 0.0196, which seems tiny (r² = .983). One could presumably obtain a slightly more accurate model by using more parameter values and more replications. Here I used:
sibling_correlations <- seq(0, 0.9, by = 0.1)
reliabilities <- seq(0.5, 1, by = 0.1)
betas <- c(0.2, 0.5, 0.8)
So can we apply this to the sibling models reported by Herasight? Not even. Their models don’t concern measurement error in the predictor (the polygenic score), rather in the outcome variable (intelligence). This is opposite situation from the situation I considered. The matter is complex because the effect of reliability/measurement error in the outcome variable depends on whether the variable is standardized (which they are here), which makes simulation quite difficult to do correctly. I think I was able to figure it out and these are my results:
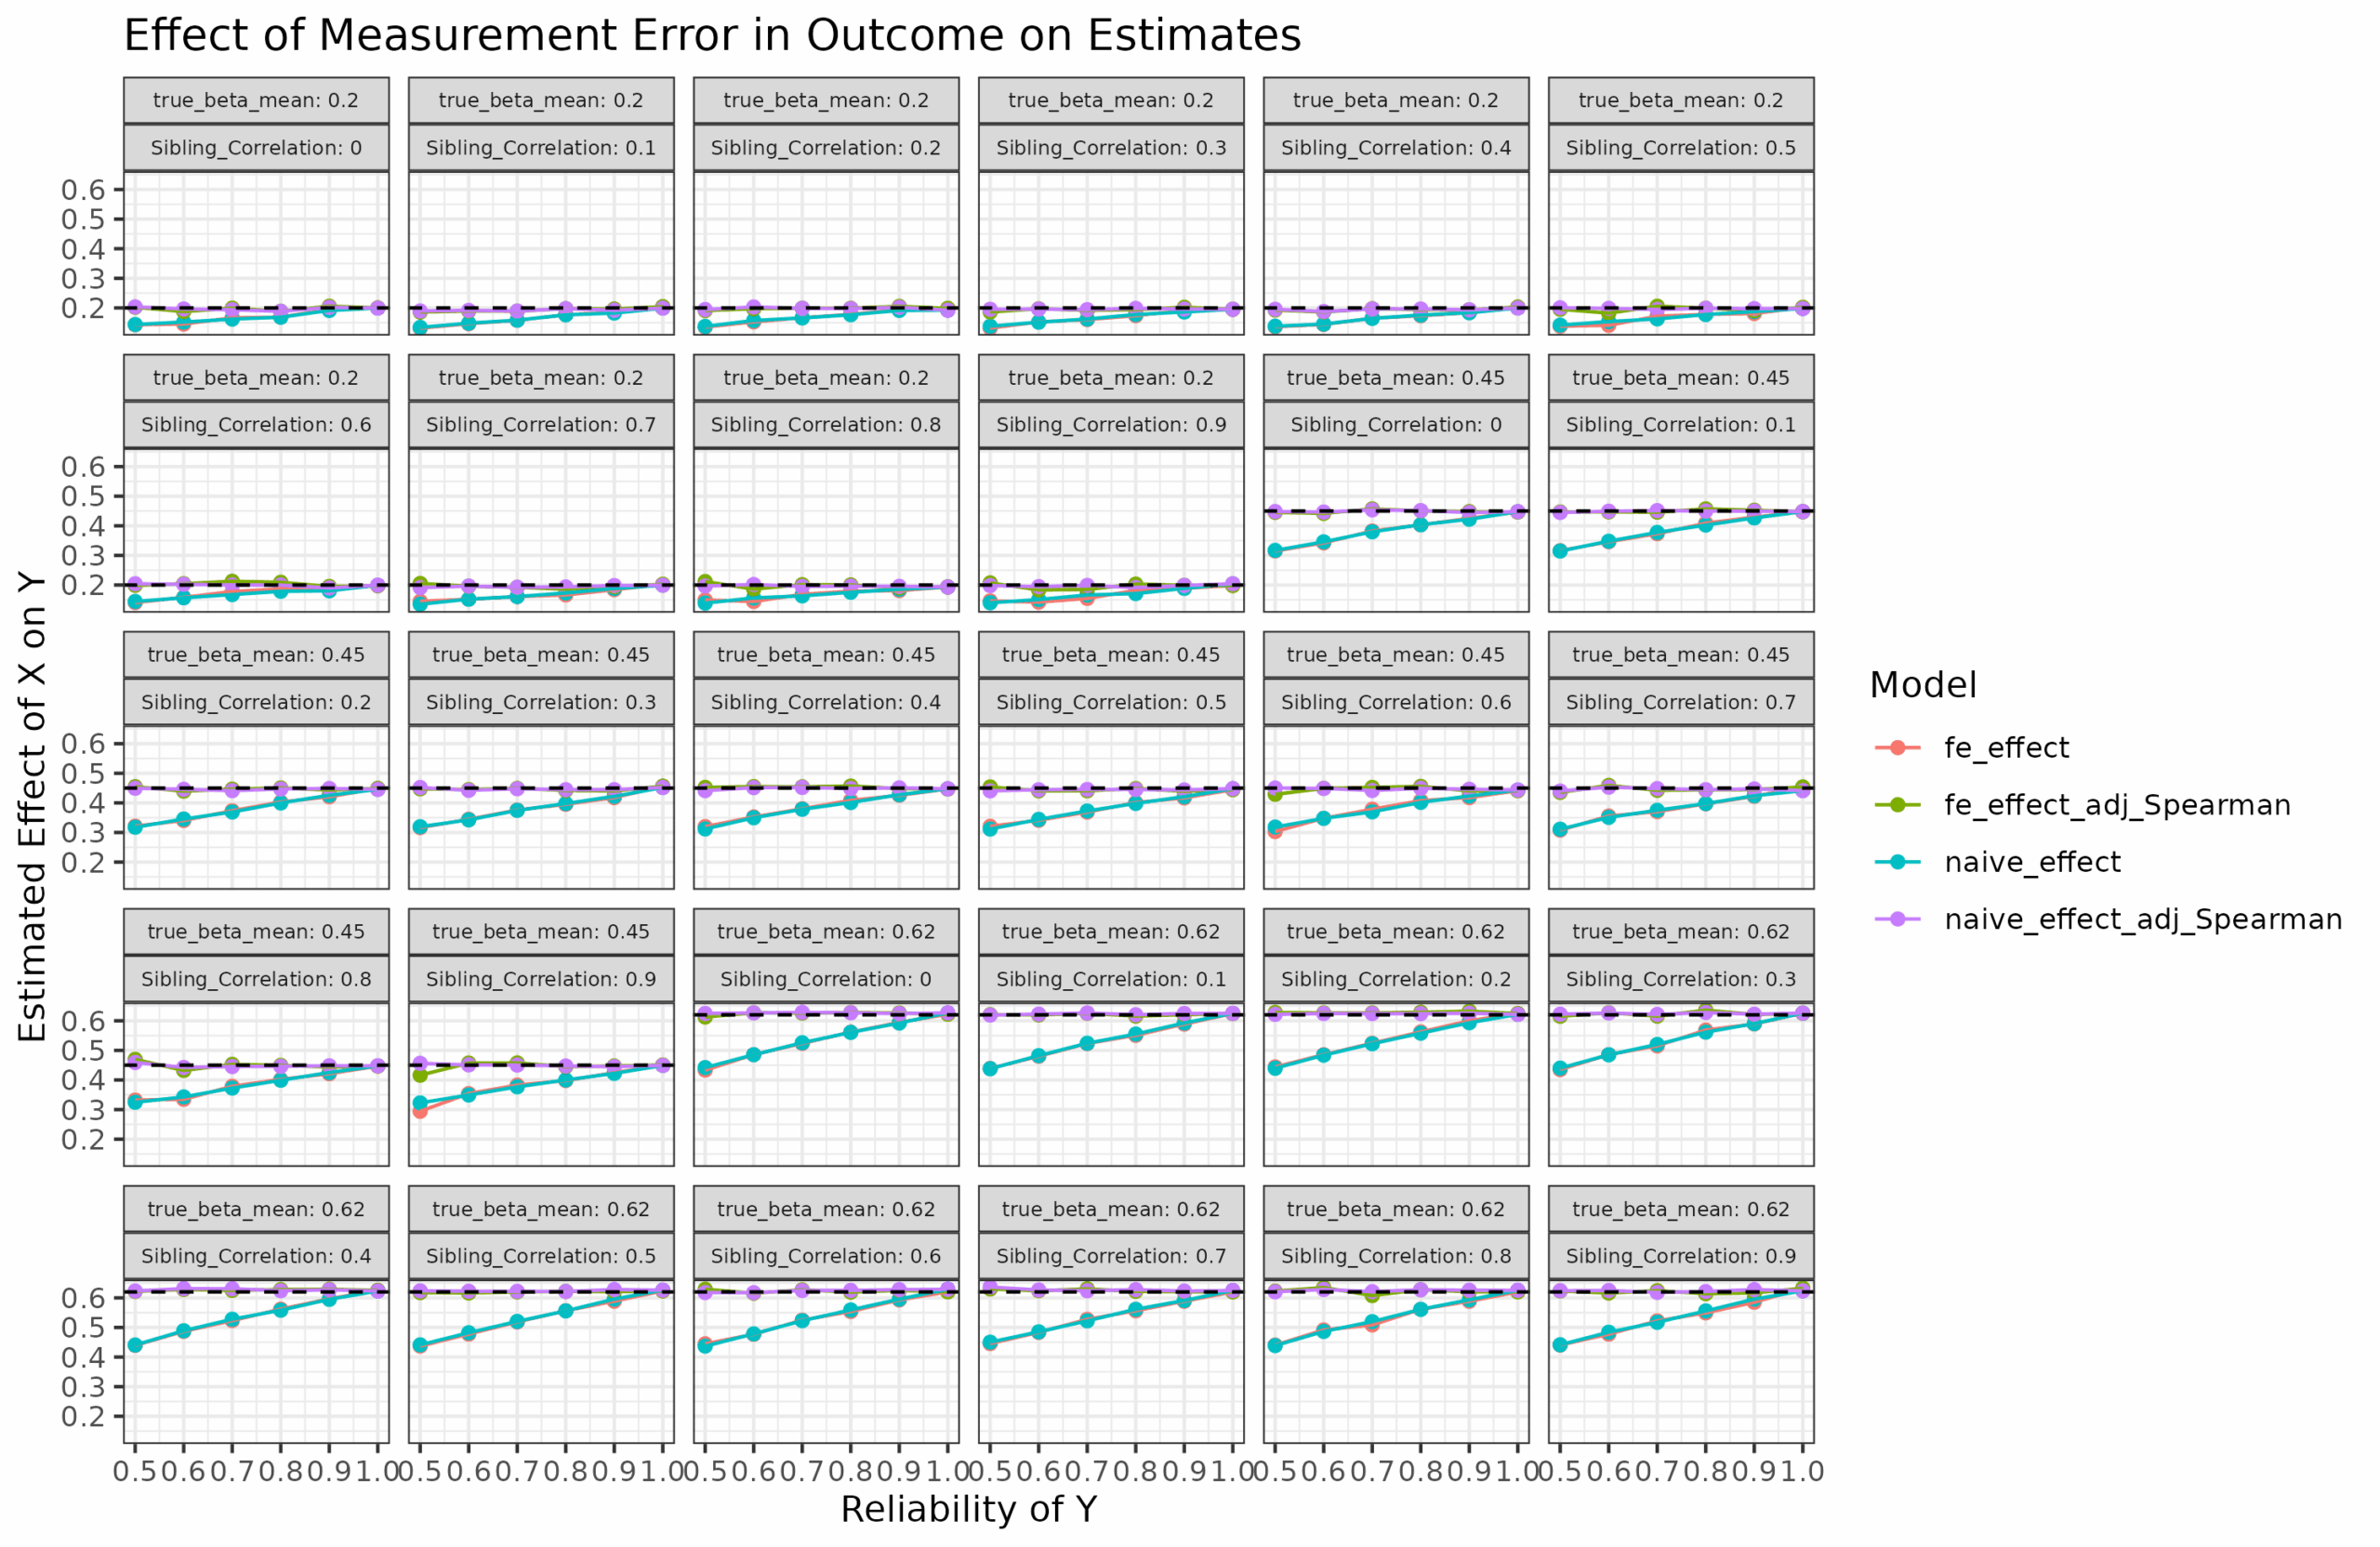
So for measurement error in Y with unit-variance, it turns out that sibling models do not have additional bias as far as I can tell. The Spearman correction formula is correct for both estimates as well. I don’t know if Herasight also did this simulation study, but it appears their approach is correct statistically speaking.
In summary then:
Measurement error is problematic and more than usual problematic for sibling fixed effects.
Measurement error in the X variables causes a larger bias, and Spearman’s correction is insufficient. Frisell et al 2012 correction is wrong as well. A spline interaction model based on the sibling correlation and the reliability is able to provide a very good approximation of the correction factor.
Measurement error in the Y variable is relatively non-problematic. If the Y is not-unit scale, it can be ignored as it does not bias the slope. If the Y is standardized, the Spearman correction formula appear to work correctly. The amount of bias does not depend on the fixed effects or the sibling correlation, surprisingly.
I feel like if you could just collaborate with a statistician or econometrician who deeply knows the theory of errors-in-variables models, and would just need to get up to speed on the sibling regression model, the two of you could derive a theoretical correction factor for the data generating process that you assume here.
I think equation 8 is correct. Their proof in the appendix checks out. The SD correction is for simple correlations, but they're computing a correction for a beta. If you take the formula for correcting a correlation for attenuation, and you convert both sides (correction and observed) to betas using r= (sd(x)/sd(y))B, then you recover equation 8.