How many people can solve this kind of problem?
Yet another exercise in frustration of 'open datasets'
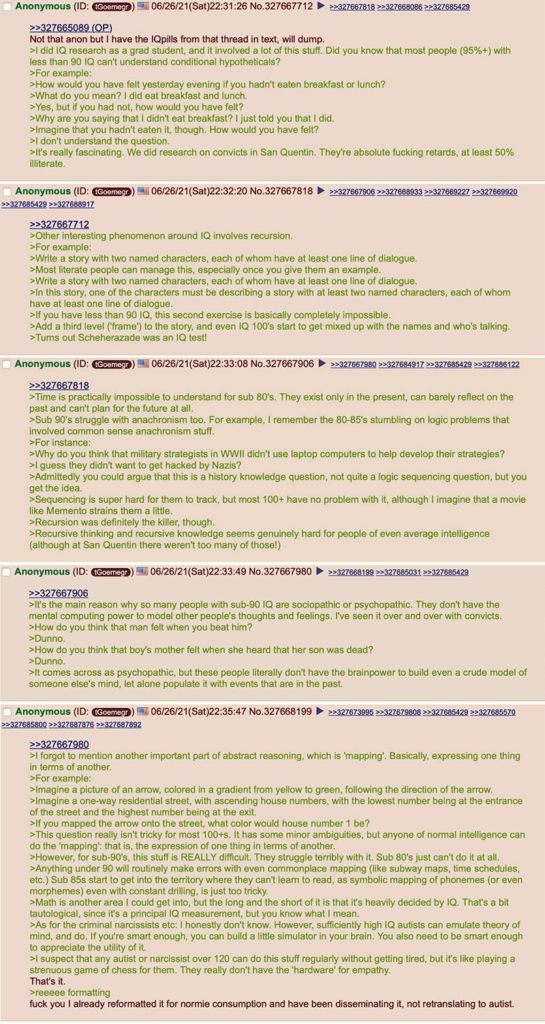
There's a thread on 4chan that's been spread all over Twitter, Reddit etc.. It concerns some guy who supposedly worked with inmates and reports how poorly they are able to deal with relatively simple problems:
While interesting reading, you really have to ask yourself: is this real or not? Who knows, that's why you shouldn't be posting this stuff. I imagine these are much too extreme.
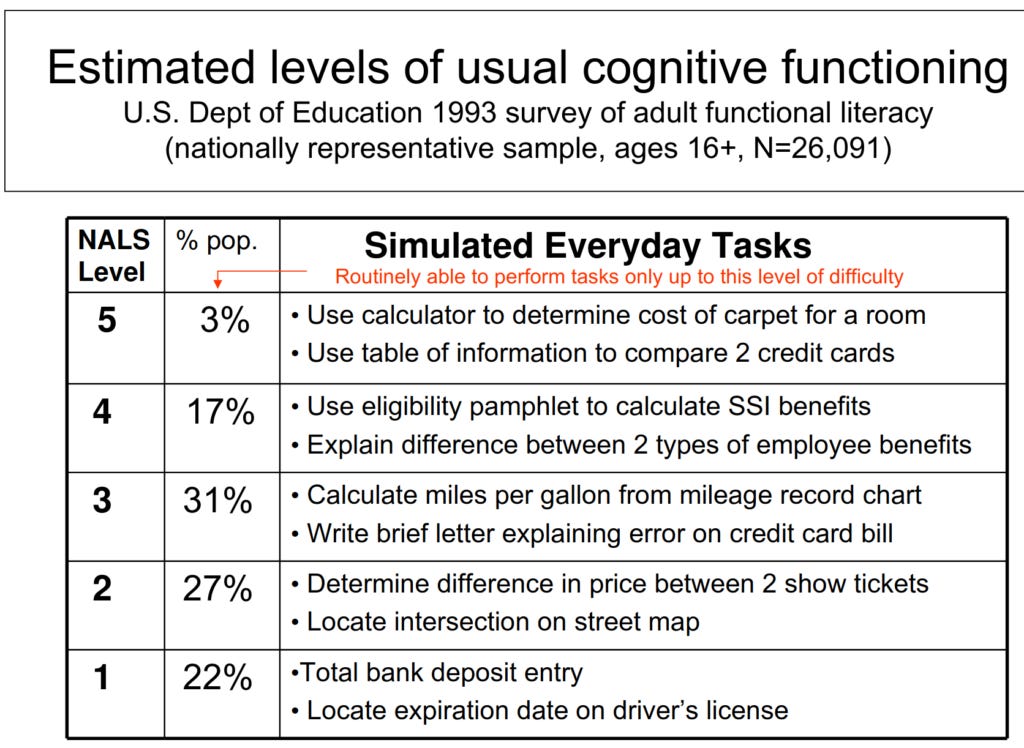
But there are standard places to look if you want to know how the typical westerner performs on tasks. You can look up items in PISA or TIMSS, for instance. Anatoly Karlin covered the PISA 2012 math item examples in a prior post (The idiocy of the average). Linda Gottfredson's go-to choice is the NALS, the National Adult Literacy Survey. It's not really a literacy test, it's a general intelligence test using word camouflage. It was carried out by the US government in 1992 or so, sampling some 26,000 adults. Here I will reuse the item examples used by Gottfredson in her 2009 presentation Intelligence as Warp and
Woof of Human Affairs. In general, her website of public documents is a treasure trove, and I used to teach myself intelligence research back in high school (gymnasium) using these writings.
Now, I would have liked to post a bunch of items, with a % of persons getting that item correct (the pass rate). Fact is, after spending 5+ hours on this task, and trying the PIAAC dataset too (also public), it proved... impossible. I know, seems crazy. NALS and its successor NAAL are both public datasets, so should be easy right? No because the data are in a bizarre format. Something something insane government decisions. See here for fuller story. PIAAC sample items appear to be not used in their actual data collection, and hence don't have pass rates I can report or easily calculate.
So, here's another approach. NALS, NAAL, PISA, PIAAC etc. all use the same weird classification scheme, where items are grouped into 5 (6) levels based on difficulty. Here's the NALS description:
PIAAC has the same hierarchy listed here.
So when they say an item in is category X, it means people in that group of the population can solve the item about 80% of the time, but that same group cannot solve items at the next level. Why this system? I don't know. In any case, we can approximate the pass rates of items by assuming lower levels solve them 0% of the time, and higher levels solve them 100% of the time. This is what an item with infinite g-loading would look like. Given these assumptions, the pass rates are:
Level 1 pass rate = 96%
Level 2 pass rate = 73%
Level 3 pass rate = 45%
Level 4 pass rate = 17%
Level 5 pass rate = 2%
We can check that these approximations are accurate using the pass rates computed for the American data, and the reported item level. E.g. the item e.g. C301C05S/SGIH is reported as "below level 1", and it has 96.3% pass rate. Dutch Women (C311B701) is level 1, and has a pass rate of 90.8%, Library Search (C323P002) is level 4 with a pass rate of 24.4%. These are only approximate, and to be fair, I only spent an hour trying to work out the nonsensical numerical conventions of PIAAC. (If you must know, they use non-standard IRT parameters which they set at mean=300 and sd=???, and this also differs from the sample mean which is not 300, not even in the global average, and so one has to guess at their implicit unstated conversions to get it right. I find myself asking WHY repeatedly.)
Here you should remember, that in real life, there are no strict thresholds for intelligence and solving tasks:
There is no task in real life where everybody under IQ of X fails 100% of the time, and everybody above IQ of X passes 100% of the time. Every task (item) follows a curve that looks something like the red line.
Here's some NALS items
Level 1 - about 96% of adults in USA get this right
Level 2 - about 73% of adults in USA get this right
Level 2 another example - about 73% of adults in USA get this right
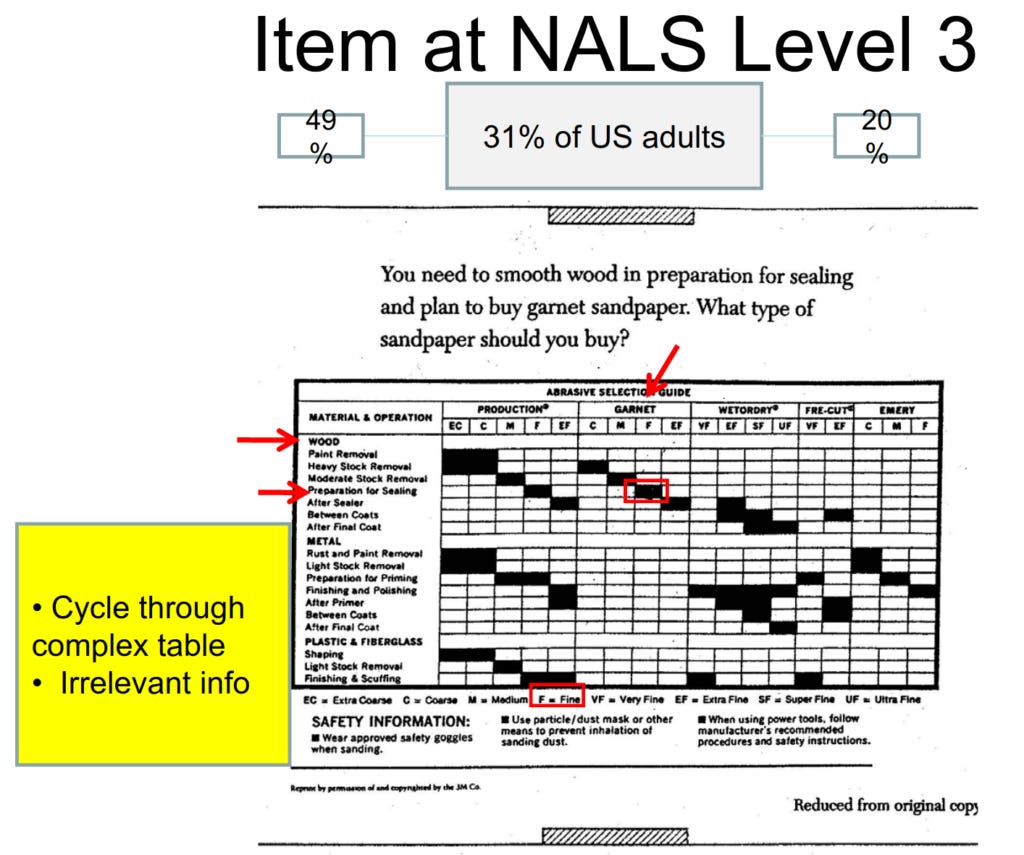
Level 3 - about 45% of adults in USA get this right
Level 4 - about 17% of adults in USA get this right
Level 5 - about 2% of adults in USA get this right


Assuming the best case scenario where this test directly correlates to IQ (SD=15), passing NALS3 = 102+IQ, NALS4 = 114+IQ, NALS5 = 131IQ? If so then are there similar "basic skills" tests for the 2010s or 2020s using "video games"?
Do you have the answer key? What for example should my paragraph contain, just the trend as a whole amongst the different groups, or should I get in the nitty gritty of it. For example, on the last question of the last item, should I say there are almost three times as many parents as there are teachers that agree that the school doesn't let parents participate in school activities but as a whole the sentiment is not overwhelming amongst the two groups with about one in roughly 5 parents agreeing and only 1 in around 13 teachers as well.