
Indian average intelligence: not a mystery
Indians in India ~75 IQ, Indians in USA ~101 IQ.

Talking about the current thing on X often results in viral posts:
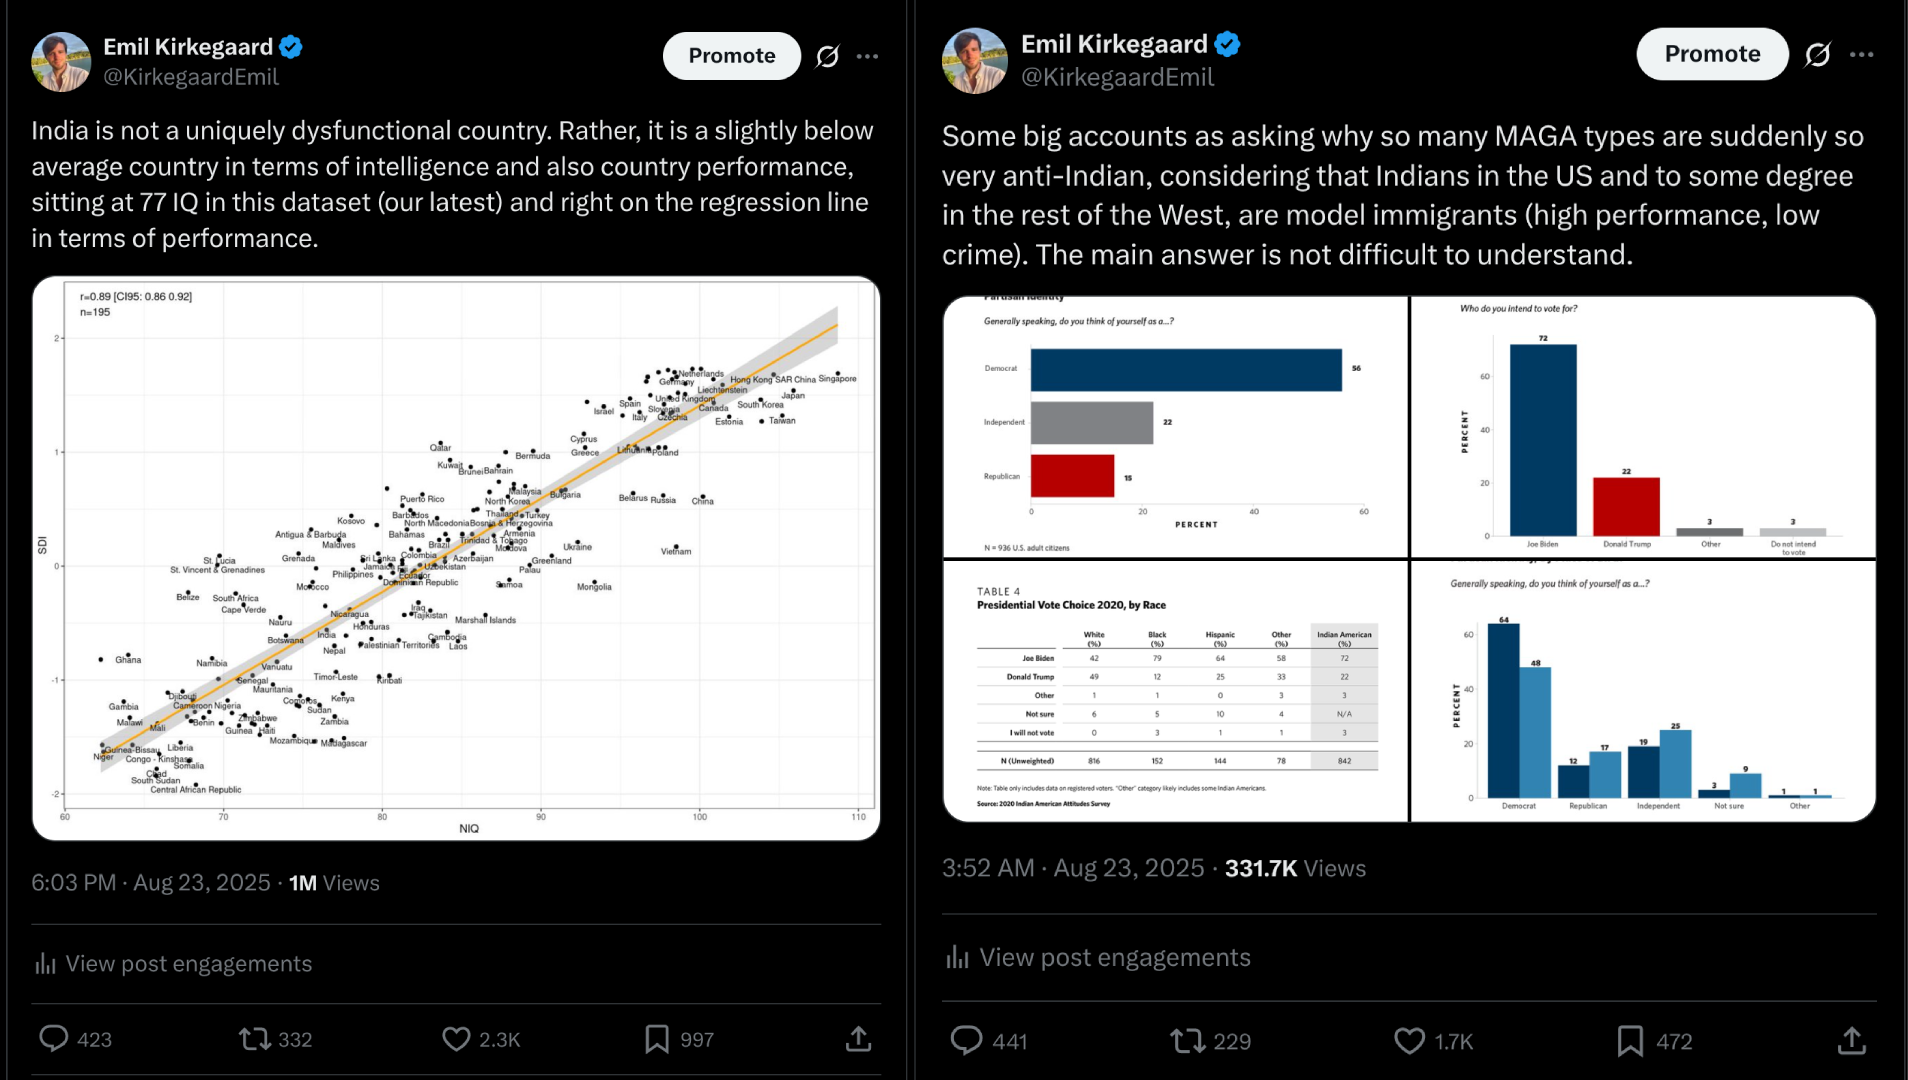
The replies are full of hostility for a variety of reasons, one of them being that Taleb posted it, but hostility comes from multiple angles:
Indian haters, mainly American online right-wingers who think Indians are dirty, dishonest, ethnocentric etc.
Indians who are unhappy and in denial about their group's intelligence average in the typical ethnocentric way
Left-wingers who hate national IQs
So I guess it made everybody unhappy while being true, which is quite optimal I think. My last post was about explaining why American (and other) right-wingers dislike Indians chiefly because they are a left-wing ethnic group in the West, influential (because elite because elite-selected) and currently the center of attention due to H1B visas and record immigration numbers to Anglo countries. In this post, I will look at estimating the Indian intelligence, that is, addressing (2-3) above.
Estimating a given ethnic group's IQ is on the surface a relatively simple matter. You just find every study of average IQ done on that group. If the ethnic group is a national group, as Indians are, then you can begin with national studies of intelligence in that country. The most sensible place to start is looking at the actual academic literature on the topic. Becker's database of studies provides the go-to starting point. These are the studies in his collection (database version 1.3.5).
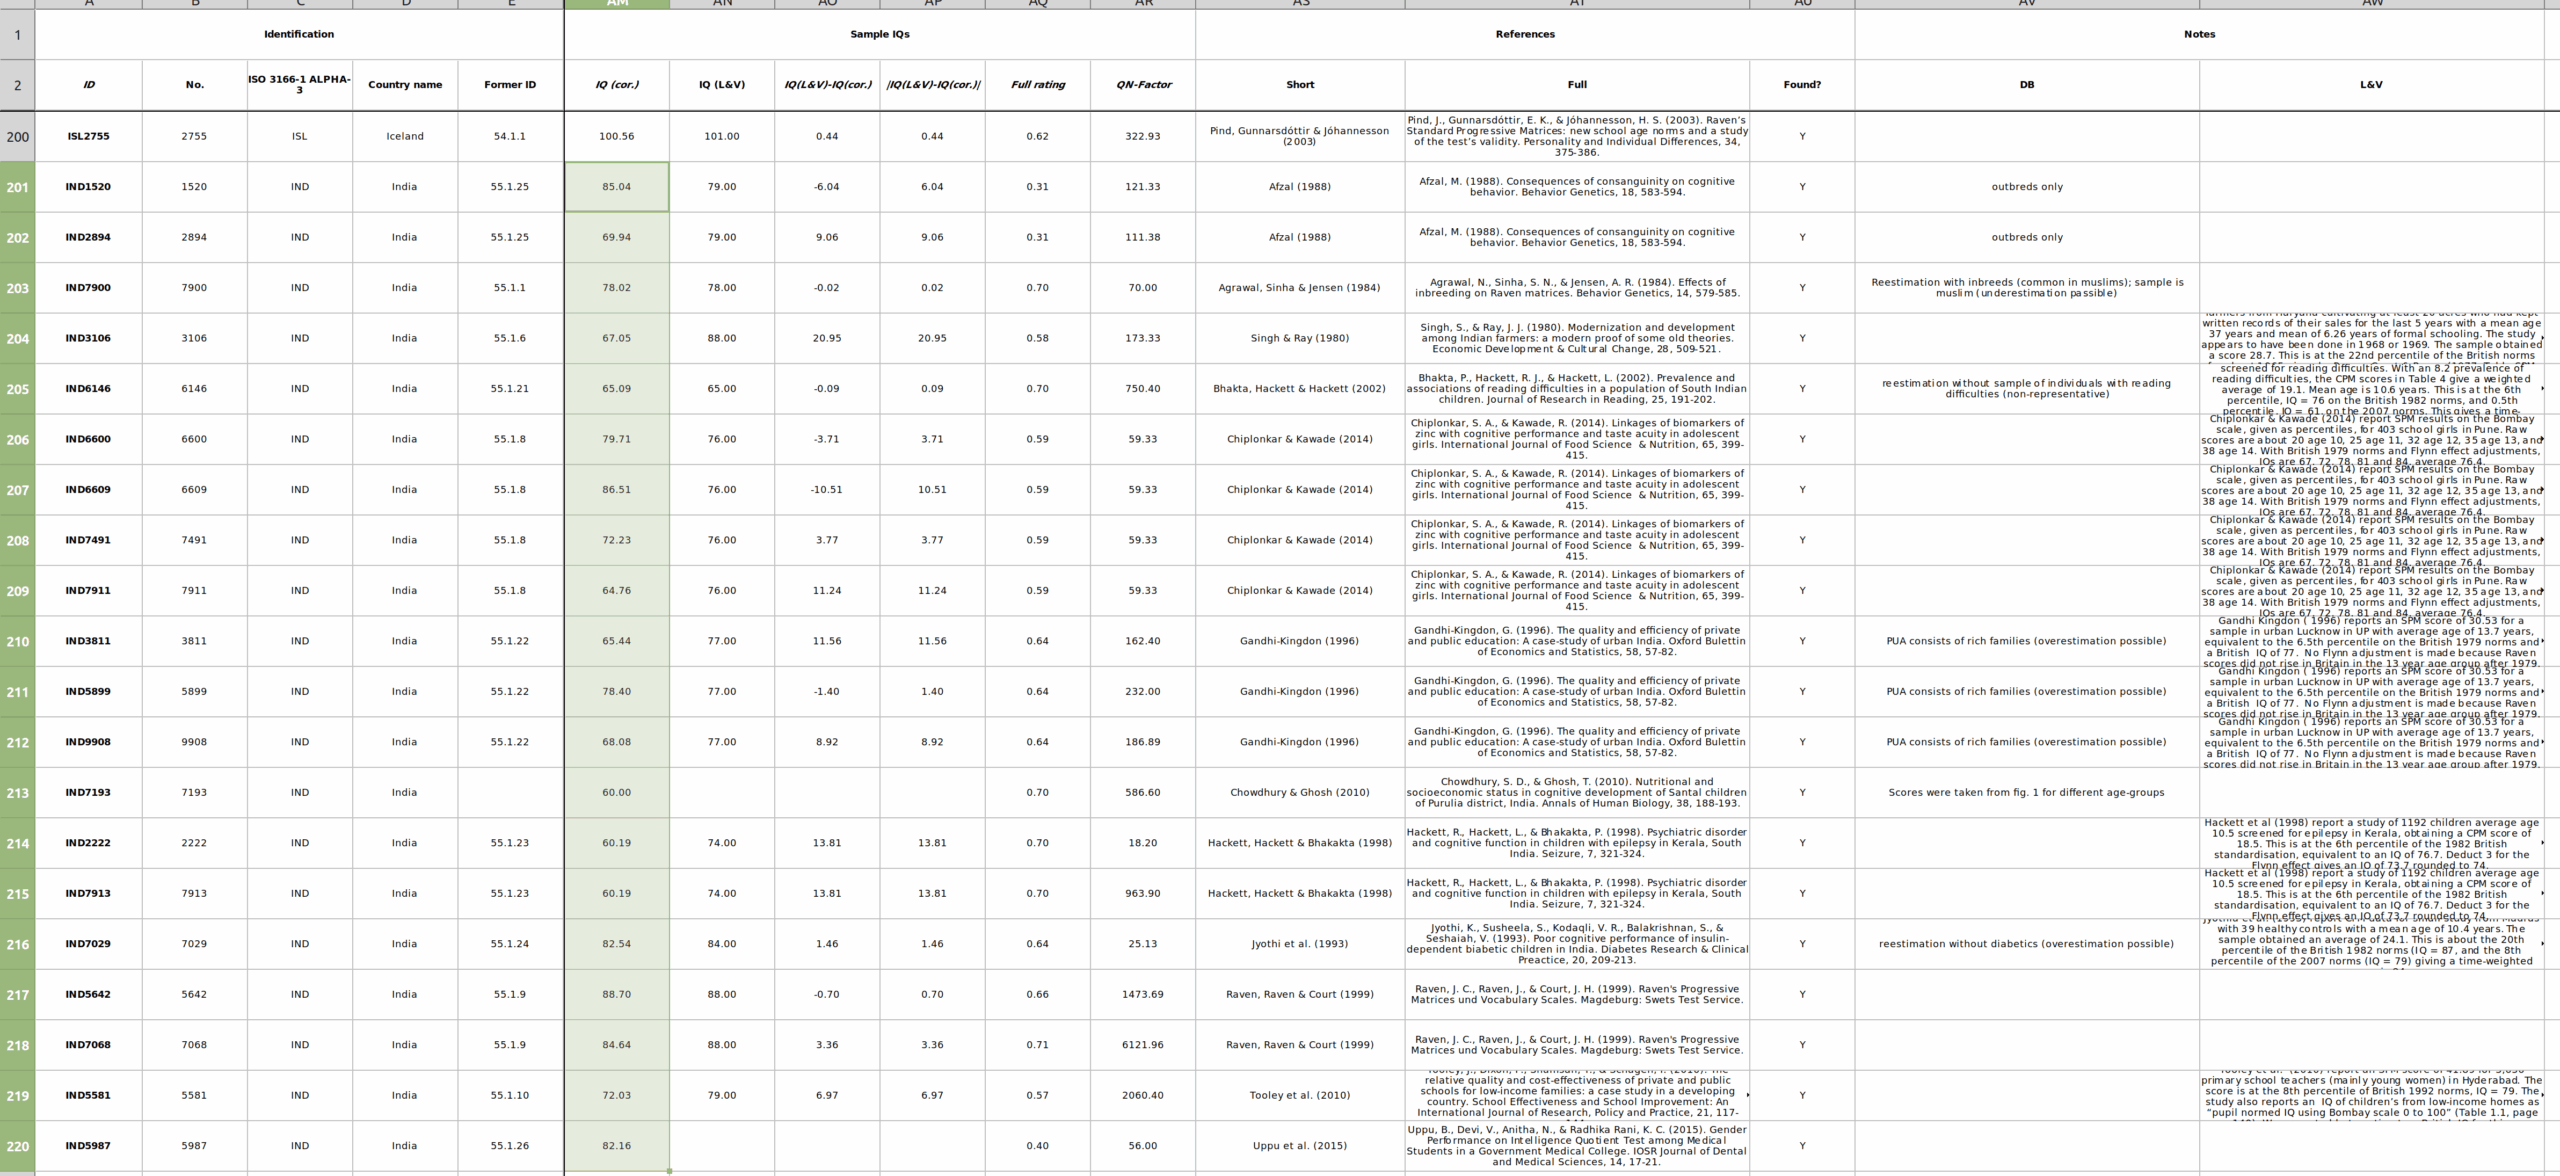
This database is fully transparent, so you can track every study he found and used, as well as the corrections done to them, or subsets of data used. In this case, we see that there are 20 samples given which produce an unweighted mean of 73.5 IQ, and a quality and sample size weighted mean of 76.1 IQ. The samples come from the following 12 studies:
Raven, J. C., Raven, J., & Court, J. H. (1999). Raven's Progressive Matrices und Vocabulary Scales. Magdeburg: Swets Test Service.
Some studies contributed more than one sample because they contained various subgroups, whether by age or some health condition. Most of the researchers involved were Indians themselves judging from the names.
Some of the Indian nationalists who don't like the datasets or their conclusions and have leveled what they believe to be good criticism:
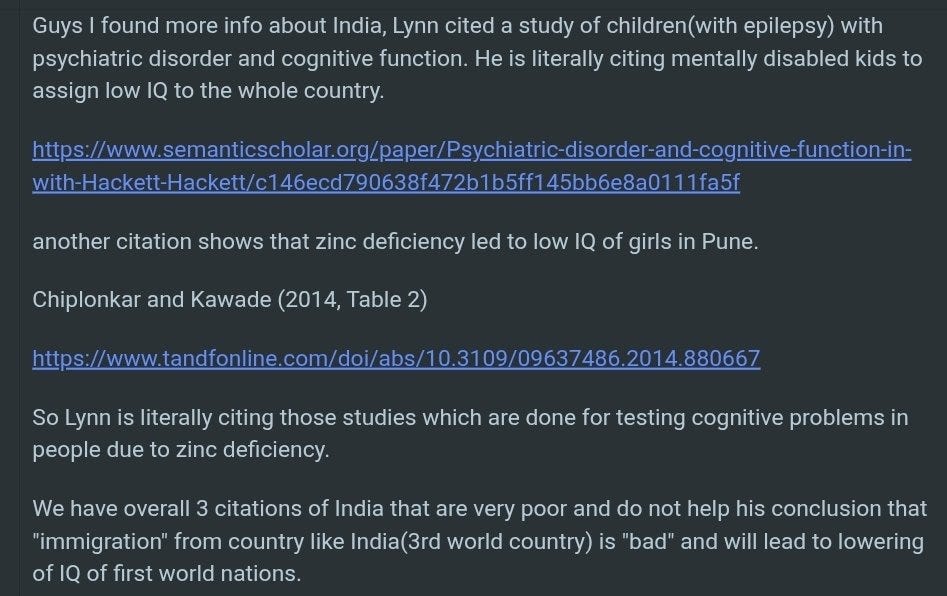
This kind of thing is common with poor countries. Why cite data from a study of zinc deficient children? Because that's the data that exist. Zinc deficiency is common in poor countries, so these children are not particularly unrepresentative. We can look up a global study of zinc deficiency from 2012 and it found that ~30% of Indians are zinc deficient:
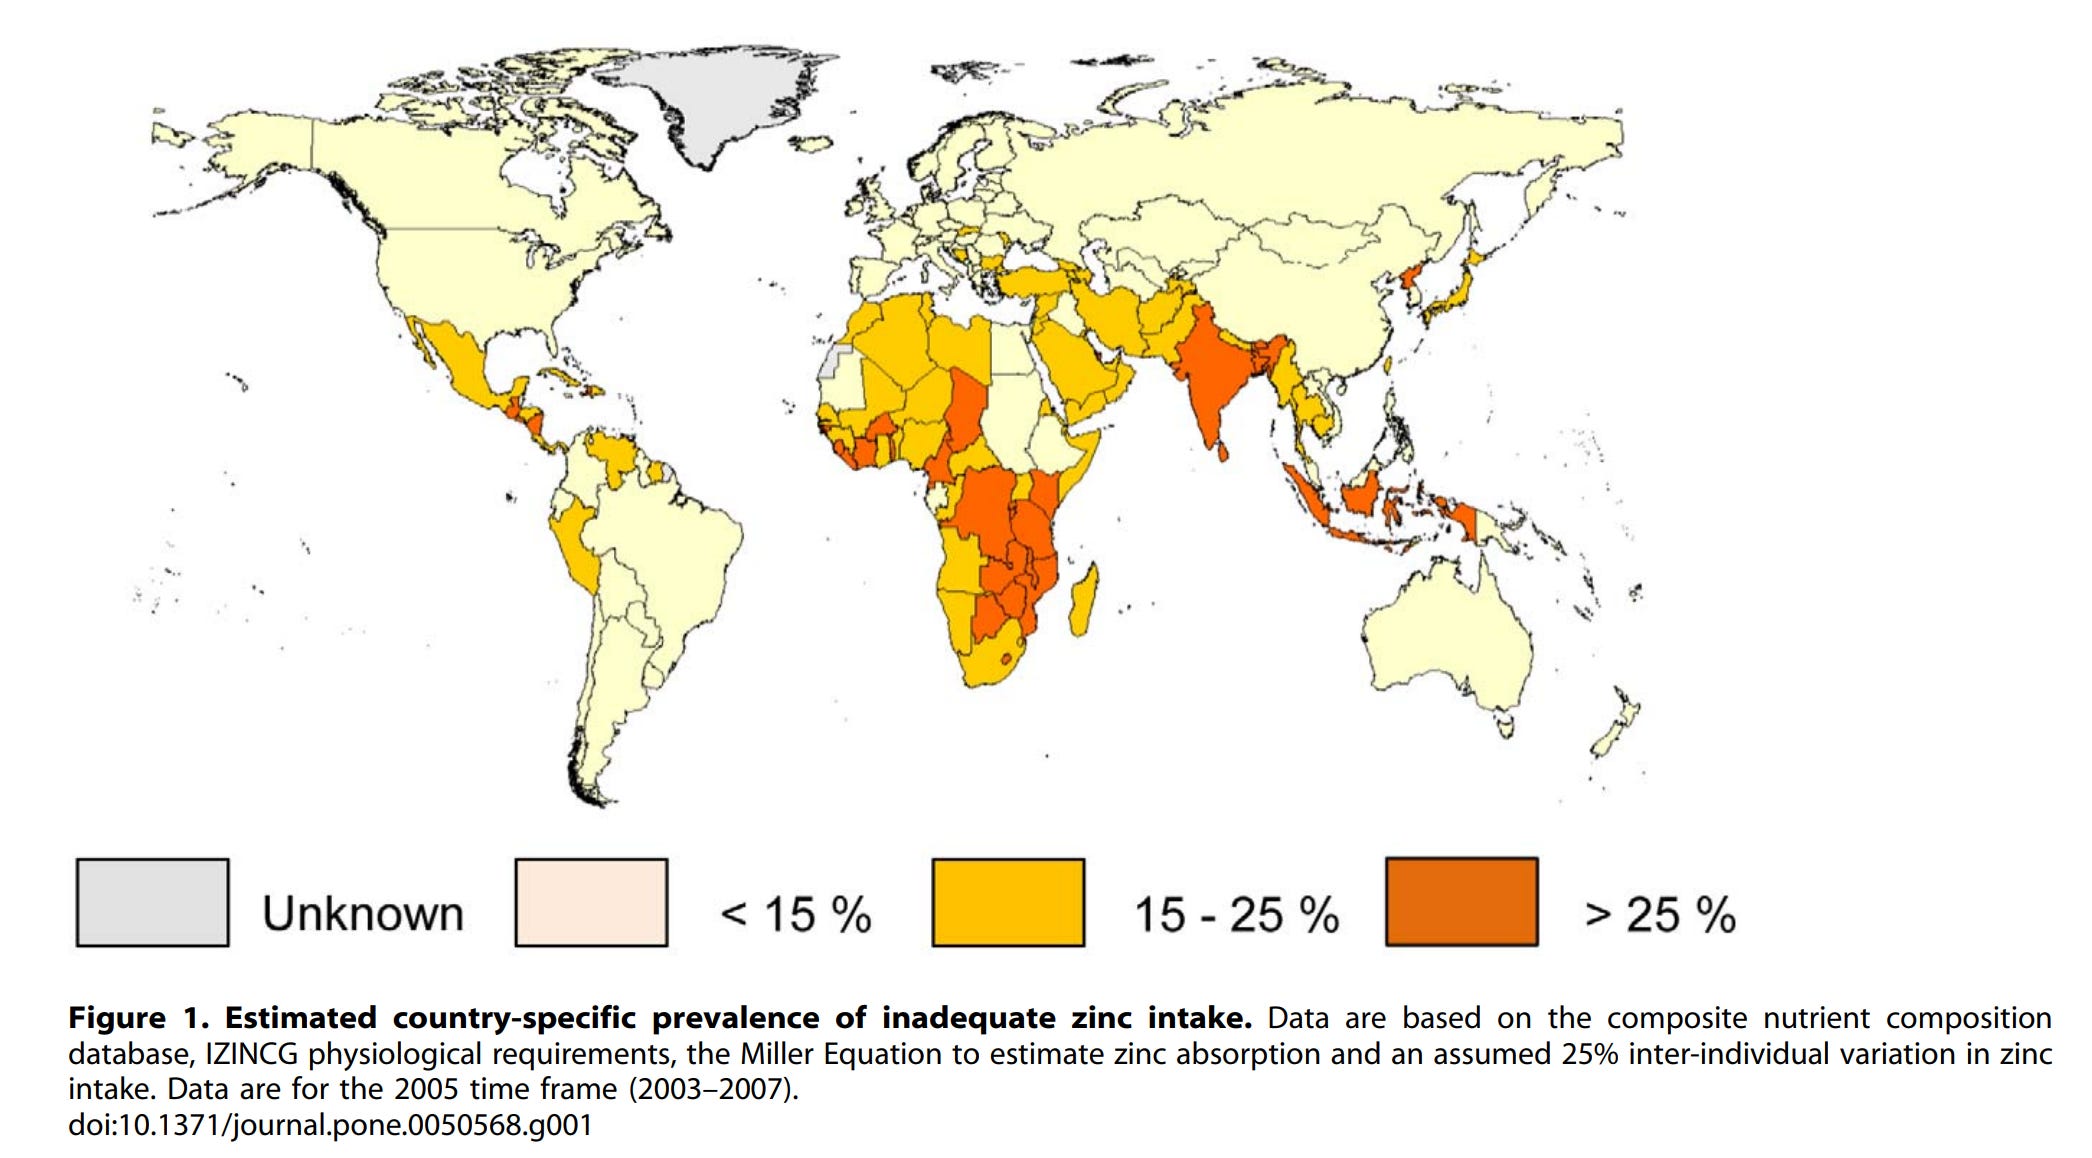
Obviously, then, one cannot be accused of cherry picking unrepresentative poor people if this problem is in fact common in that country. One must use roughly representative studies which in poor countries means those with various health deficiencies uncommon in developed countries. We can name this the Wicherts fallacy, after Wicherts et al made the same mistake a number of times in their 2010 series of papers (with respect to Wicherts who is a great researcher). In any case, the simple mean of the Chiplonkar & Kawade samples is 75.8 IQ and the mean of the other samples is 73.0 IQ, so the sample they set out as being particularly low status and unfair is in fact above the average of the other samples. This kind of lazy criticism is the norm from such people.
But we don't have to be content with the studies using Raven (the majority) or the Wechsler scales (a few studies), we can also look at the PISA tests. India participated in PISA only once, in 2009. The mean scores were equally low:
Two Indian states participated. You could then claim these are unfairly sampled. Are these the poorest states? Here's a map of Indian human development index by state from 2006, close to the collection of the PISA data:
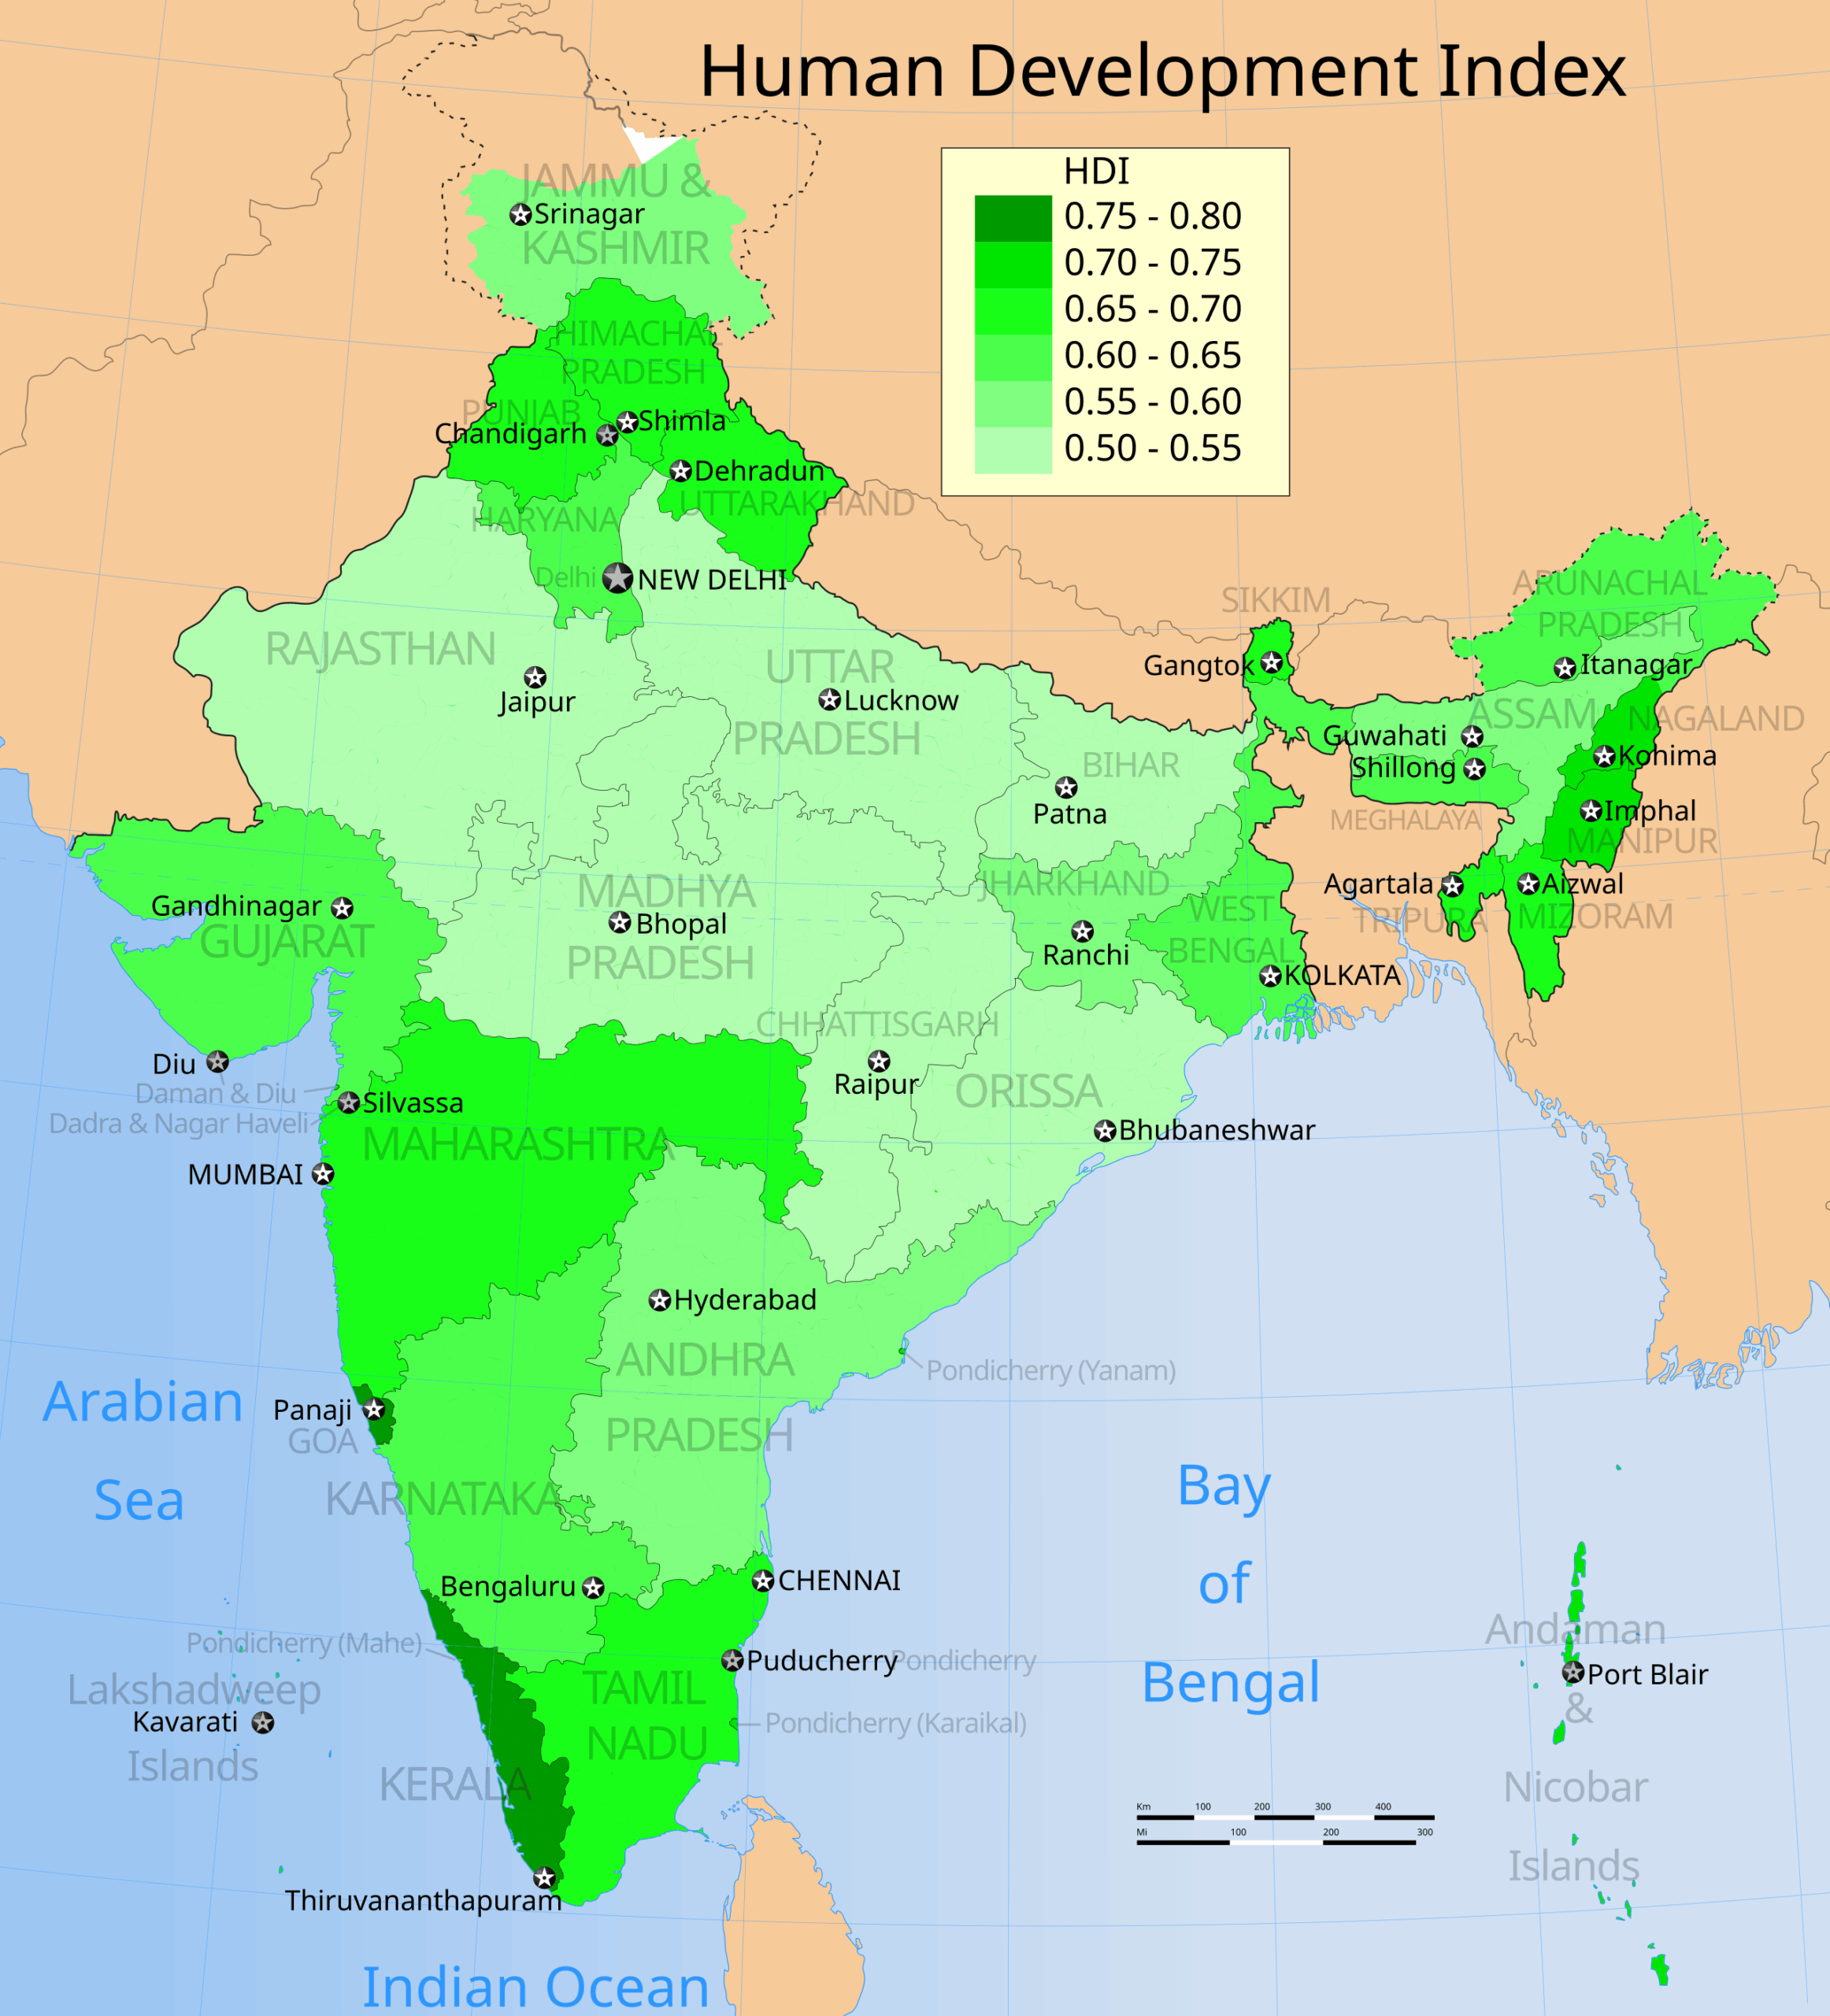
In fact, these states were above average, so the sampling bias is at least prima facie against the claims. The HDI scores were 0.692 and 0.715 compared to the Indian average of 0.644 (2022 data). We can confirm this impression by looking at regional testing data from India. Lynn and Yadav published a study on this in 2015, and I reanalyzed their data to produce this plot:
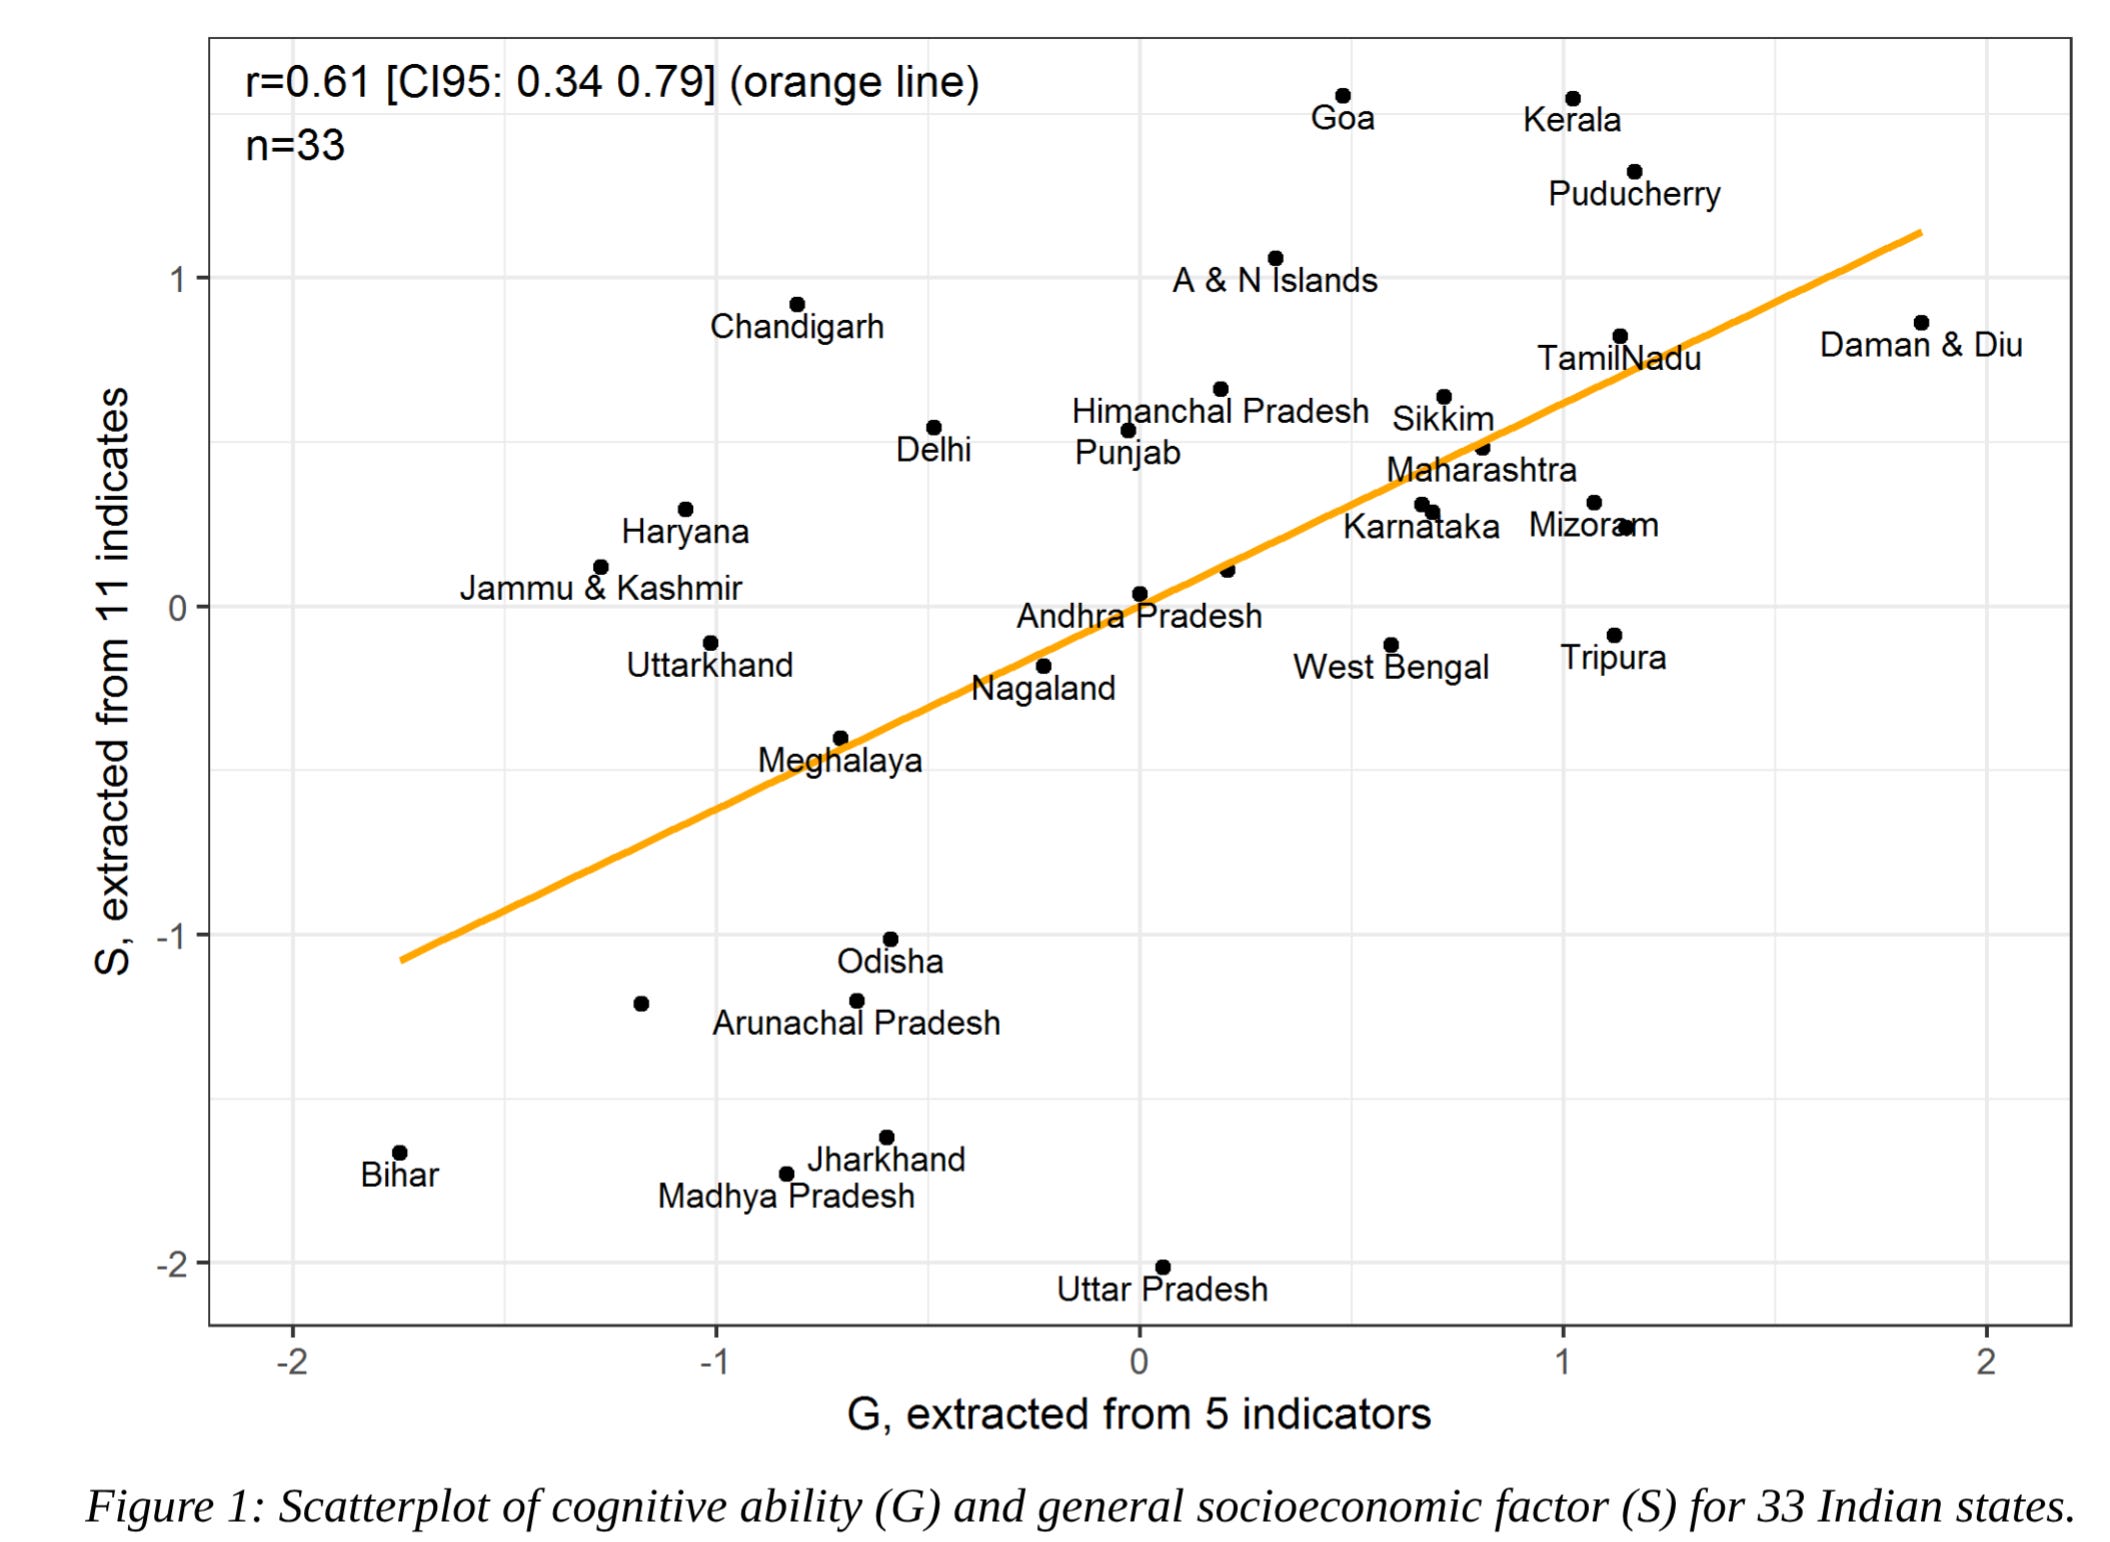
So we confirm that Tamil Nadu and Himanchal Predesh were above average in both test scores and socioeconomic development. As such, this means the PISA data is slightly overestimating the IQ of India. Speaking of that, the simple mean PISA score was 336, against a Western mean of roughly 500 and a standard deviation of about 95. As such, we can calculate that the Indian IQ based on PISA tests without adjustments was about -1.72 z, or 74.1 IQ. Becker calculated a value of 73.6 IQ.
India also sort of participated in the TIMSS in 2003. They didn't particpate in the main sampling, but they reused some of the items in a large sample (6000) shortly afterwards. This data was analyzed by Das & Zajonc 2009. The sample was great by poor country standards:
We use data collected in 2005 as part of a larger World Bank study designed and led by Kin Bing Wu, and conducted by the Social and Rural Research Institute (SRI) unit of IMRB International.8 The study includes Mathematics tests of students in 288 schools in the Indian states of Rajasthan (in the West) and Orissa (in the East). The sample was designed by first selecting districts using population proportional to size (PPS) sampling, where, in the absence of data on school by-school enrollment, the PPS methodology was applied to the population of schools across districts. Following the selection of districts, the total number of schools to be selected in each district was arrived at and schools were surveyed in both urban and rural areas, as well as across institutional affiliation; that is, government schools, private unaided and private aided schools were all included in the sample
The data came from 2 states, but different ones than before. Their HDI scores were 0.610 and 0.652 in 2022, and thus very slightly below average Indian standards. The biggest problem was that the data came from secondary school students, and many students have already dropped out by that time:
There are three important features of the data. First, only children enrolled in school were tested. According to the World Development Indicators, gross enrollment in India in lower secondary schools is 53 percent, so this leaves out half the children of the relevant age-group.Consequently, there are intractable issues of trying to generalize the comparison of tested children to all children across countries. For instance, the gross enrollment in secondary schools in three other countries close to Orissa and Rajasthan in the world rankings varies dramatically, from 44 percent in Ghana to 75 percent in Botswana and 90 percent in South Africa. To the extent that marginal performers are less likely to be enrolled, comparisons of India with South Africa would therefore favor India; alternatively comparisons between India and Ghana favor the latter
The authors realized this issue. In practice, this would mean that one should subtract a number of points to correct for this slightly elite sampling bias. The authors provide examples of the low level of performance seen:
Mirroring the view that Bharat is drowning, absolute achievement, as measured by the percent correct score, is low compared to curricular standards. A significant fraction of children have not mastered the content categories expected for their grade (Table 1). By ninth grade, only 11 percent of children in Rajasthan and 17 percent in Orissa can correctly choose the smallest value from the set 0.625, 0.25, 0.375, 0.5, and 0.125 (Table 1, Q2). The question “A runner ran 3000m in exactly 8 minutes. What was his average speed in meters per second?” (Q7) stumps all but 23 percent of children in Rajasthan and 32 percent of children in Orissa. A simple test of division and fractions—“if 4 times a number is 48 what is 1/3 of the number?” (Q10)—is too difficult for 65 percent of children in Rajasthan and 64 percent of children in Orissa
The average level of performance is somewhat difficult to calculate to Western standards, but the authors provide these numbers:
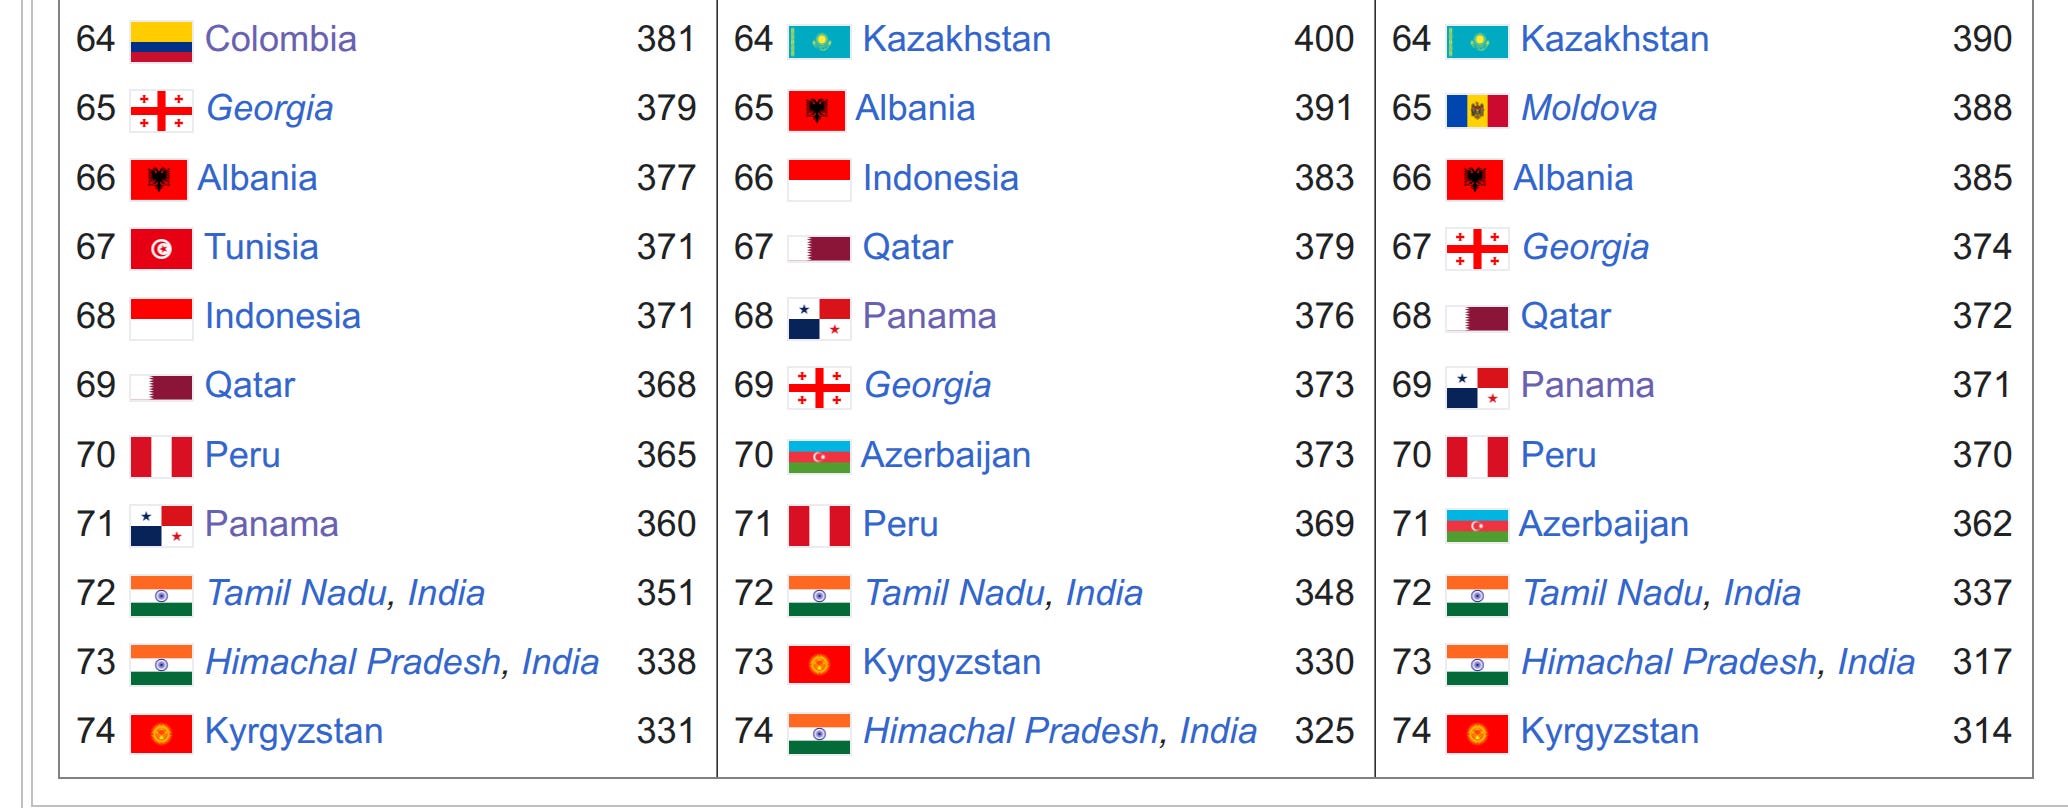
Figure 5 uses the linking methodology proposed previously to present cross-country comparisons on the TIMSS achievement scale.9 Based on the average score, Rajasthan and Orissa rank below 46 (42) of the 51 countries tested with a score of 382 and 404. This ranking straddles Bahrain, Chile and Morocco and is boxed in by Egypt above and the Philippines below. Averaging across the entire tested sample, India scores 392—below 43 of 51 countries. This compares to the international average of 487 in 1999 and 467 in 2003. Seen in standard deviations of all children tested, the two Indian states are 0.7 student standard-deviations or 1 country standard deviation below the TIMSS mean. Relative to the OECD mean, the tested Indian children are 3.1 (OECD) standard deviations below. That is, if we rank all the OECD countries, India would lie below the 1st percentile in the distribution of OECD country scores.
The average within country SD was about 76 (appendix table D2). Thus, the Indian states were about 1.41 z below, giving a mean IQ of about 79. This is with the bias of missing roughly half the children since they weren't in school by the age of testing. Probably one should subtract about 5 IQ to adjust for this sampling bias, which would give about 74 IQ.
Some of the Indian nationalists post data from this online testing site, which finds a mean IQ of 99. This is of course a silly self-selection biased approach, as average people from India don't sit around taking online IQ tests in English. Such scores will be heavily inflated, which we can easily confirm since other poor and mediocre countries also achieve high mean scores on it (Iran 106, Armenia 103, Thailand 102 etc.).
To further convince ourselves the results are sensible, we can look at India's performance in other intellectual pursuits. I did a study of mental game skill (using counts of top players in many different games including chess), and it produced this plot:
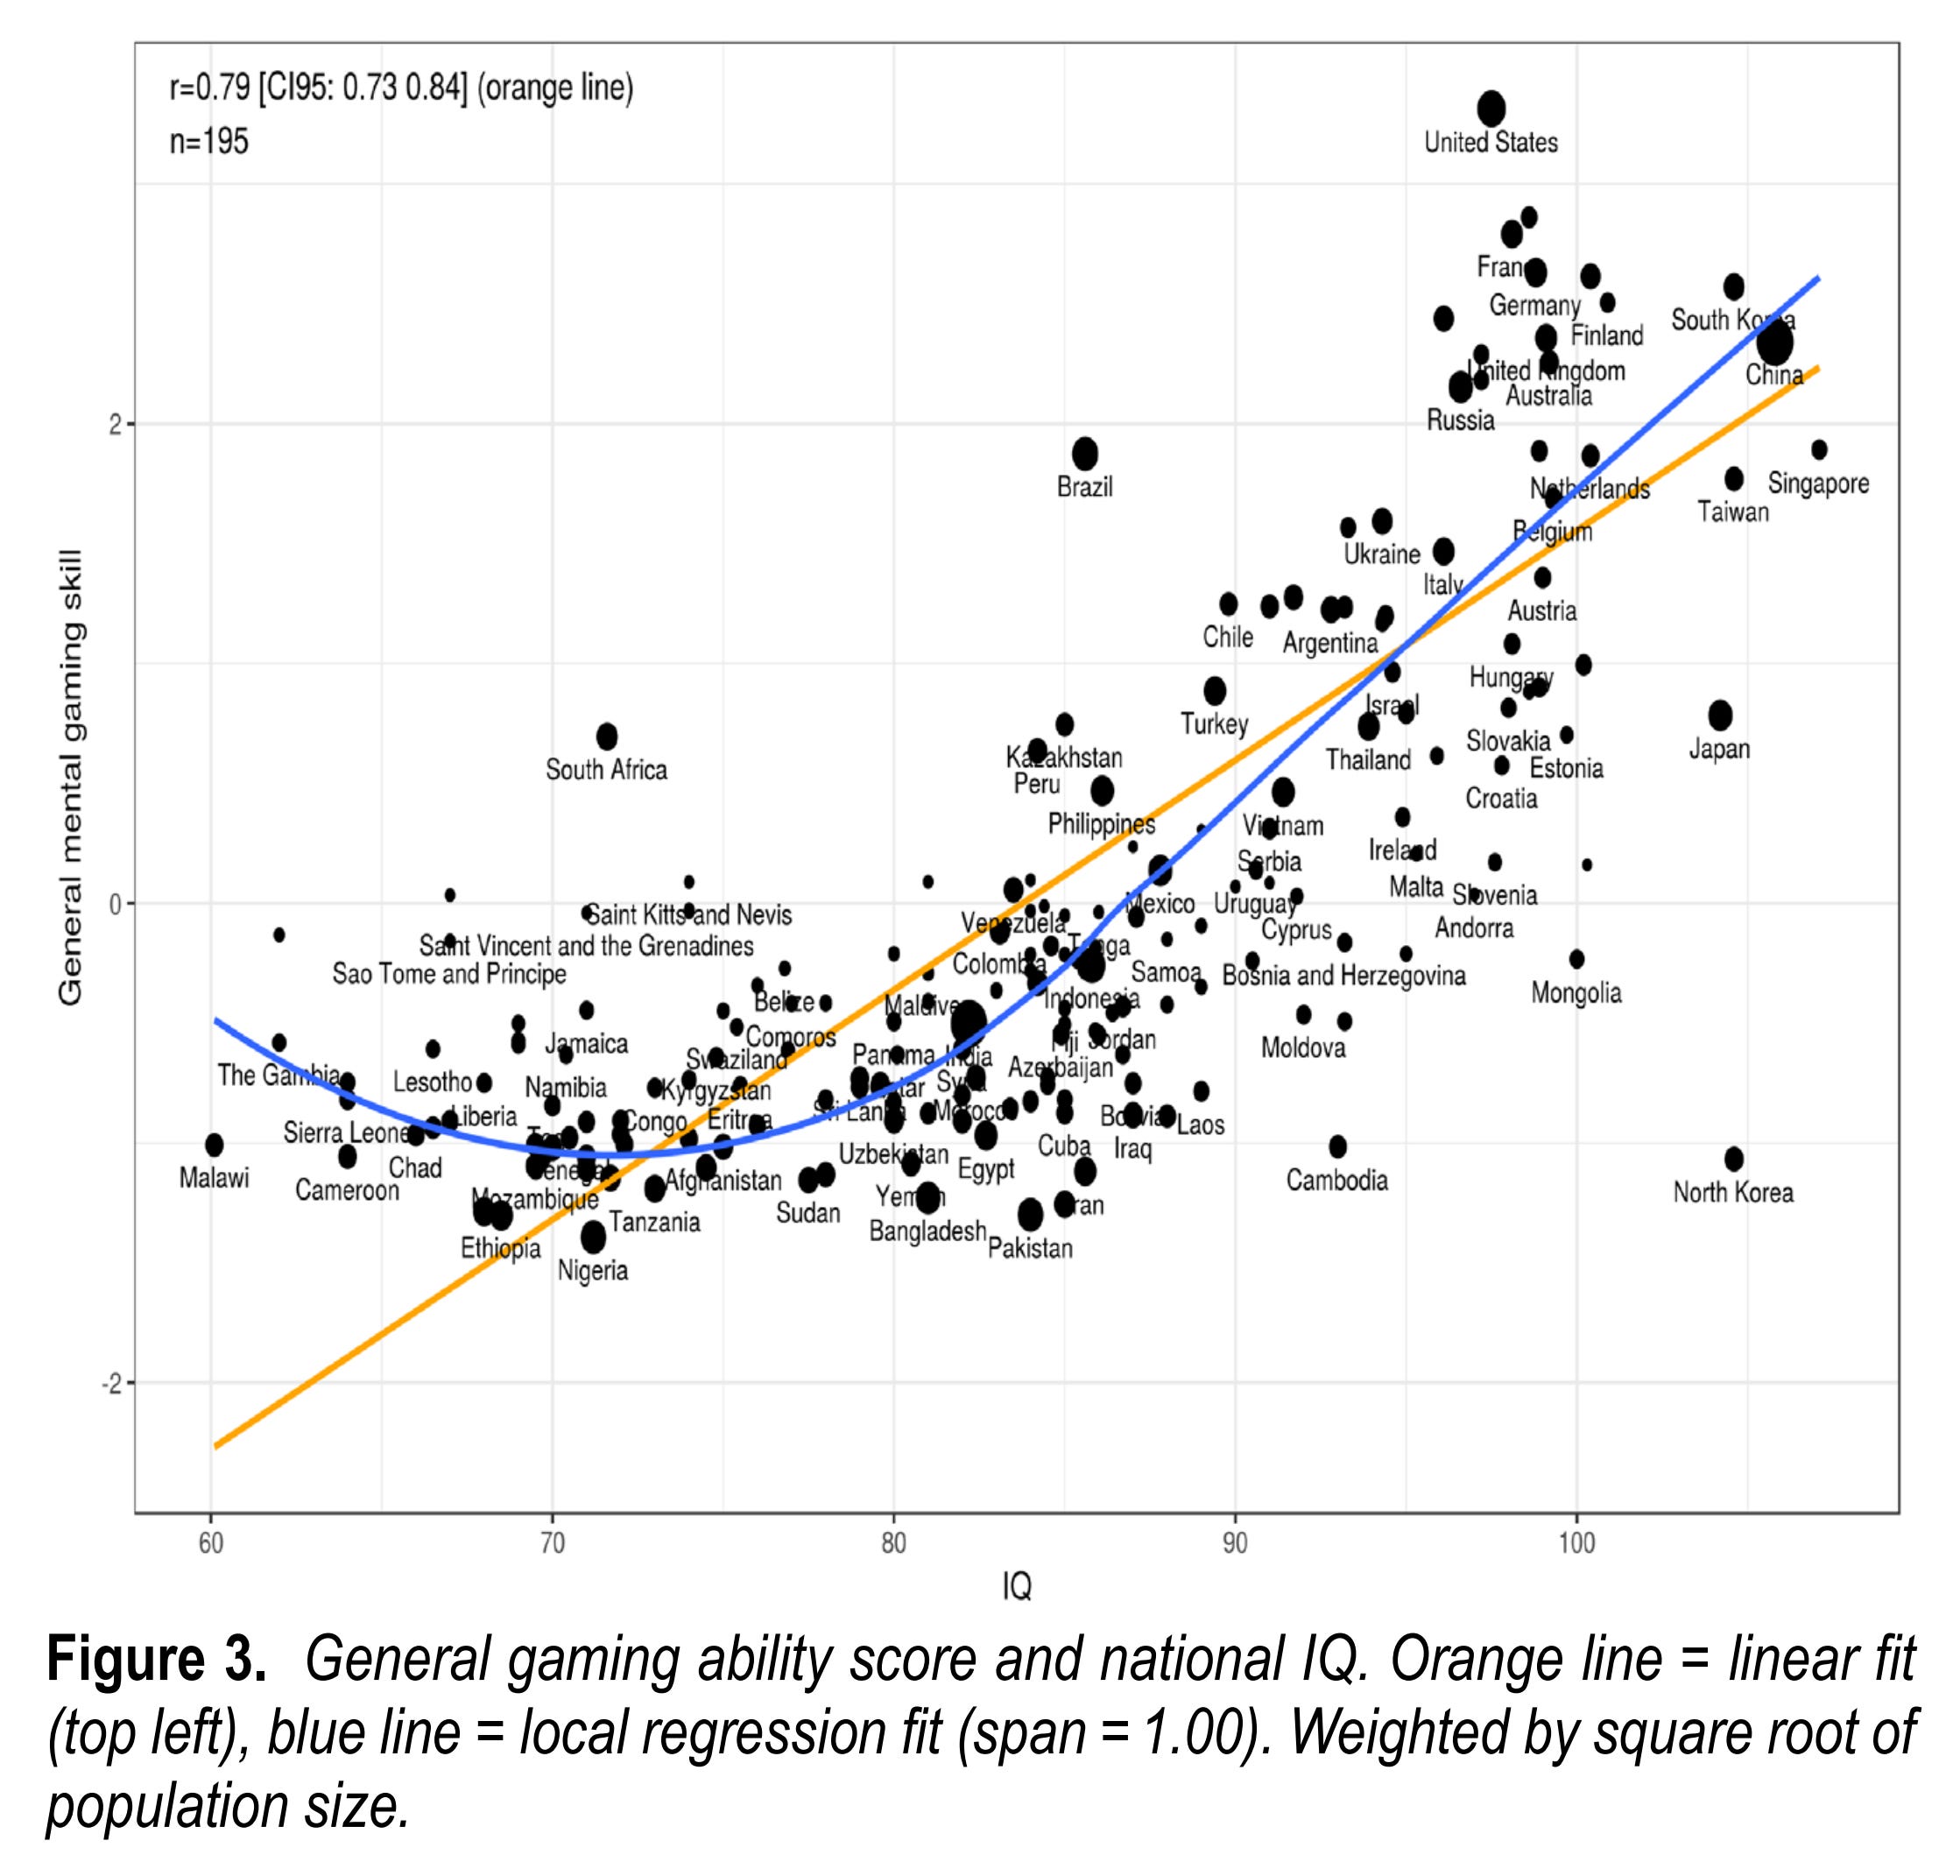
India does not stand out as having particular talent for mental games either given their population size and average IQ as found by the psychometric studies (the study used an older estimate for India at 82 IQ).
Finally, one can look at Indian migrants in the West or other countries. Some of these are rather elite (selected), and thus produce quite elite results. This is not so surprising. Out of a population of ~1400 million, one can find many very bright people, even if the average is low. India also has substantial ethnic variation, so some of the ethnic groups have higher means, and thus the population of India will have thick tails, producing more 130+ IQ people than the normal distribution would predict. Case in point, the ABCD sample of American ~10 year olds found a mean IQ of US-born Indian Americans of about 102 IQ. Another study of Indians in high school in USA found an average of about 101 IQ.
Using the data above, we can make this plot of results (data here):
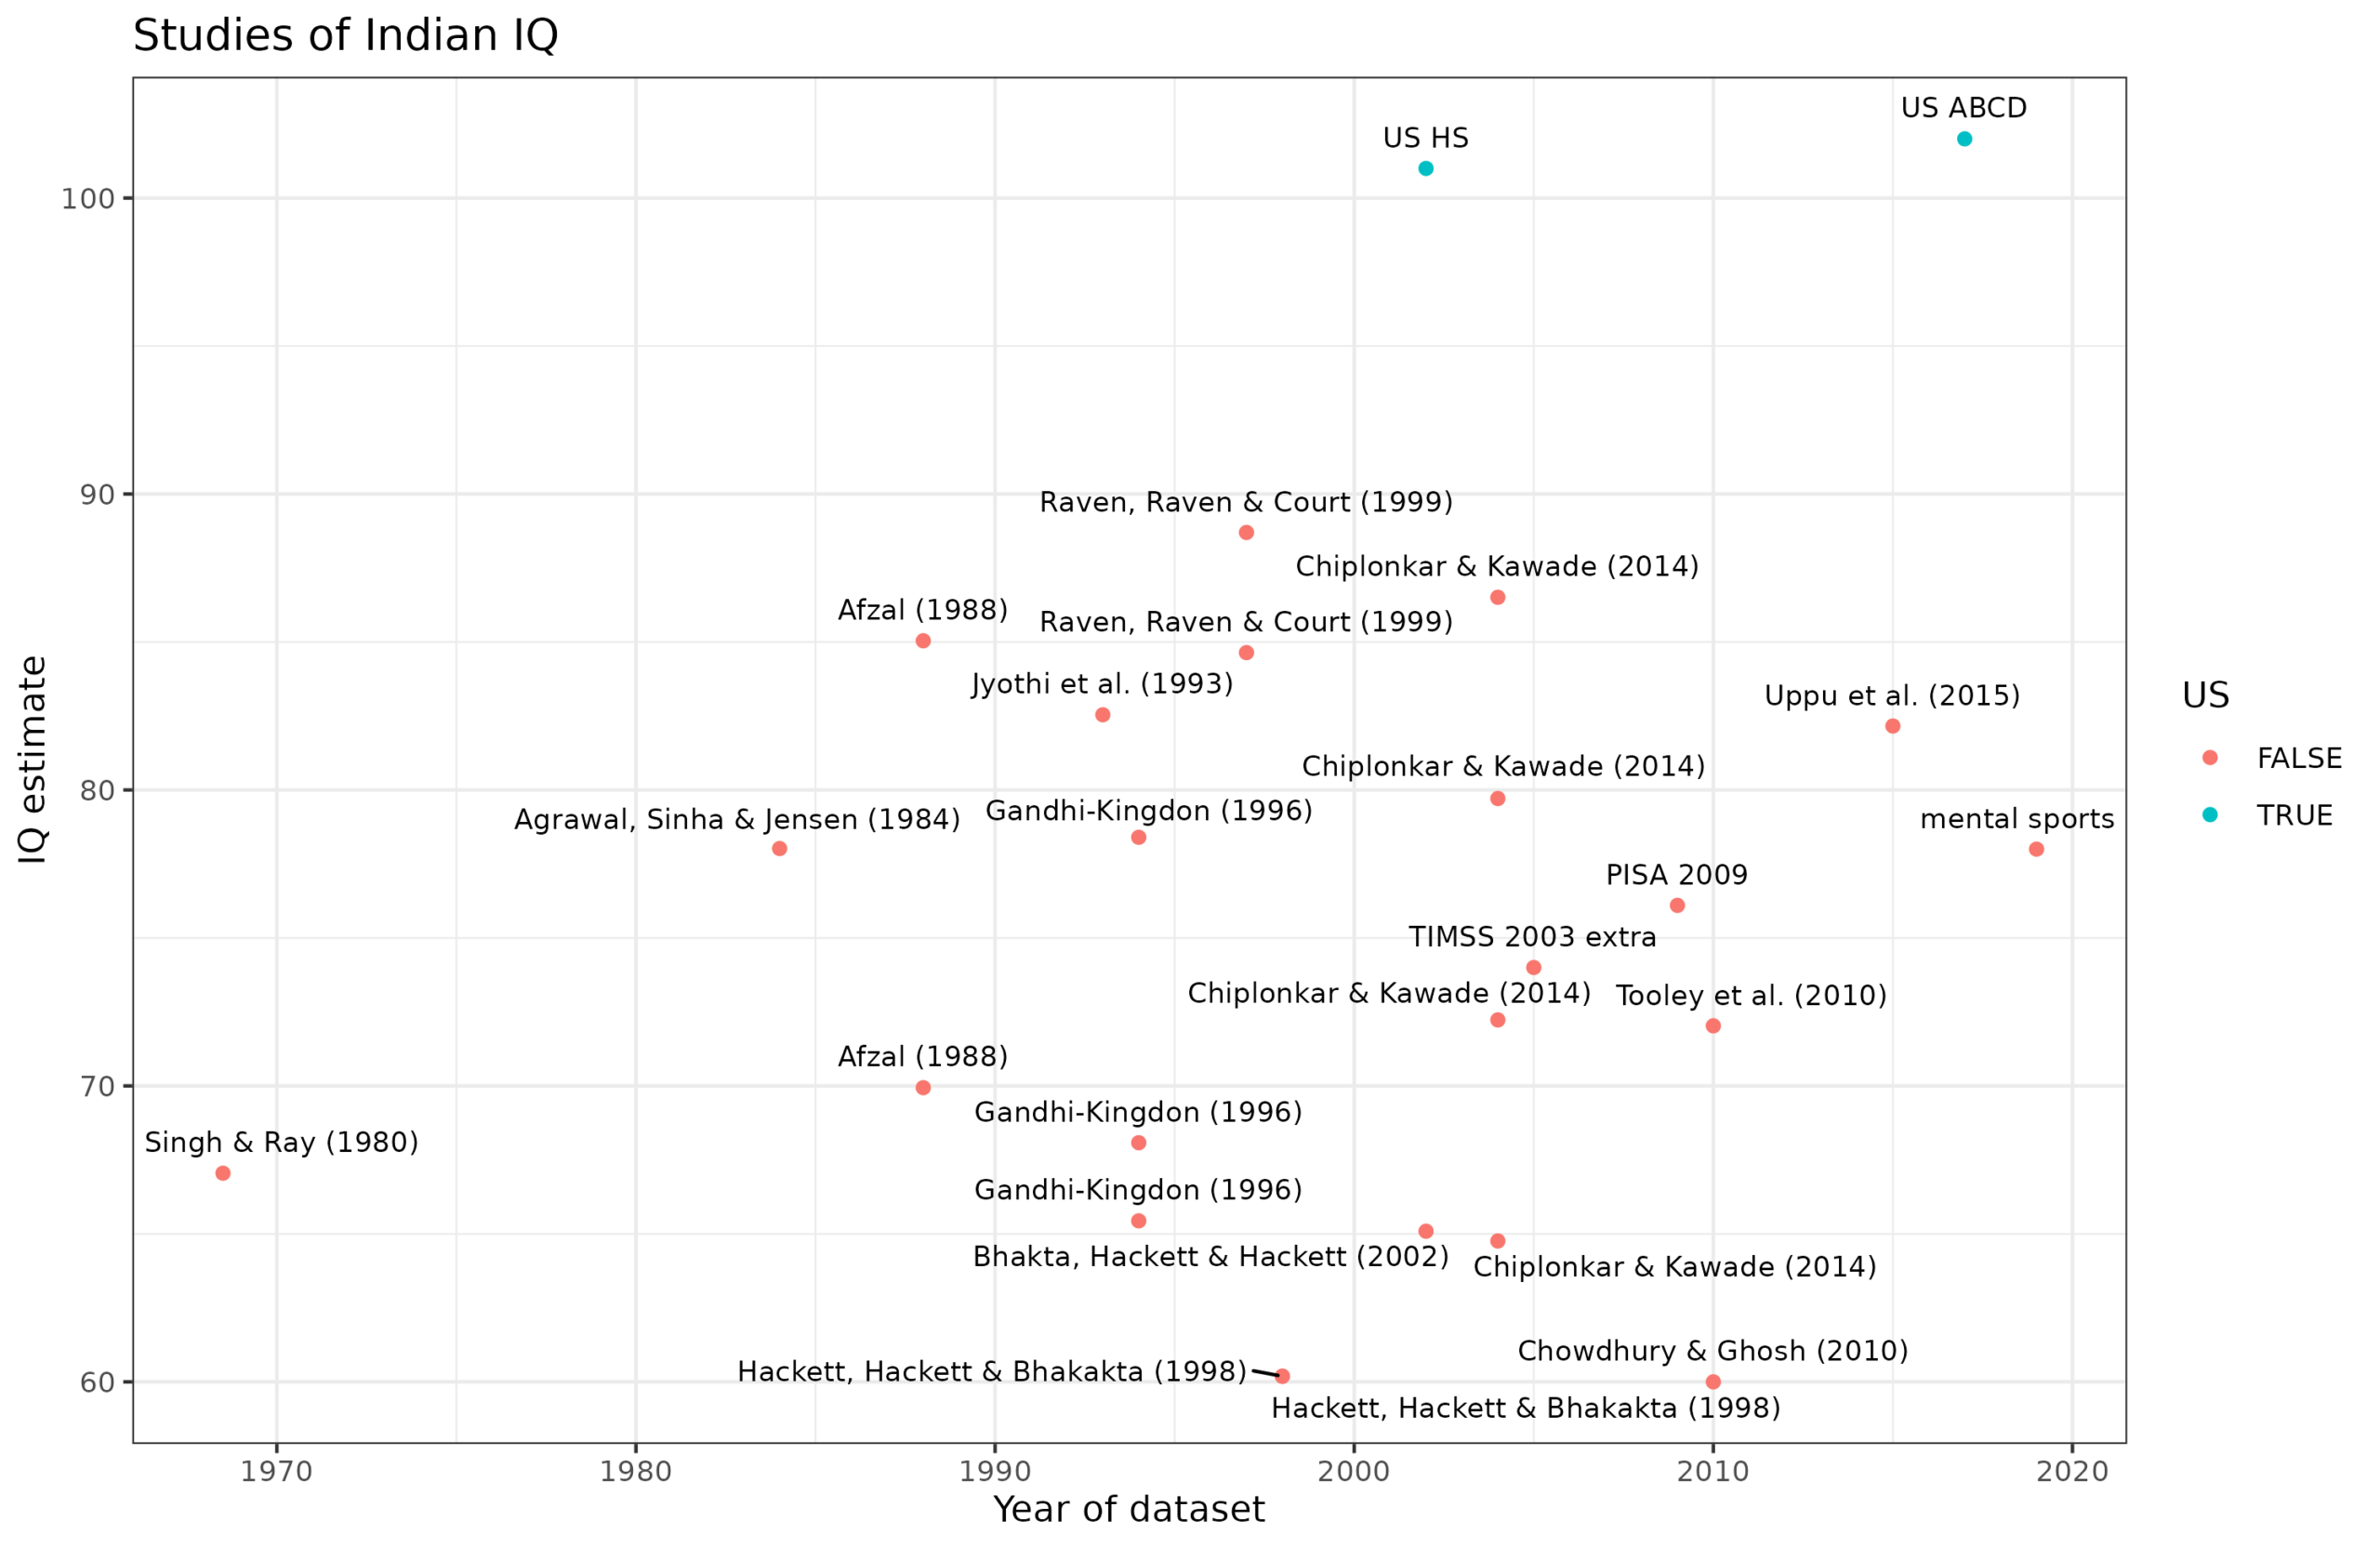
So, we have 5 independent data collections and results:
Raven and Wechsler tests: sample and quality weighted mean 76.1 IQ, unweighted mean 73.5 IQ.
PISA 2009: 74.1 IQ.
TIMSS 2003 linked-study: 74 IQ.
Mental sports: 78 IQ.
US Indians: 101.5 IQ.
These are in very close agreement except for the Indians in the USA, which we know to be strongly selected. There is thus little to argue about in this case. We have plenty of high quality data from 20k+ Indians in India across about 5 decades of research.
Bonus: I know many people will ask, what about the castes? Lynn reviewed such studies and found that Brahmin class has an advantage of roughly 5 IQ over the average, but the studies were difficult to compare and many were old.
Makes me think the USA IQ measures have been falling over the years due to more immigrants being tested than before. Sheer number based on % of population
Can't say much about the IQ estimates from India proper but those seem like unusually low estimates for Indian Americans (and incongruent with academic achievement/income/etc) - this article suggested an IQ around 110 based on SAT score:
https://humanvarieties.org/2023/09/06/sat-act-scores-by-detailed-race-ethnicity-2021/
Any idea why these estimates would be so different?