
Indian IQ in 1944
Tribute to Sohan Lall

Some of you may have seen this table posted on X:
Upon seeing the table, some have mistakenly concluded that the first row has British world scale IQs, but as Lynn & Cheng notes:
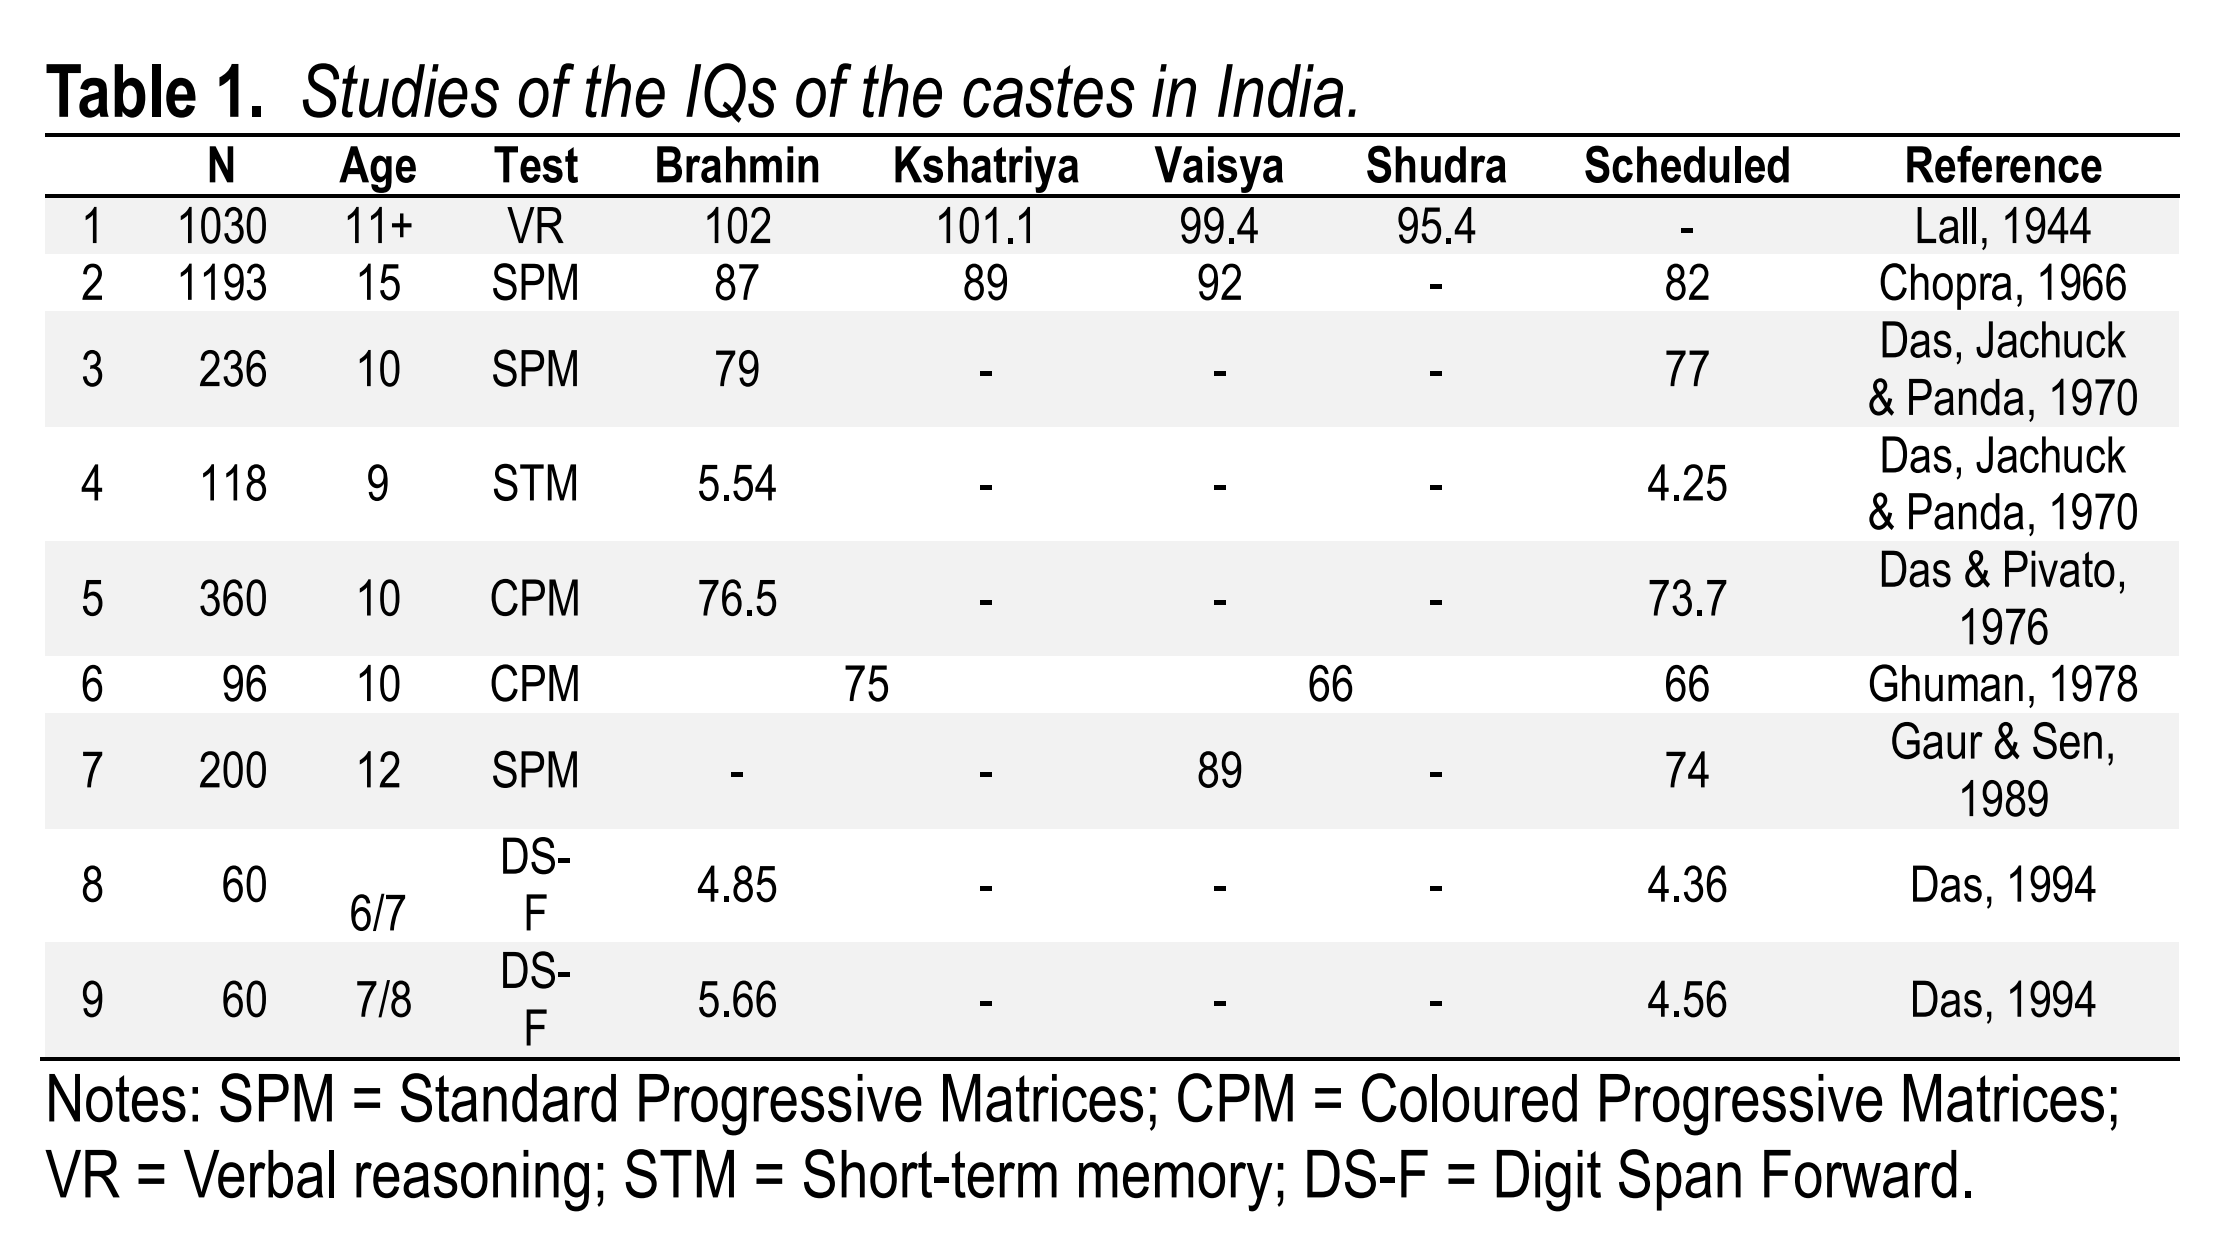
Row 1 gives verbal reasoning IQs for the four non-scheduled castes in the United Provinces of Agra and Oudh (Lall, 1944). The sample consisted of all those in government high schools aged 11 years and over tested with a verbal reasoning test normed on the 100 ± 15 IQ metric in India. The higher IQ of the Brahmins than of the low-caste Shudras (6.6 IQ points) is statistically significant.
Actually, they undersell this study. If you check the citation, you see that this very obscure study has only ever been cited 3 times, 1 of which is the summary paper of IQ by Indian castes. Here’s the study:
LALL, S. (1944). Distribution of intelligence in UP, India. British Journal of Educational Psychology, 14(2), 95-98.
THIS investigation is based on a survey of intelligence of children of 11 + in Classes VI and above of all the Government high schooll of the United Provinces of Agra and Oudh, India. Children in Class V and below were left out because they did not possess enough reading ability to react to the test used. It was due to the co-operation of the Department of Education of the Province that this investigation could be carried out.
The test used was a verbal group intelligence test constructed in Hindustani after the pattern of Moray House tests. It includes items on classification, analogies, instructions, mixed words, time and space relations, opposites, codes, essentials and number and letter series. It was printed both in Hindi and Urdu scripts.
The children were tested on the same day and at the same time throughout the province by teachers who were previously trained for the purpose Printed standardised instructions were sent out with the scripts so that the same words were used by all teachers in administering the test. As the children are not used to this type of test a practice test was given to them before they took the actual test.
Children of fifty-eight schools from fifty-four different cities were tested. These are located in every part of the province, including the innermost regions of the Himalayas. One teacher from the hills had to travel for five days by pony, bus and train to reach the centre where he was to be trained. All the teachers were trained by the investigator himself. Out of these 1,385 are boys and thirty-four are girls. The small number of girls is due to the fact that the Government high schools for girls are very few as compared with such schools for the boys.
The test was standardised on these 1,419 children assuming the standard deviation of I.Q.’s to be 15. The reliability of the test, calculated by the split-half method, is .94.
I don’t know how Lynn kept finding these obscure studies, but it was one of his greatest strengths. The paper itself is only 4 pages, but was a massive undertaking. Clearly, no one spends years collecting such a large dataset, and constructing novel mental tests just to publish a 4 page paper, not even in 1944. The paper has 0 references, which is also pretty strange. In any case, I figured out what was going on. It’s a summary of the author’s dissertation:
Lall, S. (1945). Intelligence and educational survey of the eleven-year-olds in the Government High Schools of the United Provinces of Agra and Oudh, India. Annexe Thesis Digitisation Project 2018 Block 20.
Which itself it has received 0 citations. This is a shame because this is an impressive undertaking. So I wanted to reward Sohan Lall posthumously with a post. Also because he was refreshingly forthright about the reason for the study:
Secondly I had always thought that it would be interesting to find out by a scientific method the comparative I.Q’s of the various religions and the castes living in the province. It would be interesting to find whether the Hindus or the Mohammadans are more intelligent. We would like to know which of the four castes (Brahmins, Kshatriyas, Vaishas and Sudras) is most intelligent and further what is the order of merit of intelligence in these castes.
The dissertation has a lot of hand-drawn figures. For instance, the raw scores on the intelligence test:
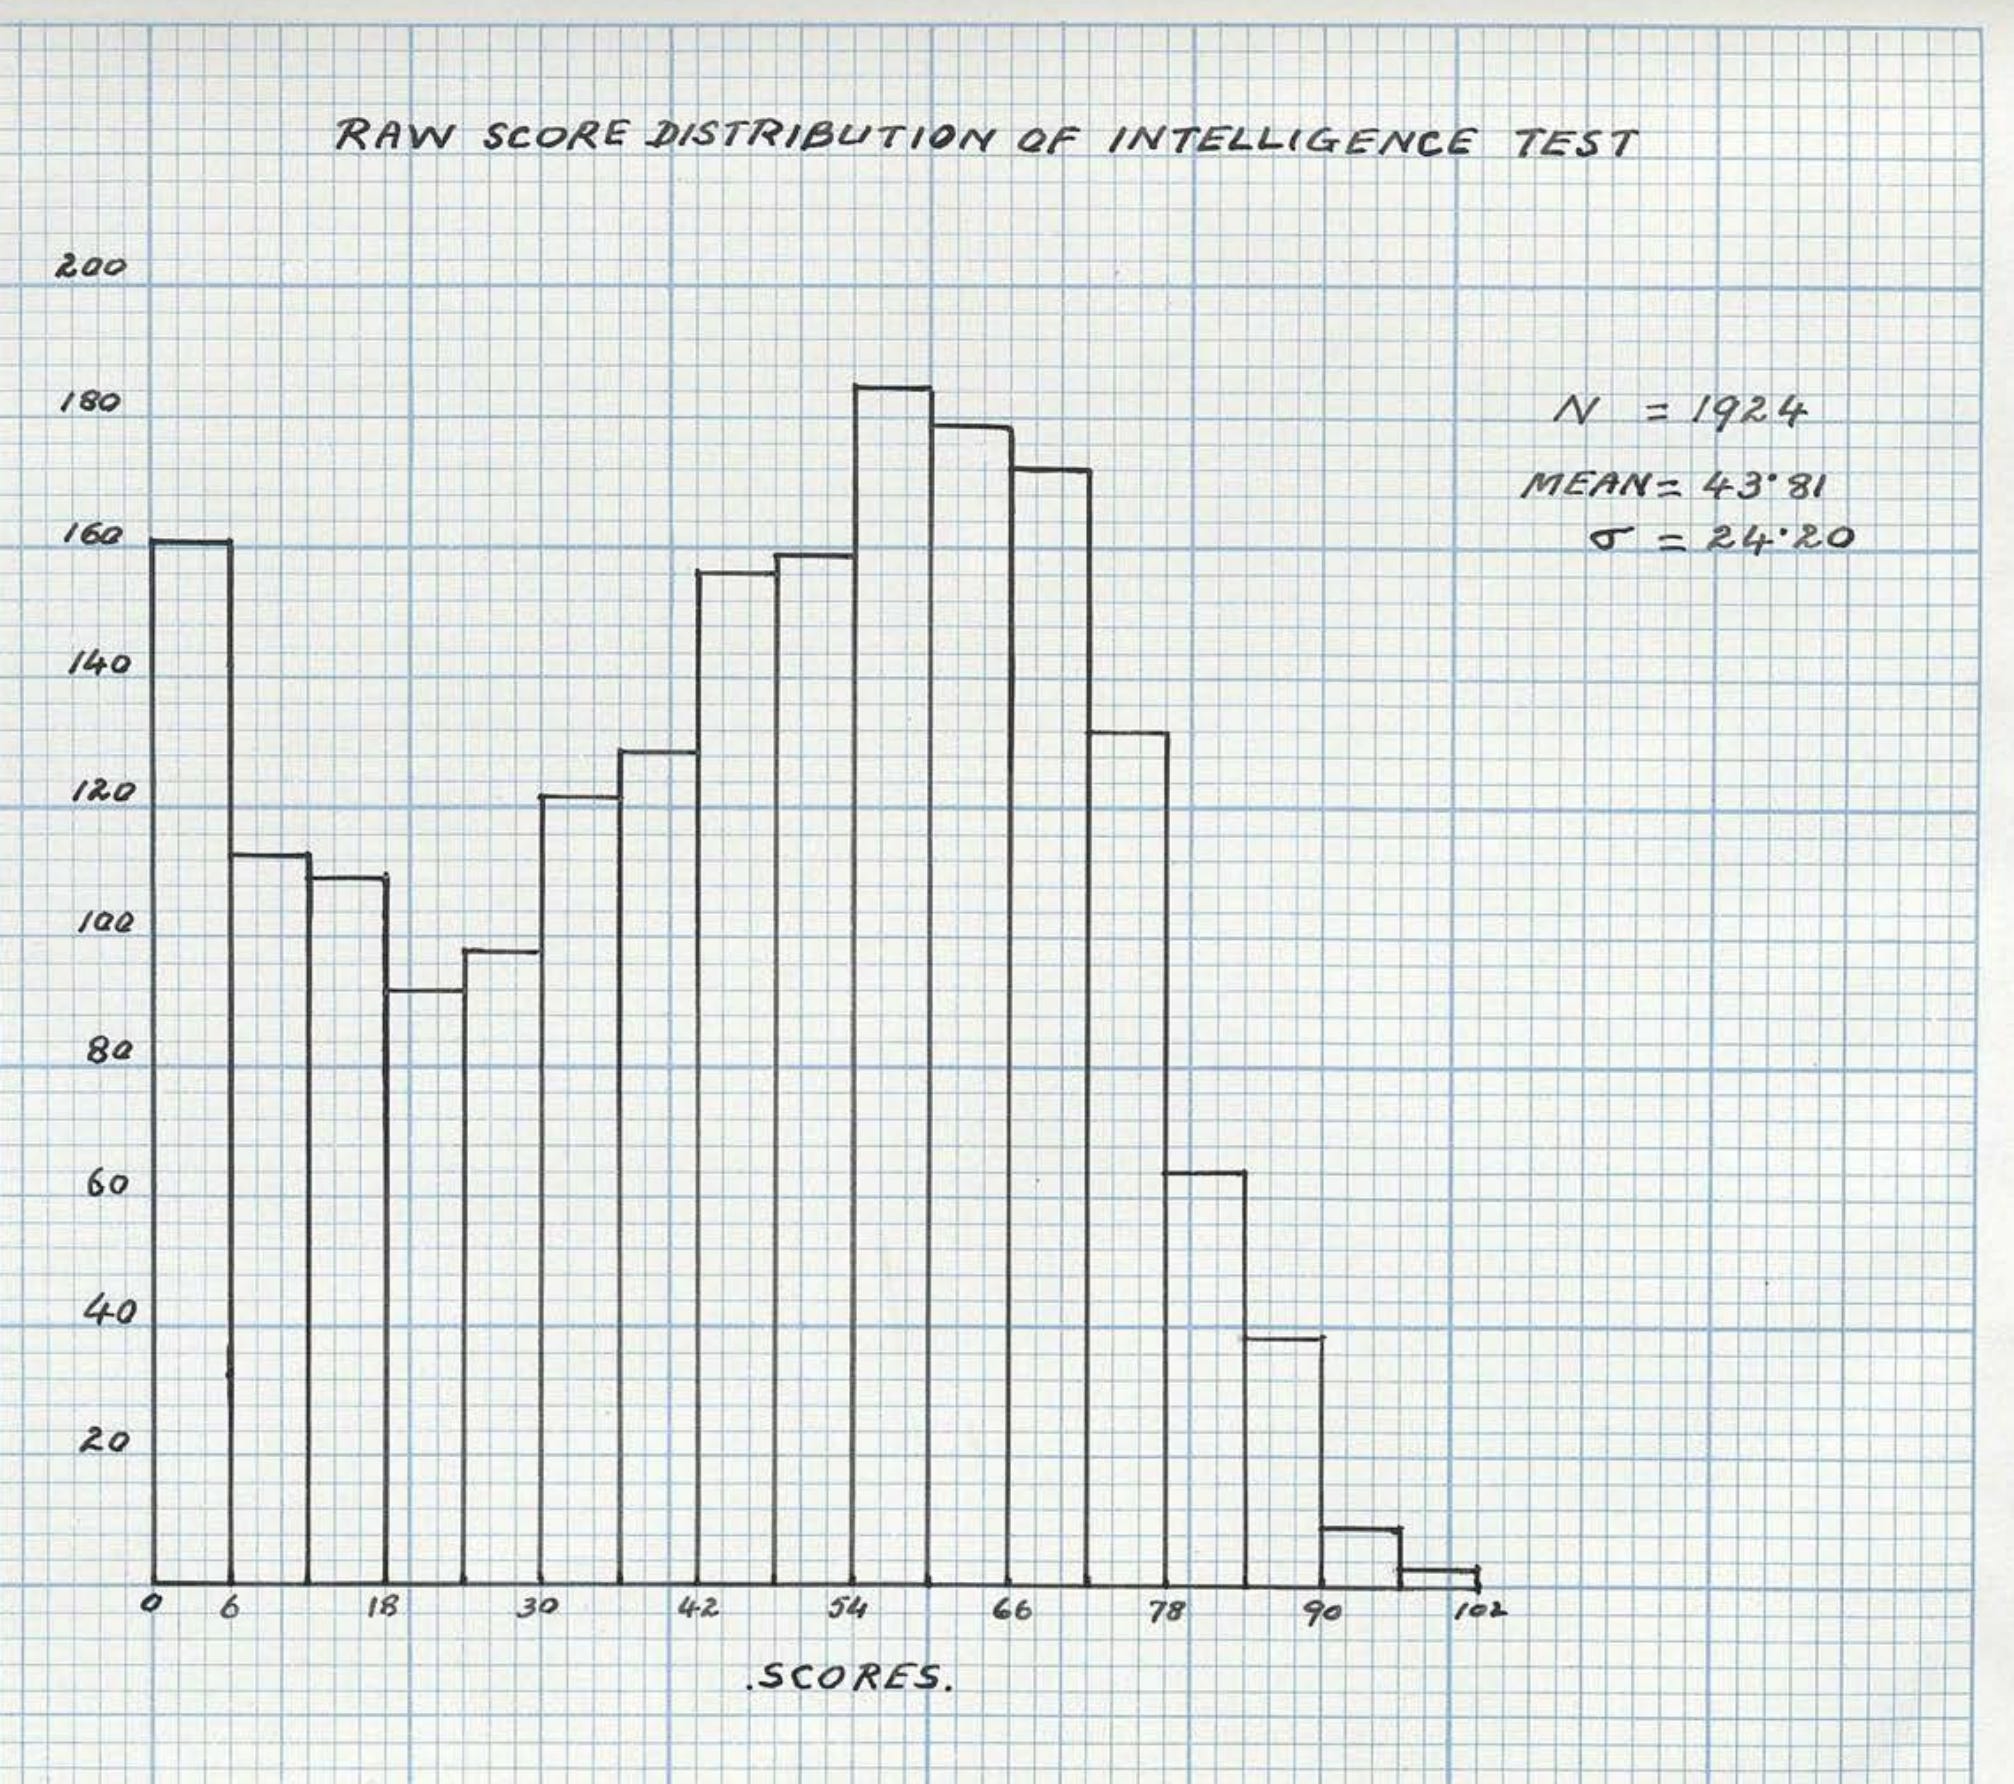
You can see the problem and perhaps if you are very attentive, also spot the solution. The sample size here is listed as 1924, whereas the listings before say 1385, or in Lynn’s table 1030. So the solution:
It was found, however, that this piling up of the cases at the lower end could be explained., The distribution of children in classes in India is not on age basis. The promotion from one class to another is based on a standard of achievement fixed by the Department of Education. Each child, no matter how old he is remains in a particular class unless he achieves the standard laid down for that class. The result is that we find children of same age scattered over all classes and also children of different ages in the same class. The children of 11+ thus are found in all classes from Class III to Class X.When the tests were given every child of 11+ was tested irrespective of the class he was in.
The children of class V and below do not have enough reading ability. It is customary to have all of the examinations in schools up to class IV orally except in arithmetic. Even in class V some of the examinations are held orally. It is only when the children come to class VI that they are given written examination in all subjects. It was thought that the children which had piled up at the lower end in the histograms were probably the children who were in Class V and below because they could not react to the tests satisfactorily owing to the lack of reading ability required by the tests.
And thus class V and below were excluded, explaining the sample discrepancy. The distribution looks like this after the exclusion of Class 5-:
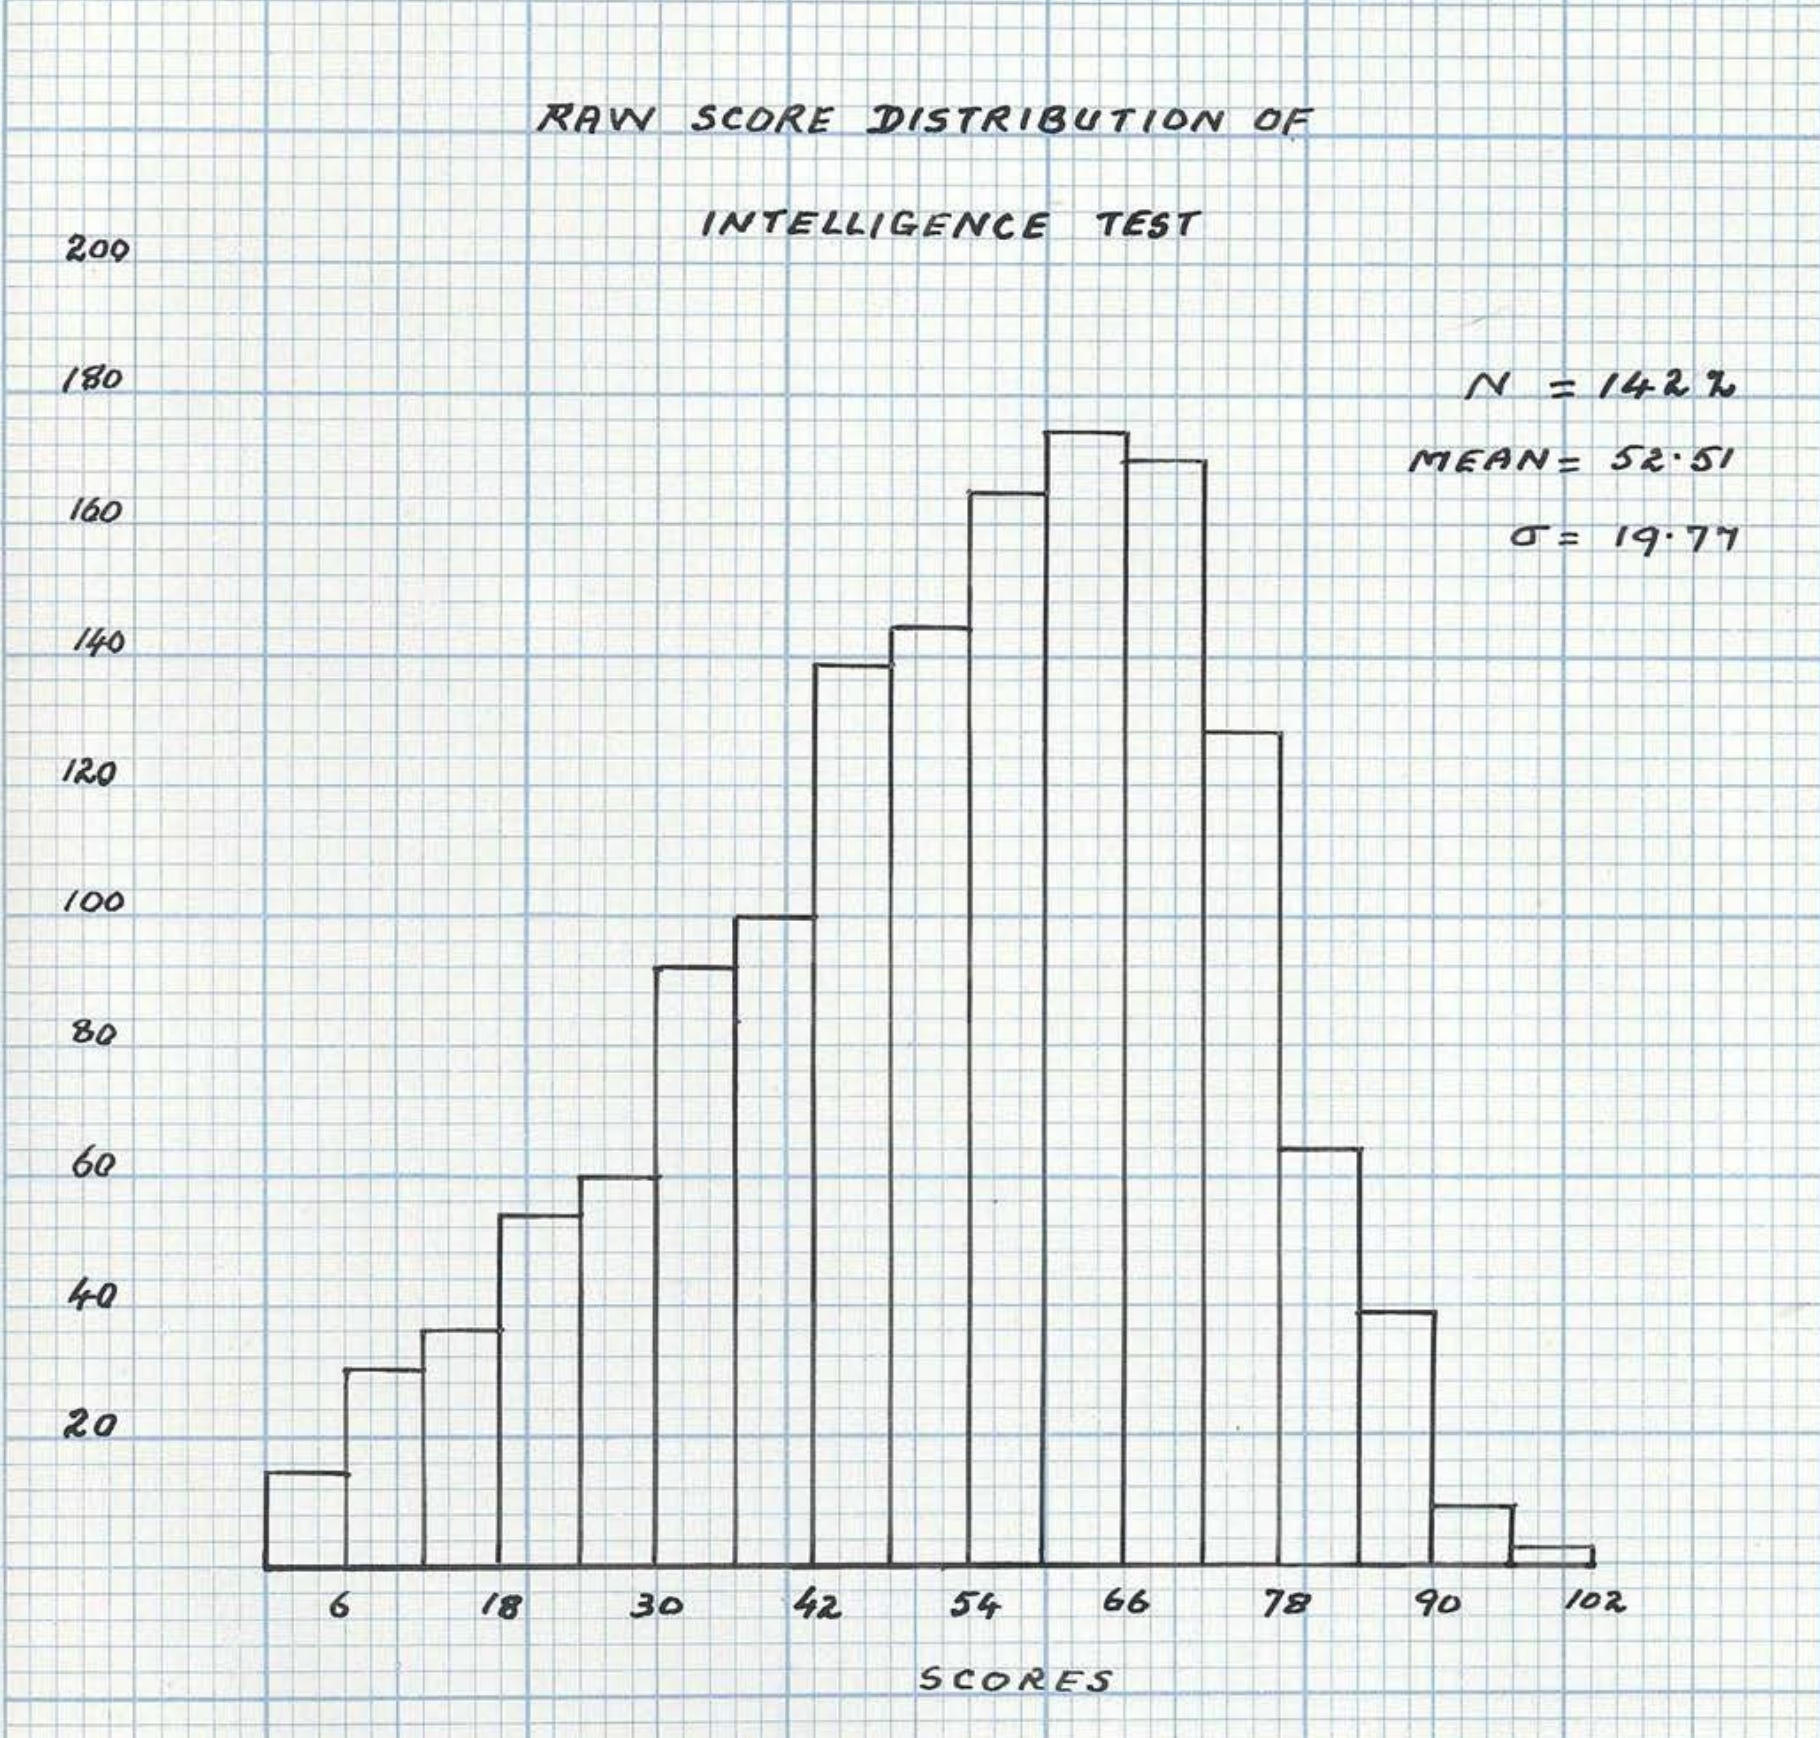
Much better.
Very cool, I didn’t know they used mastery learning in India at the time. Wikipedia tells us that:
Mastery learning (or, as it was initially called, “learning for mastery“; also known as “mastery-based learning”) is an instructional strategy and educational philosophy, first formally proposed by Benjamin Bloom in 1968.[1] Mastery learning maintains that students must achieve a level of mastery (e.g., 90% on a knowledge test) in prerequisite knowledge before moving forward to learn subsequent information. If a student does not achieve mastery on the test, they are given additional support in learning and reviewing the information and then tested again. This cycle continues until the learner accomplishes mastery, and they may then move on to the next stage. In a self-paced online learning environment, students study the material and take assessments. If they make mistakes, the system provides insightful explanations and directs them to revisit the relevant sections. They then answer different questions on the same material, and this cycle repeats until they reach the established mastery threshold. Only then can they move on to subsequent learning modules, assessments, or certifications.
So Benjamin Bloom certainly did not invent mastery learning. Perhaps the Indians got it from the British colonists, I don’t know.
So why did they test in English?:
It might be asked why English was selected as the language to be tested and why not the mother tongue. The reason is simple. In our schools English is the more important language. Mother tongue, unfortunately, is a secondary language. In the universities all teaching is in English. In Government offices English is the language used. In Vernacular schools the mother tongue is the first language but in the High Schools it is English that holds the place of importance. The vernacular schools are generally meant for children in the villages. As this study has been confined to Government High Schools and the language which is most important in these schools is English the language tested is also English and not the mother tongue.
How difficult were the test items (questions)?:
Our attempt, then, was to frame questions which will be suited to the intelligence of the 11 year -olds. At best we could guess the difficulty value of these questions. There are no published tests for the eleven-year-olds in this country which could give one an idea of how difficult the questions in the intelligence test should be. In the construction of this test, therefore, I had to start, as it were, from the scratch. I was, however,fortunately placed in one respect. I had been familiar with the Moray House tests. I had spent three years there and constant working with these tests had given me a rough idea of the difficulty of the questions framed for the eleven- year -old in Great Britain. I kept my questions roughly on the same standard of difficulty. All this estimate of the difficulty value of the questions was purely subjective but it worked.
As a matter of fact, Lall recreated new tests for each topic (English, Math, intelligence). The work was quite extensive, involving 200 trial items which was reduced to 100 upon limited testing before final design. The dissertation provides examples of all the tests. As a matter of fact, it contains the entire set of questions, in 3 languages, English, Hindi, and Urdu:
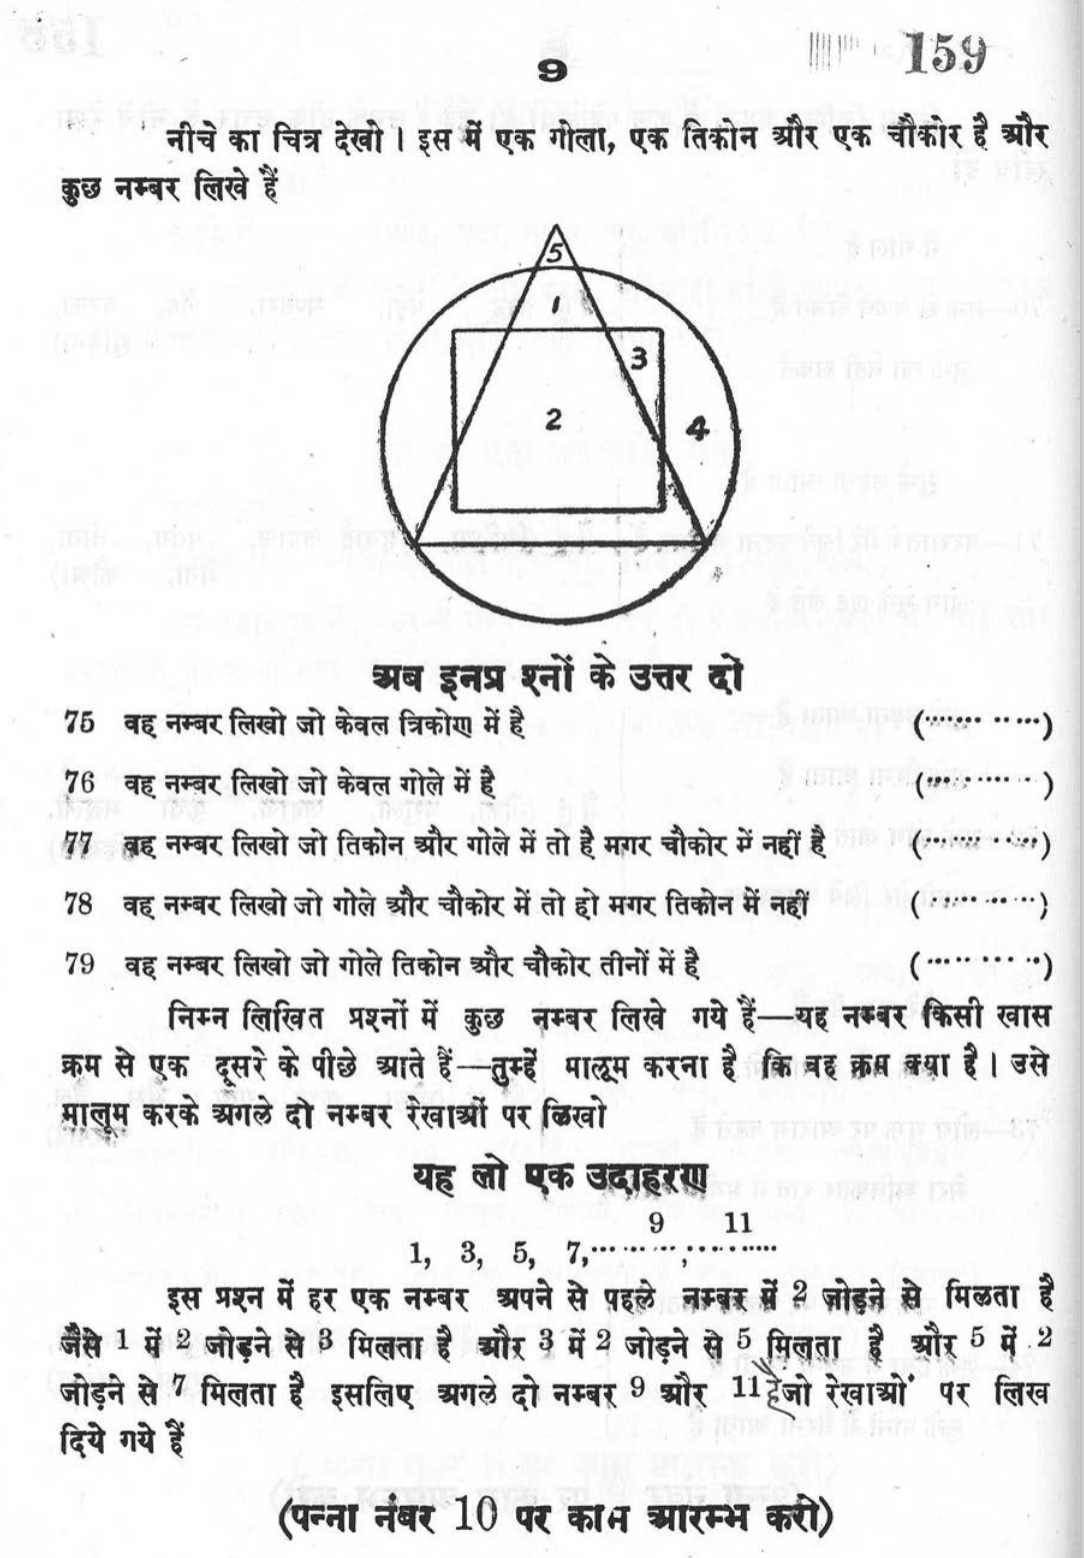
Since all the items are public, it is possible to do a great Flynn effect study here by administering the same test to 11 year olds in modern India. This would provide us with a picture of the change in performance across 80+ years (test administration was in 1941.)
The samples were fairly representative in terms of student background:
Thirdly the Government schools have within their class rooms children who come from all ranks of the social order. In one of the Government schools where I was teaching we had on the school roll the sons of the Chief Justice of the province and also the sons of the school peon.
However, we may wonder which proportion of children were still in school at age 11 in 1941. I asked Perplexity Pro and it said:
At age 11 in India, the proportion of children enrolled in government schools in 1941 can only be roughly estimated as comprehensive school-level data from that year is unavailable. Current best estimates based on historical records suggest that only a very small percentage (estimated around 10% or less) of 11-year-olds were enrolled in government schools in 1941, mainly due to limited school access and low literacy rates at the time. In 2024, approximately 67% of Indian children in the age group 11-14 are enrolled in government schools, based on national large-scale survey data.
The estimate is based on the literacy rate in the 1941 Indian census:
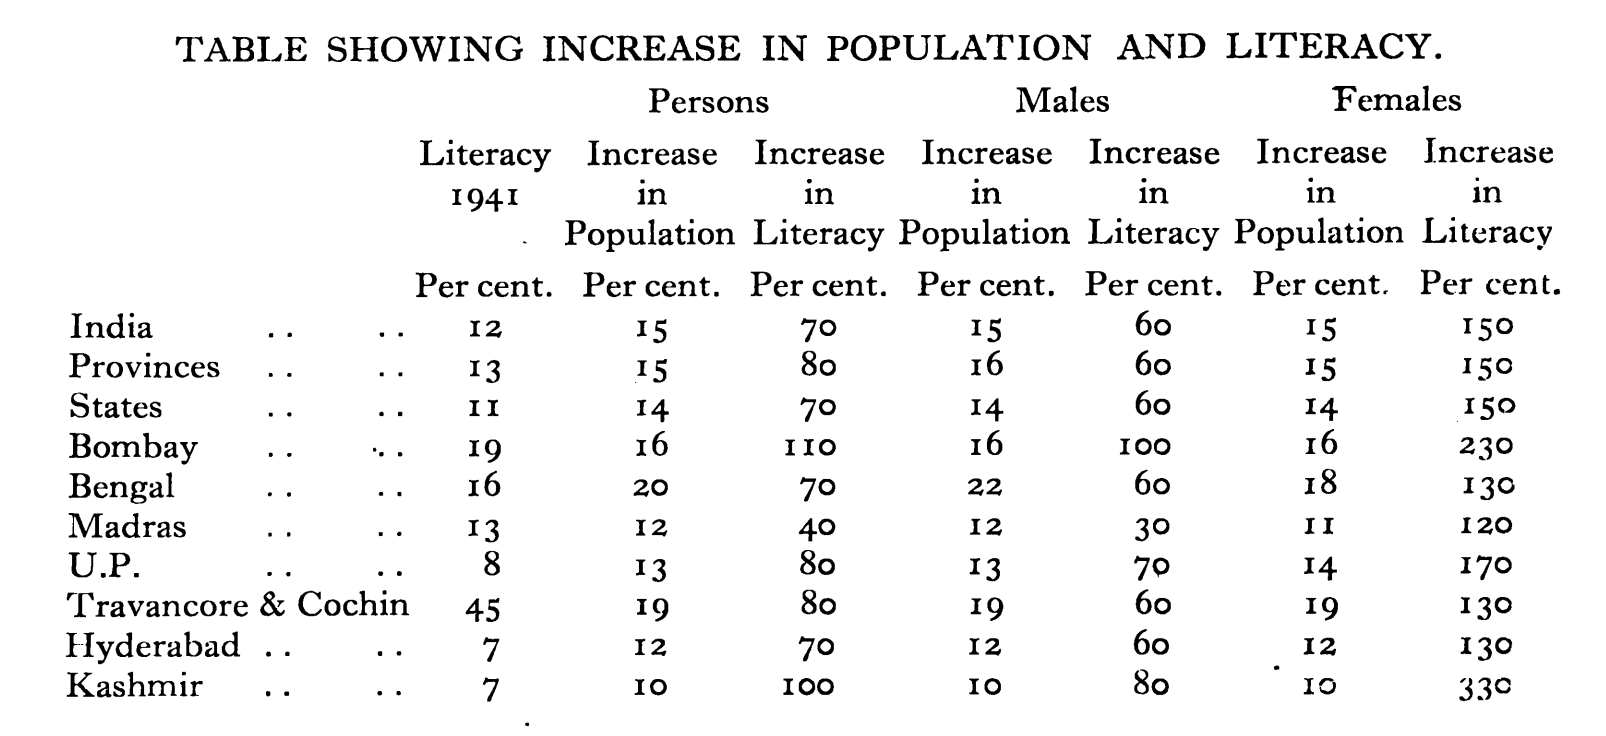
If only 12% are literate, this presents an upper bound on the school enrollment to whatever level of education results in qualifying for literacy. Note however that younger generations will be more literate than older ones, so the figure for 11 year olds at the time will be higher than 12% perhaps. On the other hand, adults may also learn to read later in life. Whatever the case, the students in these government schools were definitely a quite selected bunch, despite the diversity of social backgrounds mentioned above.
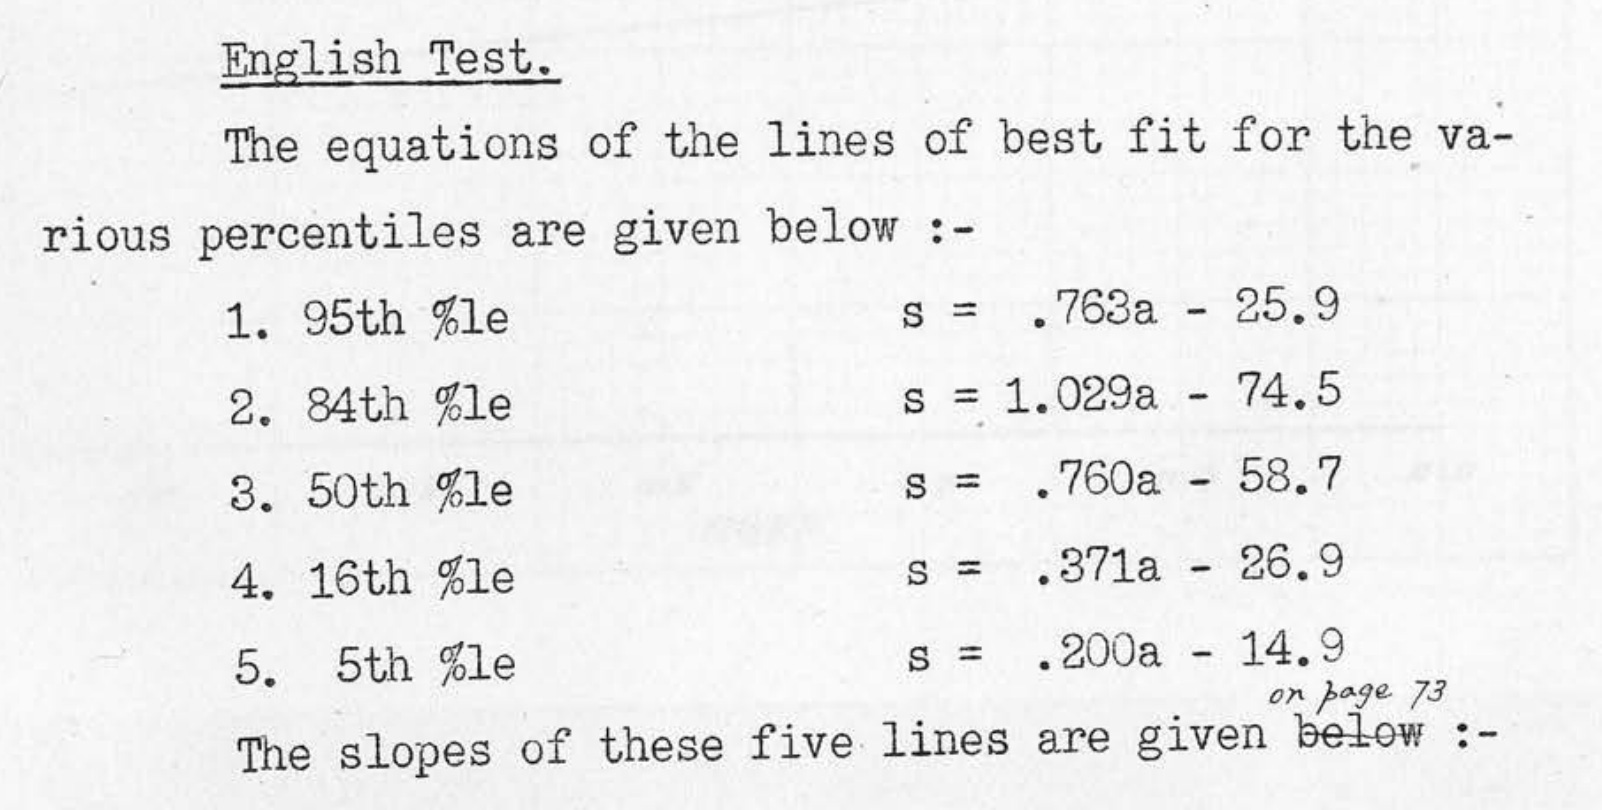
Another interesting finding was that learning rates could be estimated using the ages of the students in months by comparing the difference in performance between those aged 11.0 and those aged 11:11:
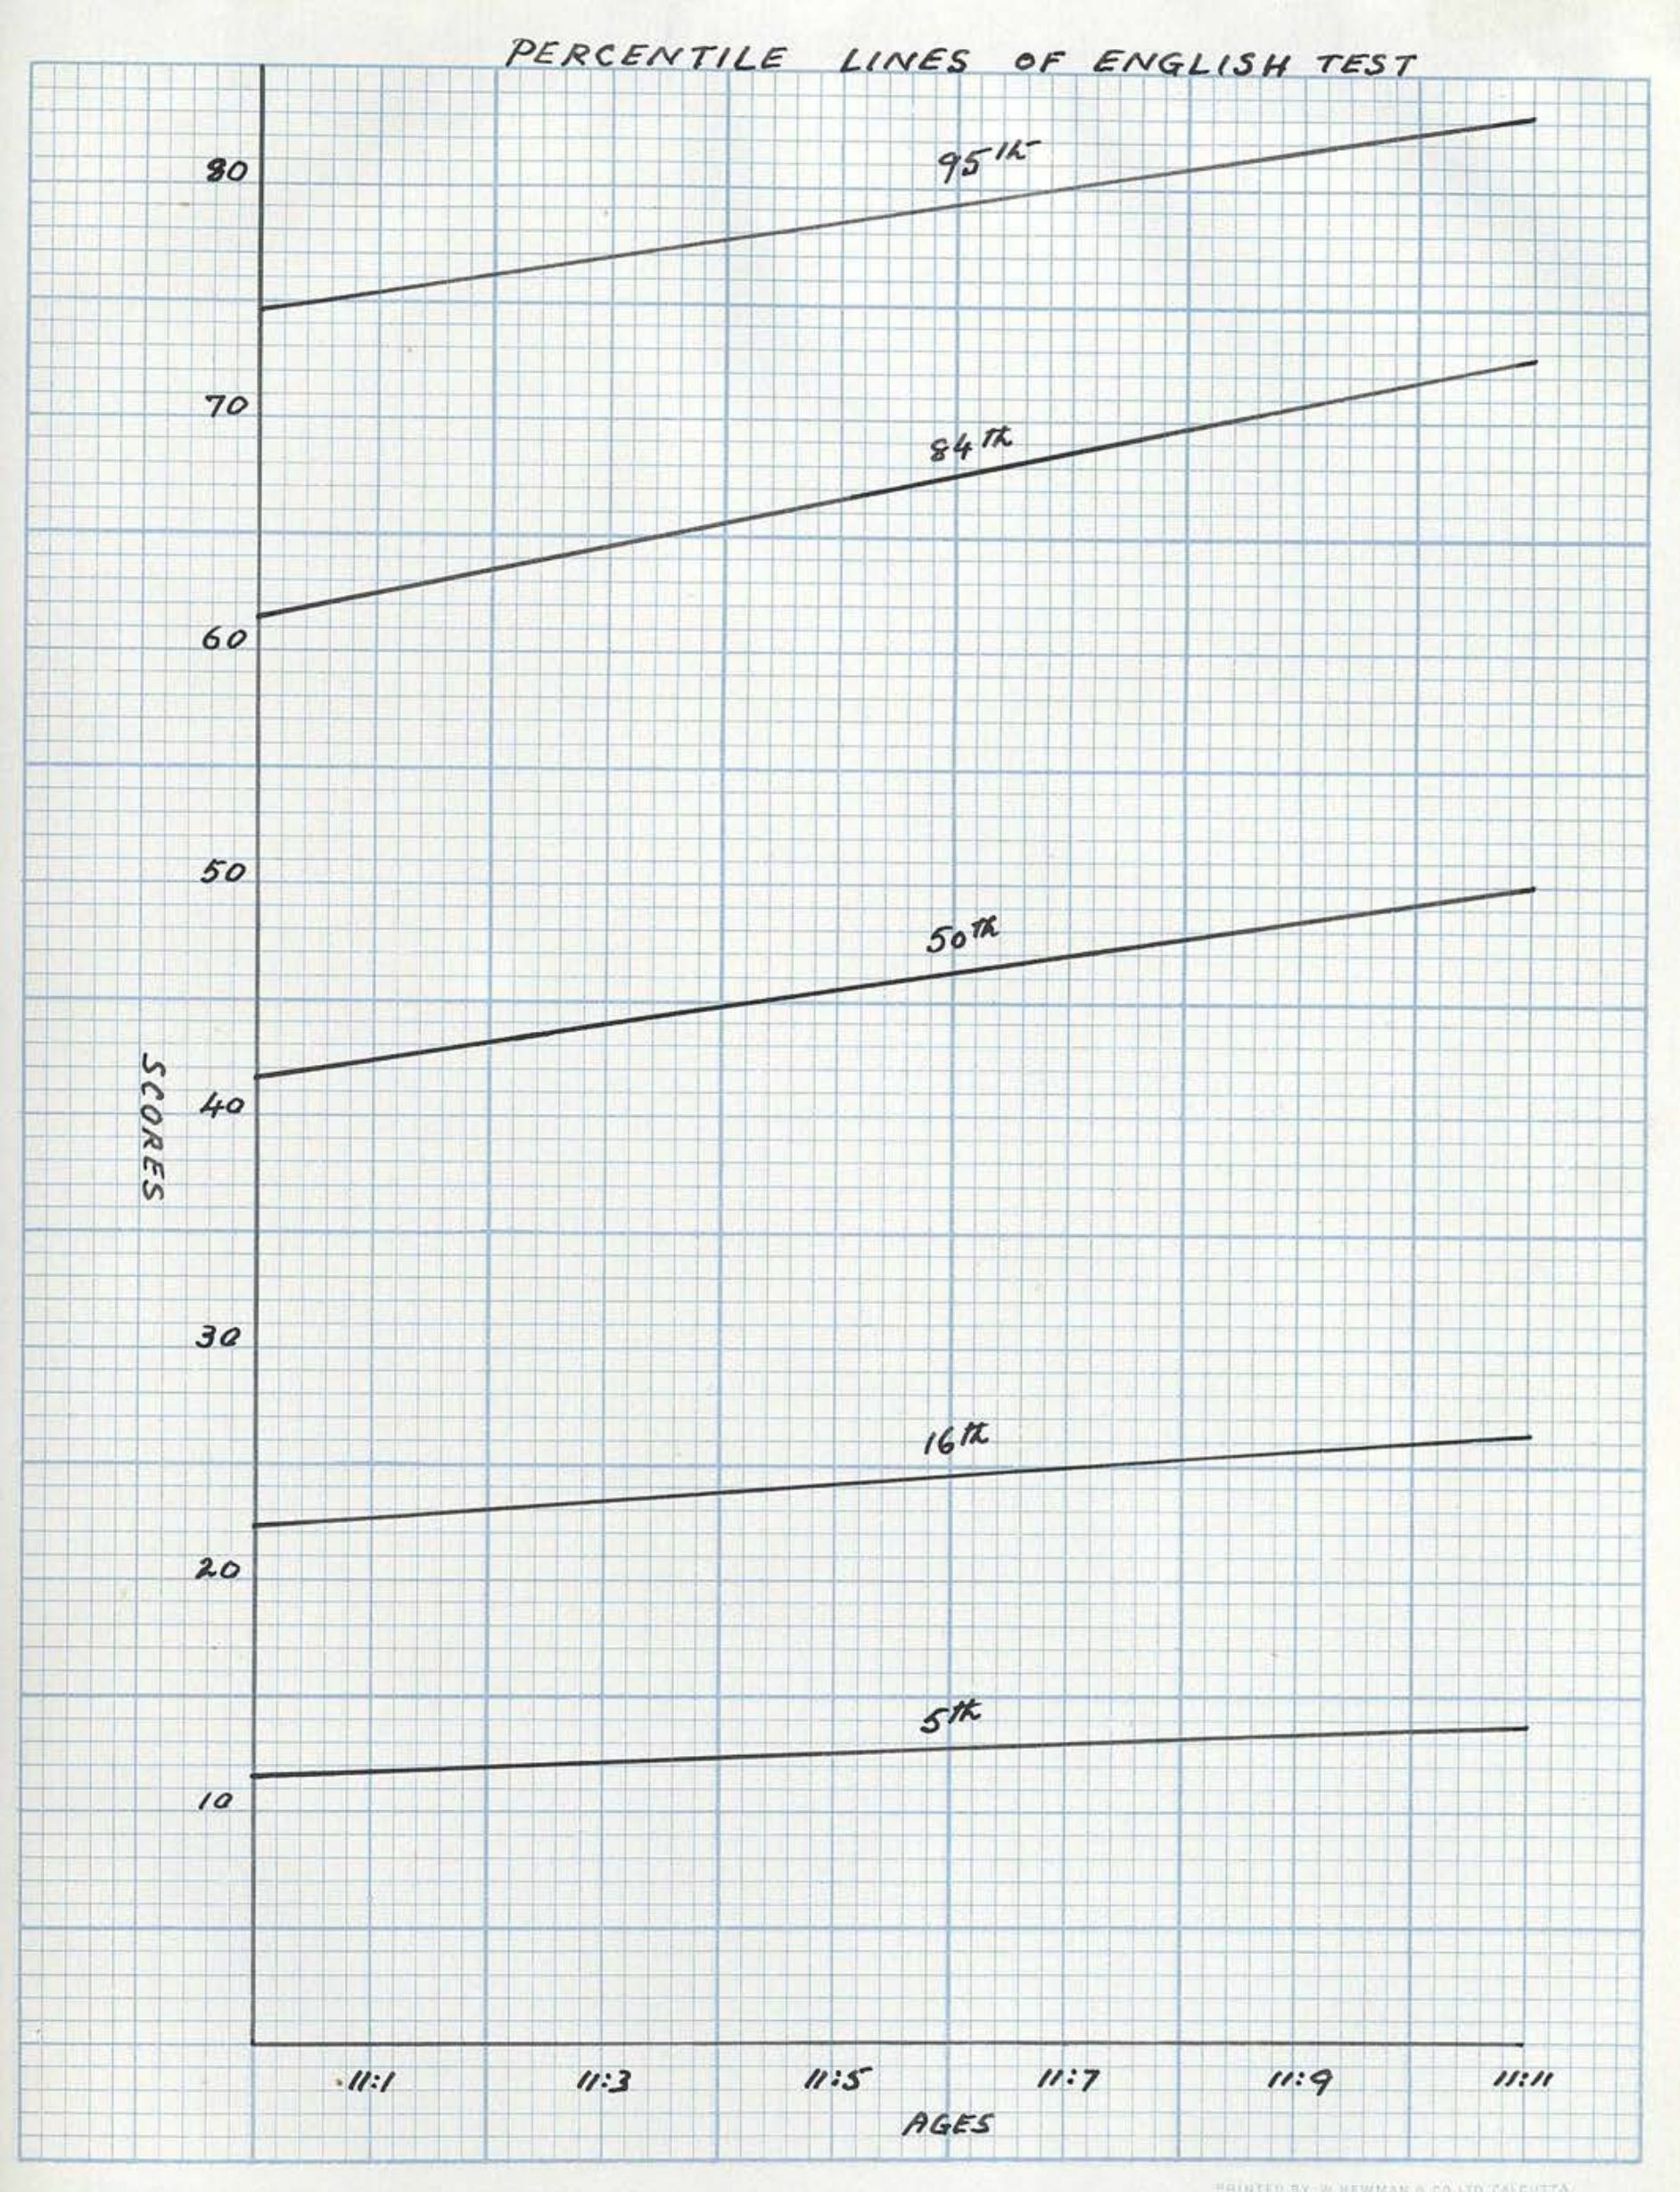
Thus, the students at the lower centiles have smaller age gradients than those are higher centiles:
This kind of “the rich get richer” patterns are called Matthew effects in education. This is a cross-sectional estimate so may have some biases, but nevertheless, the pattern is consistent with modern results, and also across the various tests in this study. Here’s some modern results:
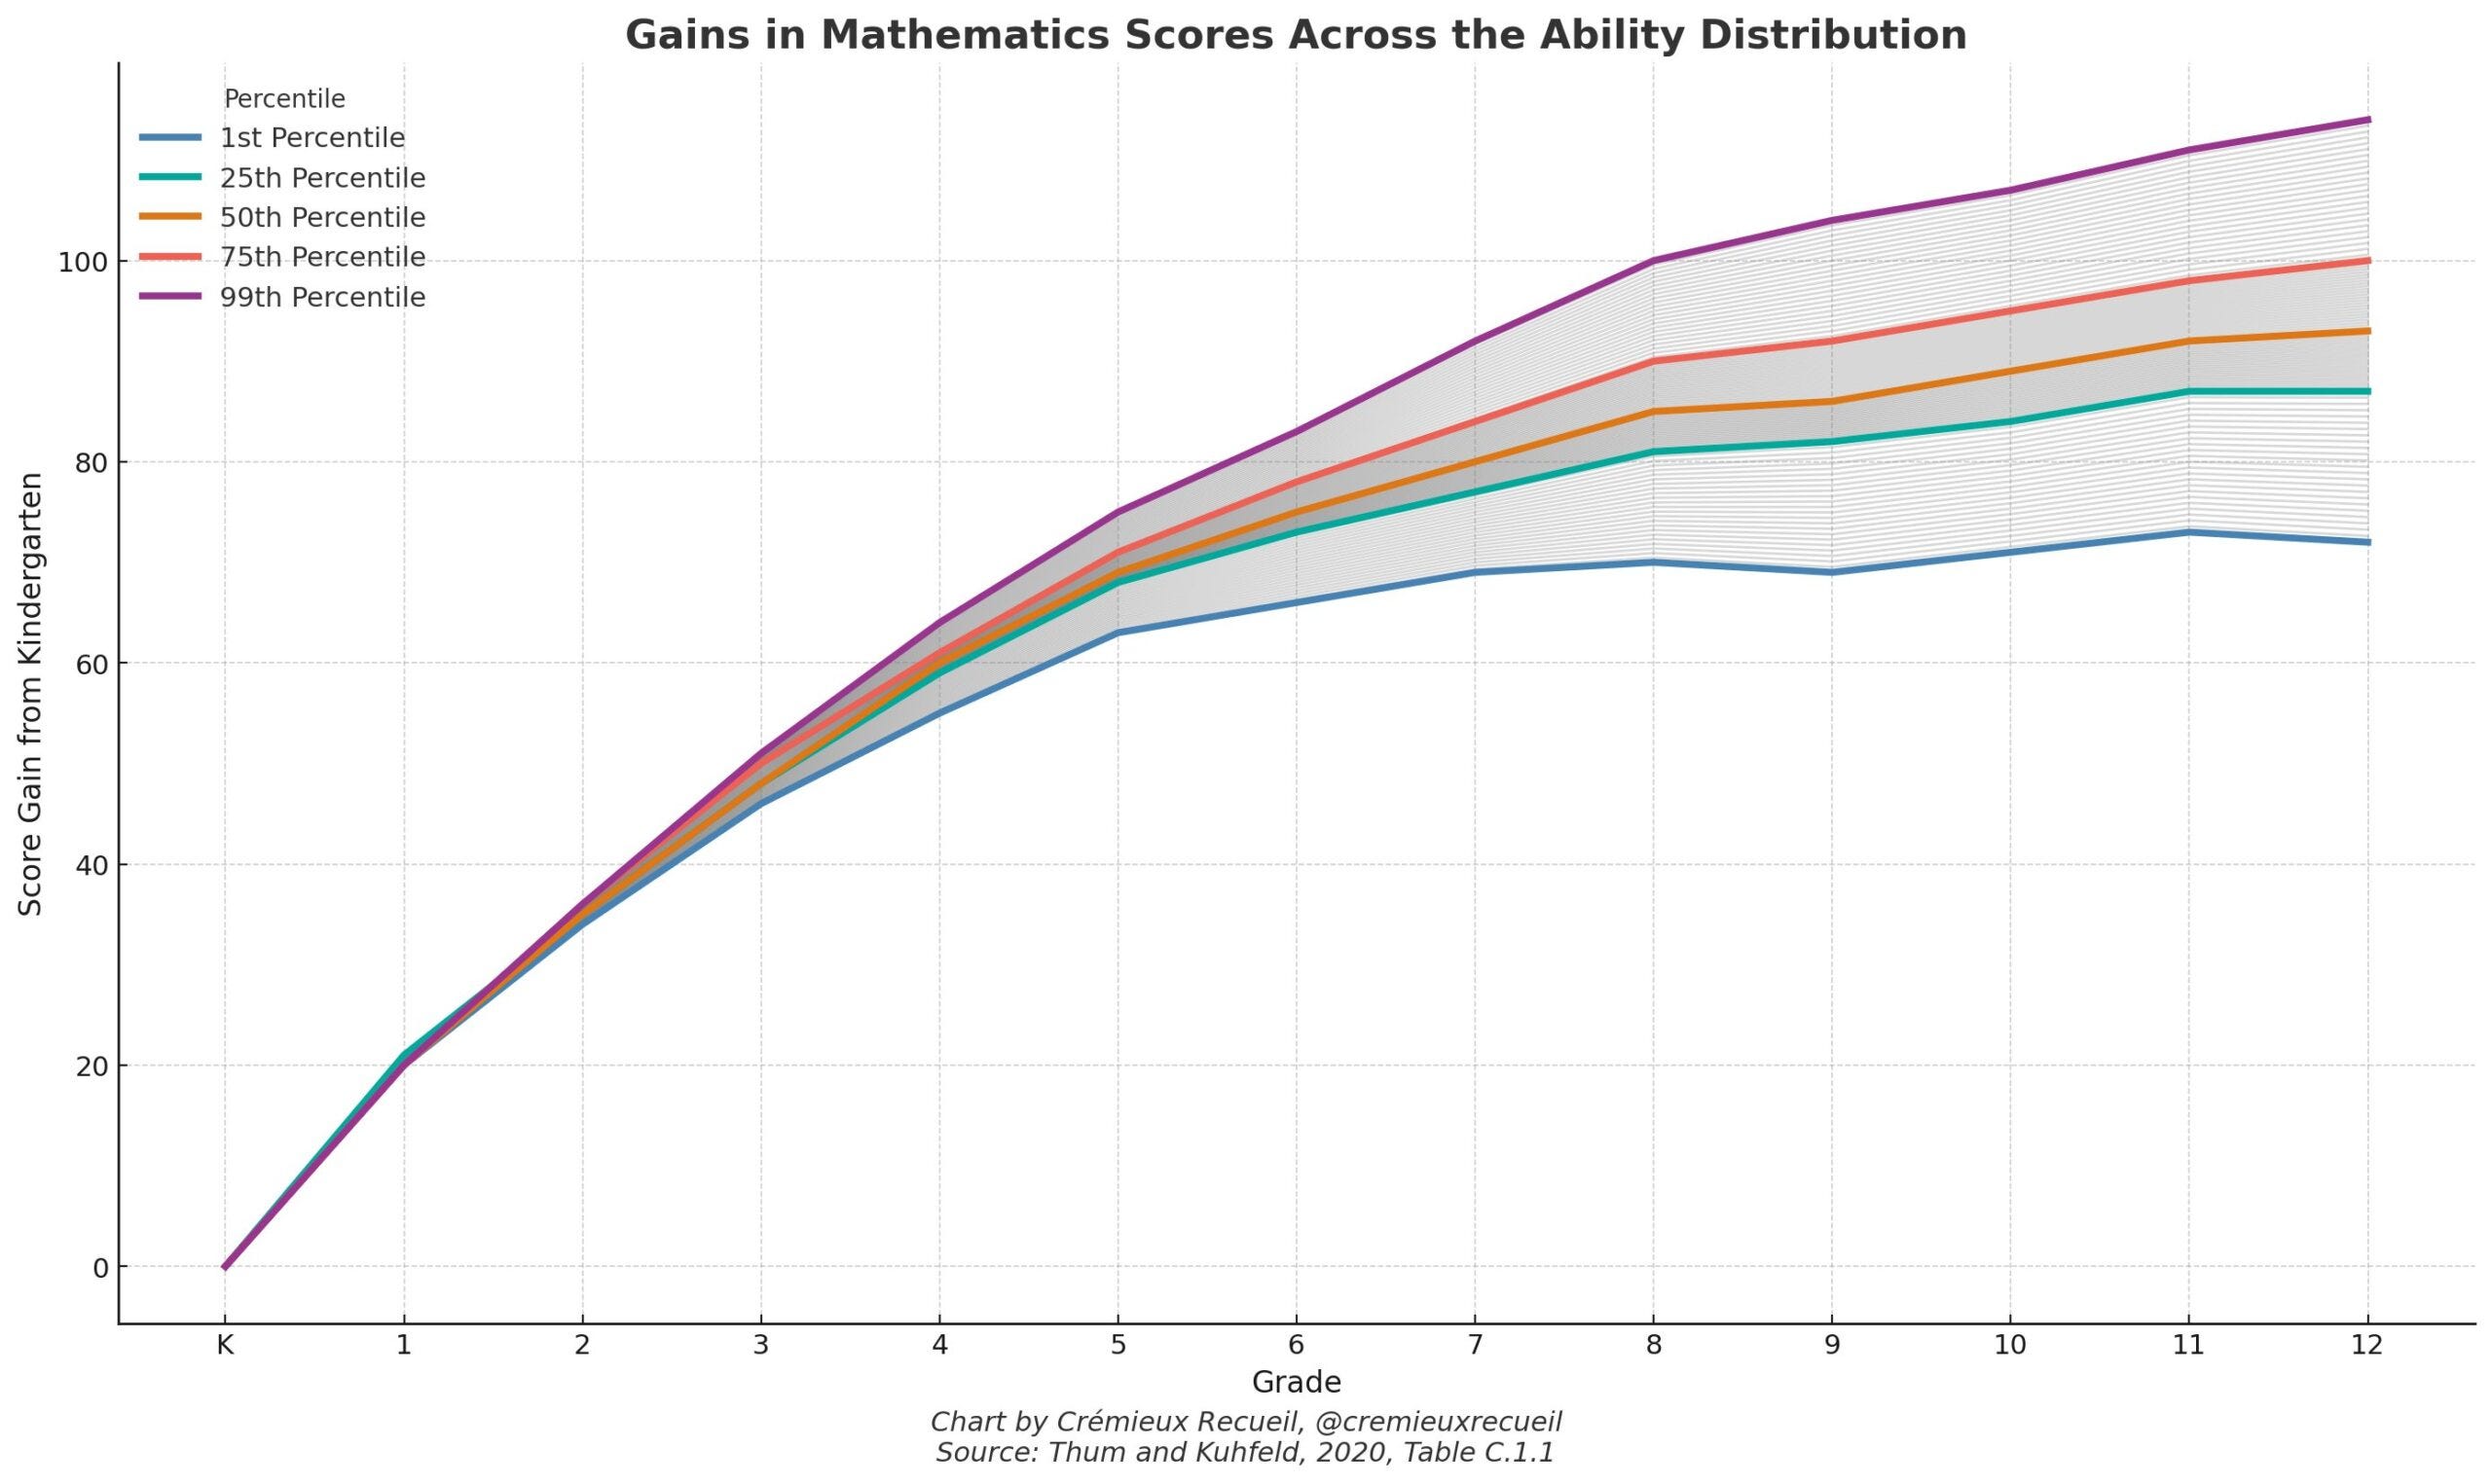
In this case, we can see that the bottom 1% of students almost don’t benefit of additional math schooling after grade 6-7. The top 1% keep learning, and their rate of progress may be due to test ceiling issues.
Regarding the Hindu vs. Muslim differences, they are very slight, but also perhaps important:
The mean difference is only 1.8 IQ, but the variance difference is nontrivial, larger than the male-female difference in modern data. In the second part above, we can see this results in disproportionately more Indians in the top ‘2%’, 130+ Indian IQ. Note that the percentages are not normalized into relative rates, but these we can calculate from the sample sizes:
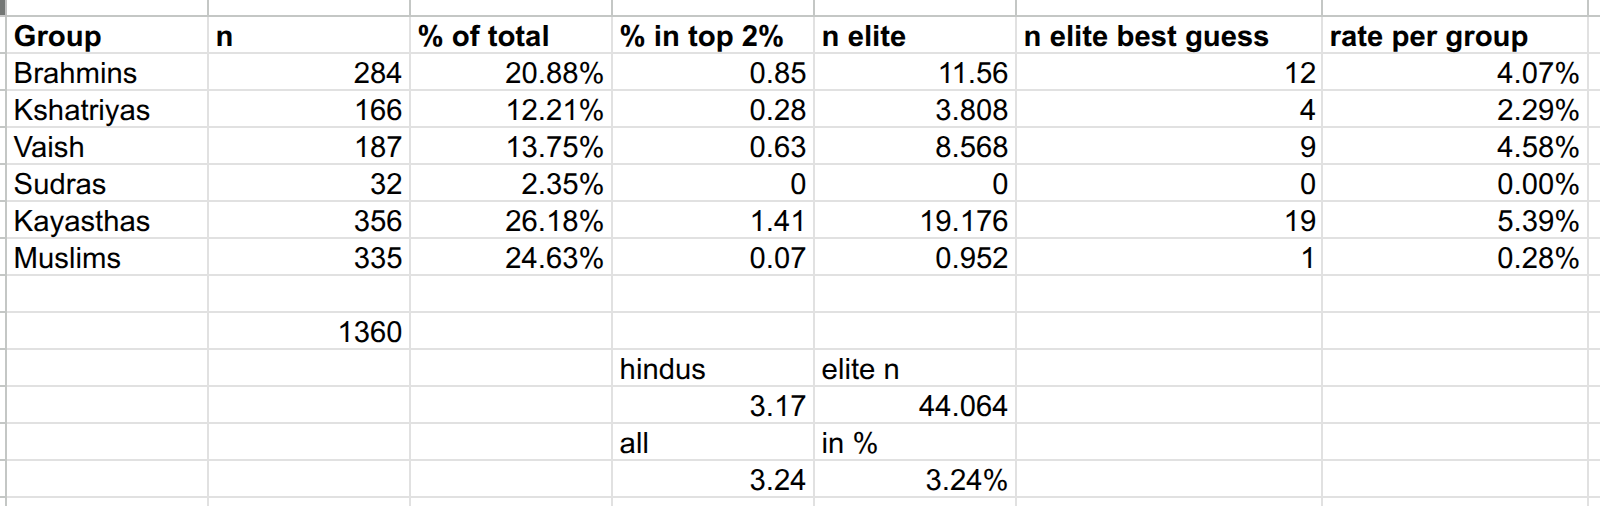
Note the number of students in absolute numbers in the top 3.2% is quite small (e.g. 1 Muslim). The relative rate was higher for the more elite castes. And for those wondering who the Kayasthas are:
Kayastha (or Kayasth, IPA: [kaːjəst̪ʰ]) denotes a cluster of disparate Indian communities broadly categorised by the regions of the Indian subcontinent in which they were traditionally located—the Chitraguptavanshi Kayasthas of North India, the Chandraseniya Kayastha Prabhus of Maharashtra, the Bengali Kayasthas of Bengal and Karanas[2][3] of Odisha. All of them were traditionally considered “writing castes“, who had historically served the ruling powers as administrators, ministers and record-keepers.[4][5]
Not too much can be made of this analysis given the limited statistical precision in the upper end.
As a bonus, the dissertation not only contains the test items, but even the raw data:
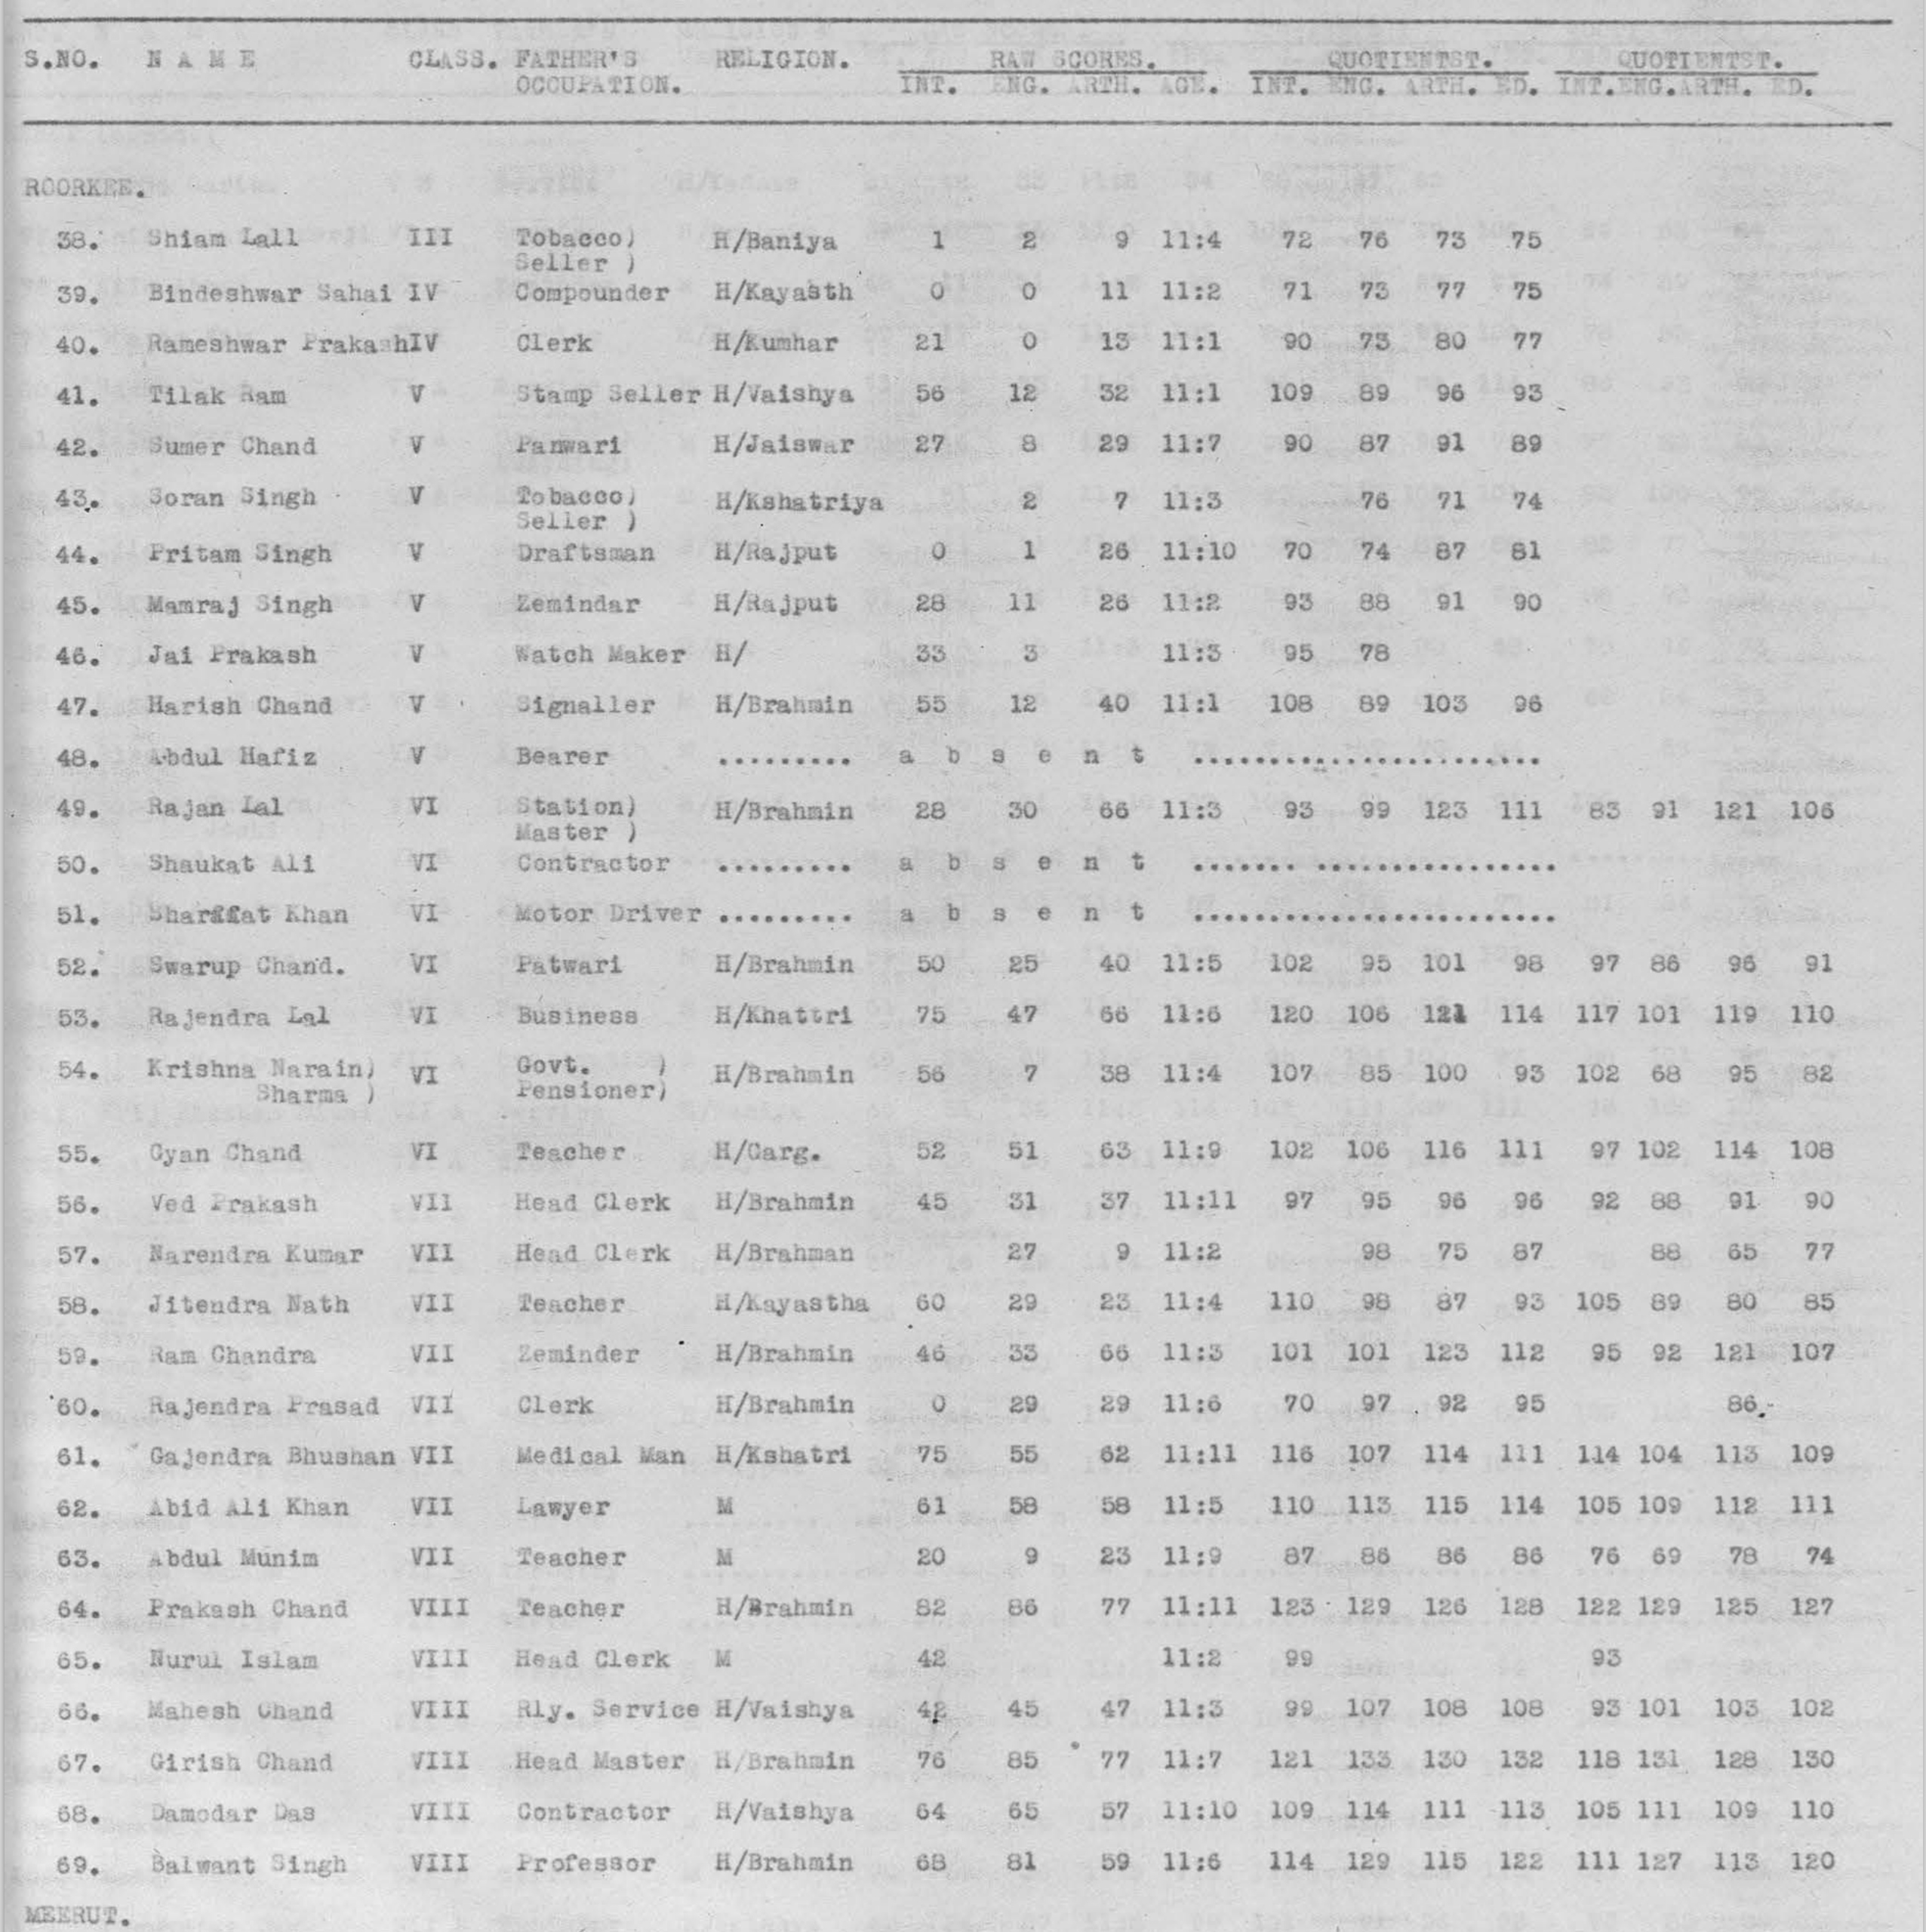
That is, if you are willing to OCR 58 pages like this, you could essentially obtain the complete dataset from this study. You could even use the real names listed to potentially find the same people later in life and see how well these cognitive tests predicted life outcomes. A great opportunity.
This study doesn’t tell us anything directly about the mean Indian IQ since the tests were newly developed (which is a shame because that’s why I originally decided to read the dissertation). Someone (you) would have to administer these questions to modern Western 11 year olds to find out. The most difficult part may be how much of a correction to apply for the elite selection at the time. Both of these tasks are left as exercises for the reader (still you).
1. Important to note that *despite* elite selection, Brahmins are still at the top, while Shudras are at the bottom, as per stereotypes and common sense.
Major counter to more recent claims that Brahmins don't stand out in IQ.
2. Noticing that Kerala is elite, as usual. (45% literacy in 1941).
PS. Just noticed the study is from Agra and Oudh (that's Uttar Pradesh). Brahmin IQ advantage is vastly smaller to non-existent in that region. So the fact that a minor advantage was found, despite this and being confounded by elite selection, says a lot.
Great find! Too bad we don’t have a funding mechanism to fund even the low-hanging fruits of HBD studies across the globe.
The part about mastery system shocked me. In 1941, in India no less. Sound too good to be true.
So I asked GPT-5 it says almost no part of India had that except some very small localized eduction systems.
I wonder where Lynn got it from?