
IQ's by university major from SAT's
1600 SAT is about 135 IQ if you were wondering

There's a bunch of these claims floating around. The good ones are based on Razib Khan's 10 year old write-up, which I also reblogged later. It looks like this:
The data are based on GRE scores (Graduate Record Examinations), that is, a scholastic test taken to attempt to get into graduate school, which for those who are not Anglos, means to get into Master's/Candidate or PhD/doctorate programs at university. The scores do not have any obvious translation into IQs in the general population. So though these data tell us that physicist applicants get scores of verbal scores of 540 and math scores of 743, and these average 0.85 z above the average applicant, this doesn't tell us whether this corresponds to 120, 130, or 140 IQ. So how can we do better?
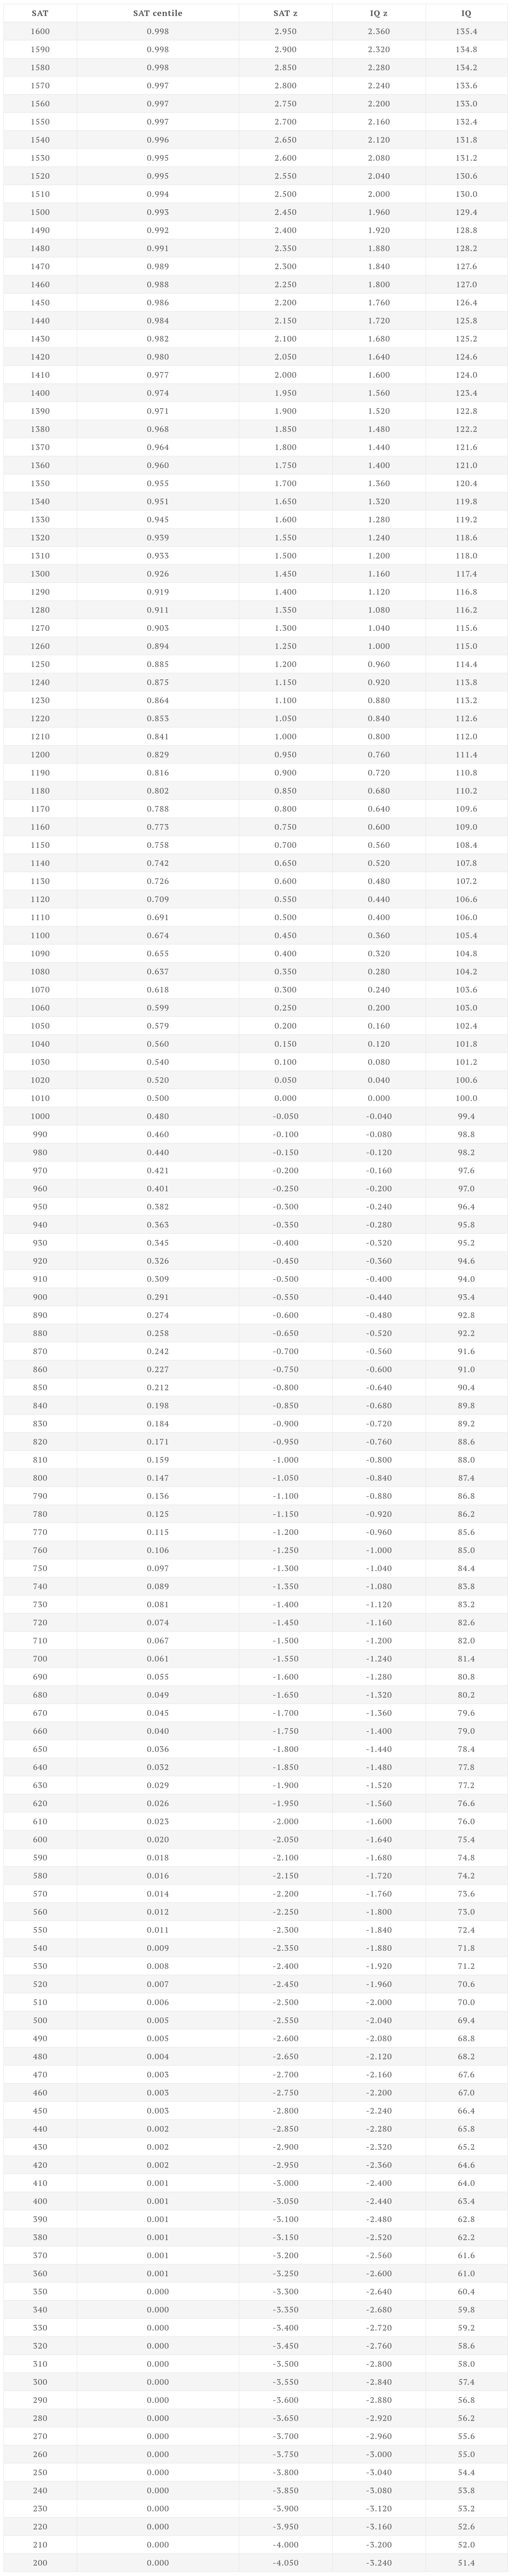
The SAT test average scores are also available by groups of majors (direction of study/field). These are taken by people who want to get into undergraduate (bachelor) degrees, and in some US states are taken by all students (e.g. Connecticut), meaning we know how well the average persons of at least those state do. But there's something even better, a general population norm sample, so we know the centiles (ranking out of 100) that each SAT score corresponds to. These can be found in this report, and looks like this:

So 1010 SAT is what corresponds to 100 IQ (50th centile). The standard deviation is close to 200, 195 is the national SD given in this report. Since this is based on the somewhat selected sample, we can probably bump this up a bit, say 200-210. The correlation between SAT and IQ in a representative sample is about 0.80 if there were no measurement error and no restriction of range. The fact that this correlation is not 1.00 means is that you cannot take 99th centile SAT and convert to 99th centile IQ. You have to apply some regression towards the mean. You have to use the z scores for this as centiles are non-linear transformations. 99th centile SAT in the table is about 1450 (rounded). If we compute it using the mean of 1010 and SD of 200, we get 1475, which is pretty close. In z scores, this is 2.33. If we want to get the IQ for this, it is 1.86 (2.33 * 0.8), which is 128. In the same fashion, a perfect SAT of 1600 is 99.8th centile, and about 2.95 z, which is then 2.36 z on IQ, which is about 135. This is a lot less impressive than sometimes thought and presented on various websites because these websites implicitly assume a correlation of 1.00 between IQ and SAT scales. So here's a real look-up table for those who want to convert SAT to IQs:
[substack does not support tables, go to the Wordpress version to get a proper table]
We might of course question some of these conversions. A person who somehow attains a 200 SAT score presumably not actually retarded with an IQ of 51, but probably trying to fail the test on purpose. This kind of caveat is true of any very low test result, so keep it in mind.
University majors
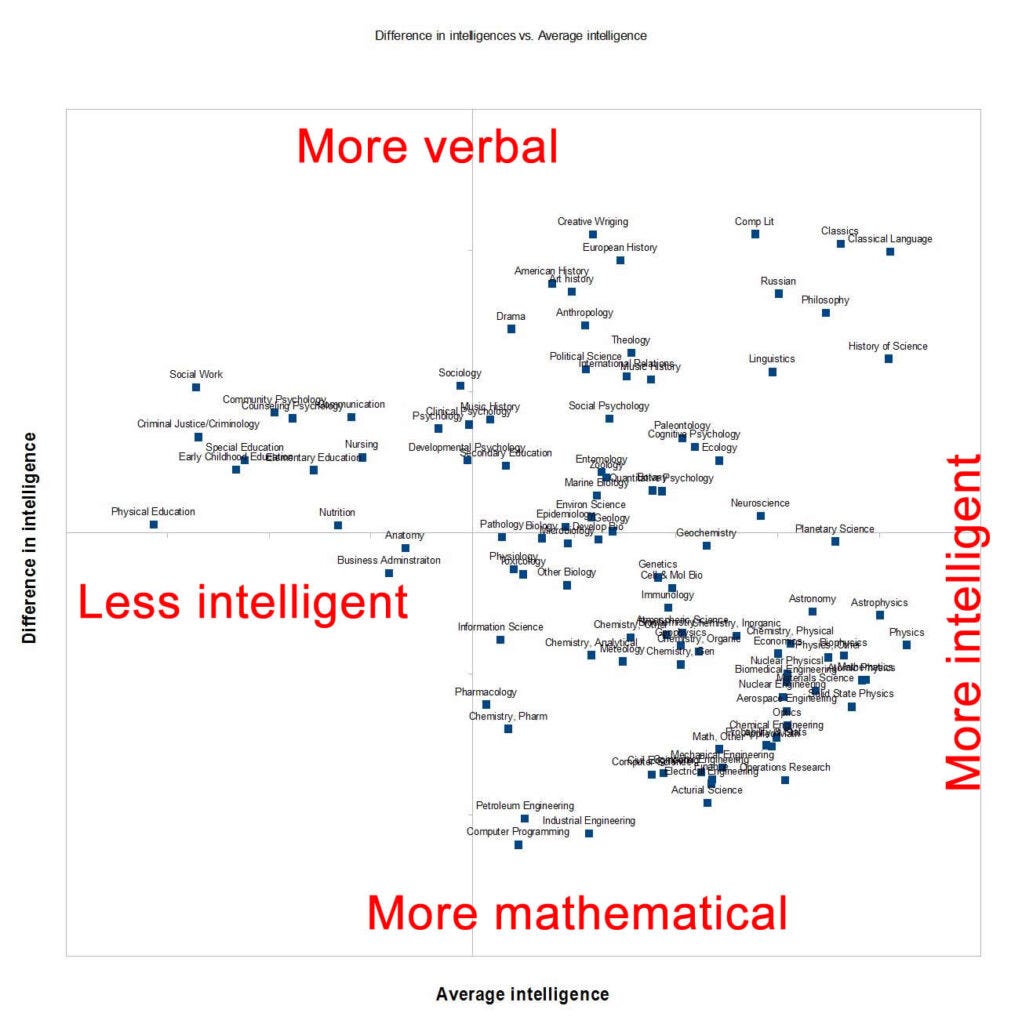
The SAT publishes a report every year with score means by intended major, based on some paperwork/survey SAT test takers fill out. Actually, they group the majors into 36 larger areas (details in this file). Since people do not necessarily study their intended major, or graduate from it, we have to take these results with some caution. Nevertheless, it looks like this:

The Y axis has the verbal tilt, i.e., difference of verbal and math ability, which is quite interesting in itself. If you prefer a simpler, easier to read plot, try this one:

In this grouping, the king field is Mathematics and Statistics, which covers the four majors Applied mathematics, Financial mathematics, Mathematics, and Statistics. Let me know if you find the average scores by these finer divisions, I am very interested. That aside, we see that there's quite a bit of spread across the fields, but also not as extreme as one might think. Math/stats is only at 116 IQ on average. In the other plot, the top fields are Physics (various kinds), history of science, and philosophy. Physics is here grouped with the other physical sciences (Chemistry, Materials science, even Paleontology), so that's presumably why it doesn't stand out as much. Philosophy is grouped with the relatively low IQ Religious studies field.
If you want more details, they are in the Rpubs notebook.
I assume this was using SAT scores from the past 20 +/- years. When I tested in the early 1980's, a score of 1600 would have been regional news and more times than not resulted in allegations of cheating. With today's relaxed scoring, there were at least a handful of perfect scores in my children's school each year, making intergenerational comparisons difficult.
How many times was the SAT re-centered? Many of us have scores that are from 30 or 40 years ago. Wondering how those scores are relative to today’s scores.