
Math scores for 2nd generation immigrants in Norway by country of origin
Obscure report yields few surprises

A reader sent me this interesting report that I had previously somehow not heard of:
Rune Jørgen Sørensen, Jon Marius Iversen, Johan From, and Hans Bonesrønning. Culture and school performance: Evidence from second-generation immigrants in Norway. 2015-2020
The paper studies how the cultural orientation of immigrant parents affects the school performance of their children. We use detailed register data on native and immigrant parents, featuring students born in Norway with one or two immigrant parents. The cultural values of immigrant parents are measured by cohort- and education-level specific survey responses in the World Value Survey and the European Value Survey, which are merged with individual-level data. The paper estimates effects on several indicators of school performance, controlling for detailed measures of the human capital of parents, school fixed-effects and relevant country-of-origin characteristics. We also analyze students’ schooling progression and control for initial performance. Finally, we exploit differences in cultural exposure as consequence of immigrant students having a native and an immigrant parent vs. two immigrant parents from the same country of origin, which allows us to include country-of-origin fixed effects. The results show that an independence-oriented parenting style yields better educational performance than parenting that values children’s obedience. A lenient child-rearing practice reduces student effort and weakens educational outcomes, which accounts for the modest schooling performance of Scandinavian students.
I can see that this report is first seen online in 2015 on Semantic Scholar, but appears still not to be formally published. Maybe it never will then. Many economist papers live a life of perpetual preprint.
The data are great, as usual with Nordic register studies:
Schooling is fully financed by the government, and enrollments in private schools are marginal. We have access to individual-level register data from Statistics Norway covering the entire student population for the 2007–2015 period. These data yield a direct and precise identification of native and immigrant parents and their country of origin. Immigrants to Norway are a self-selected group from the country of origin. We adjust for self-selection using individual-level data in the World Value Survey (WVS) and the European Value Survey. We identify the country-specific cultural values of sub-populations defined by cohort and education levels and we merge these cultural indicators with corresponding individual-level data on immigrant parents. The data allows us to analyze student tests scores, exam results and learning progression in primary and upper-secondary school as well as choice of specializations at the secondary level. We present regression models separately for students with one and two immigrant parents, and include control for immigration reasons, parental education levels, labor-market participation, household income levels, school fixed-effects and country-of-origin characteristics.
...
These statistics cover about 100,000 observations where students have one immigrant parent (and one native parent) originating from 101 countries, and about 59,000 observations where students have two immigrant parents originating from 97 countries. The students with one immigrant parent attend 2,961 schools, while those with two immigrant parents attend 2,086 schools. The data provides information on tests conducted when students were in fifth and eighth grade (in primary and lower secondary schools), exam results from the 10th grade, and whether they were enrolled in an academic track at the higher secondary level and the extent to which they chose theoretical math at this level.
The authors adopt a typical culturalist model about rearing methods (yawn!), which strains the imagination:
The baseline epidemiological model assumes that people coming from different countries differ in cultural orientation only, conditional on the controls included in the regression models. This approach might produce biased estimates of causal effects as consequence of unmeasured country-of-origin features affecting both parental values and school performance. One way of accounting for this is the value-added model, where we estimate cultural effects, controlling for students’ initial test scores. Another strategy exploits that children with identical ancestry have been exposed to different doses of country-of-origin culture. Cultural effects are diluted for students who have receiving a larger infusion of Norwegian culture. We estimate models for students with two immigrant parents coming from the same country vs. students with one immigrant and one native parent, which allows us to include country-of-origin fixed effects.
Naturally, the report has no mentions or intelligence, national IQs, Richard Lynn, Heiner Rindermann, and of course not genetics or heritability. Though they do allow that "parents coming from different cultures differ with respect to relevant human capital indicators", they are thinking of education here.
Anyway, since their data are so good, let's look at the primary results:
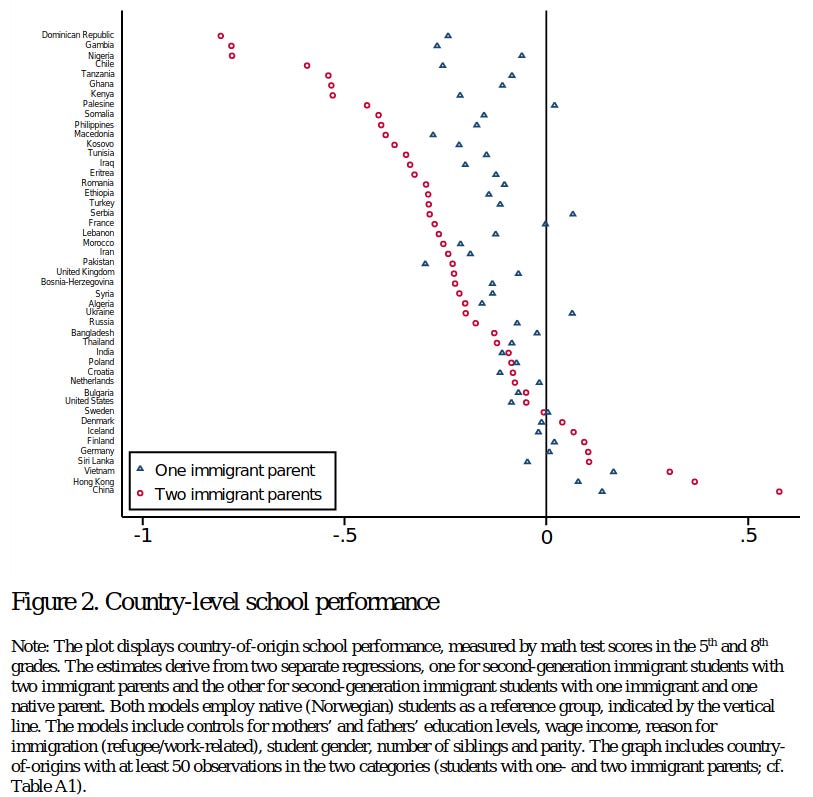
A quick skim of the results suggest they are looking quite normal with African origins in the bottom and Asians in the top. There's some selection effects, Sri Lanka is among the top scorers, though the country has average intelligence of about 80 (87 in Becker 1.3.3, 79 in Lynn 2012, 78 in Rindermann 2018, datasets respectively). The results for mixed offspring seem a lot more noisy, probably because the effect sizes are halved. Authors note: "The two estimates correlate positively; the bivariate correlation coefficients are r = 0.58 (unweighted) and r = 0.74 (using number of students as weights).". What gaps do we expect to see for the mixed children, in general? It depends on patterns of assortative mating and specific origins, and so the expected gap of halfway between Norwegian and origin country IQs for these matches is not exactly right. If for whatever reason, it is associated with intelligence to marry a Nigerian in Norway (social signaling perhaps), then offspring of Nigerian-Norwegian couples will be somewhat higher than expected from the country IQs.
Overall, the gaps are not that big. The African origins have gaps of about 0.75 d at most. This is based on the national level SD, so these are a bit too small since the SD is inflated by the group differences, but probably removing this issue would only increase to about 0.80 d. Overall, the mean for African countries seem to be about 0.50 SD. Now, we know the national IQ gap is more like 30 IQ (100ish vs. 70ish). We expect something like 65% of this gap to be genetic. So assuming all that in a simple model, the gap for Africans should be about 20 IQ, or 1.33 d. So what gives? The answer lies exactly in their caption:
The models include controls for mothers’ and fathers’ education levels, wage income, reason for immigration (refugee/work-related), student gender, number of siblings and parity.
This is of course the sociologist fallacy. For those not familiar with this idea (see here for more details). The problem is that adjusting for these factors also adjusts for genetic gaps, if such exist. Thus, gaps are expected to be smaller when they are adjust both in the case of no genetic causation and in the case of genetic causation, but results like this are very, very typically erroneously interpreted as supporting an environmentalist model prediction over a genetic one.
The authors do compare these country effects (fixed effects from a model that adjust for all that other stuff mentioned above) to indicators of national intelligence, though not in those words:
If immigrants to Norway have cultural values in line with the population in the country of origin, we would expect the country-level estimates to correlate positively with test scores obtained by students living in the homeland (cf. Levels et al. 2008). In Appendix Figure A3, we display a plot where the country-level estimates (i.e., a complete set of estimates) are measured on the horizontal axis, while the vertical axis measures the test scores in math obtained in the TIMSS 2011 and the PISA 2012 studies. The bubble sizes are proportional to the number of immigrant students used to estimate the baseline regression model. The plot indicates a positive relationship between the international test scores and the estimates obtained in the Norwegian national tests. A regression with PISA and TIMSS scores as response variables indicates an R-square test statistic of 0.55 and 0.45 respectively for students with one immigrant parent, 0.49 and 0.26 respectively for students with two immigrant parents. This indicates a high degree of external validity in the cross-national pattern observed in Figure 2.
Since they only use a single year of data, this method is suboptimal. It is better to take the national IQs from Rindermann (mainly based on scholastic tests) and compare them. They provide the sample sizes in the appendix, and the effect sizes I have extracted from the figures. The samples sizes are given in the appendix. You can find the Norwegian data here. So let's look at the correlations!

OK, so it looks pretty normal. Both generations supply values that correlate approximately evenly well with national IQs. In a simple world, we would expect this correlation to be near 1.00, but in the real world, one has to deal with sampling error, non-random mating, non-random immigration selection across countries, unclear effects of controlling for education between groups (a phd in Ghana does not mean the same as a PhD in Germany but that's what the model assumes). Anyway, so we are reasonably happy with r = .60ish. (The authors report much higher R2s, 26% to 55%, ours are about 36%. Who can say exactly what they did? I guess they reported the wrong numbers.). We can also combine the two sets of estimates to gain a bit more precision, which should improve the correlation with national intelligence a bit:

Indeed, the correlation increased by about .08 (not a significant change, no weights used here).
To their credit, the authors try to poke at causation by looking at Asian adoptees (why not others? Probably the results were unflattering and best left out):
The school performance of adopted children
If parent culture has a causal effect on children’s school performance, we should see no similar effects when native parents adopt children from other countries. Students from Korea and China do exceptionally well in international tests as well as in the Norwegian context. We would not expect to see similar effect for children adopted from these countries. We analyze the school results of adoptees from these countries24, and compare them with results for students with immigrant parents. Native students are used as the reference group. Dummy variables capture the "Korean" and "Chinese" effects: the adoptees (N = 1823, Korea; N = 2993, China), and students with one or two immigrant parents from Korea (N = 724) and China (N = 1550).25 The regression specification is otherwise similar to the model in Figure 2. Appendix Table B7 shows the results. Students born in Norway with one Chinese or Korean immigrant parent do significantly better than native students do. The two-parent effects are larger than the effects for students with one immigrant parent from China. The estimates for students with two immigrant parents from Korea are negative, while we should expect a positive coefficient. However, there are only 25 students in this group, so we must be careful with the interpretations. The estimate for the adoptees is negative, but much smaller (in absolute values) than effects for students with two immigrant parents.26 This lends additional confidence to the interpretation that parents' cultural backgrounds account for the estimates presented in Figure 2.

The results are peculiar. Authors don't have any explanation. I mean, the simple answer is that it is likely chance since n=25 for that group. The model output says the standard errors are tiny (in parens), but authors tell us the sample size is 25, so something is wrong with their model output. From a genetic perspective, the results are not particularly surprising. The children of Asian immigrants do somewhat better than Norwegian average. The adoptees about the same as the Norwegians. Adoptees are not selected for intelligence for migration, probably somewhat anti-selected, but Asian immigrants are.
The authors state their conclusion bluntly:
Immigrant students to Norway display substantial differences in mathematics achievements when they are classified by country of ancestry. These differences persist after employing extensive controls for family background, including several indicators measuring parents' human capital. These country-of- origin differences go in the same direction for students with one and two immigrant parents, the latter usually being larger. We also see that the country-of-origin disparities correlate positively with national test scores as observed in PISA and TIMSS.
Then finish with some more culturalist explanations we don't care about. All in all, a cool study that confirms the usual cognitive gaps even with extensive sociologist fallacy controls in place. It can no longer be claimed that group gaps are just due to "mothers’ and fathers’ education levels, wage income, reason for immigration (refugee/work-related), student gender, number of siblings and parity" as these were controlled.
Not suprise at all if you're aware of genetics.