
Migrant selection and informative priors
Simulations to train our intuition

Chris Rufo wasn’t happy with the recent American experience with the Somalians scamming the welfare state and wrote about how one should take into account “which national populations” people wish to immigrate from into the USA. Some naive people had a math misunderstanding in regards to this:
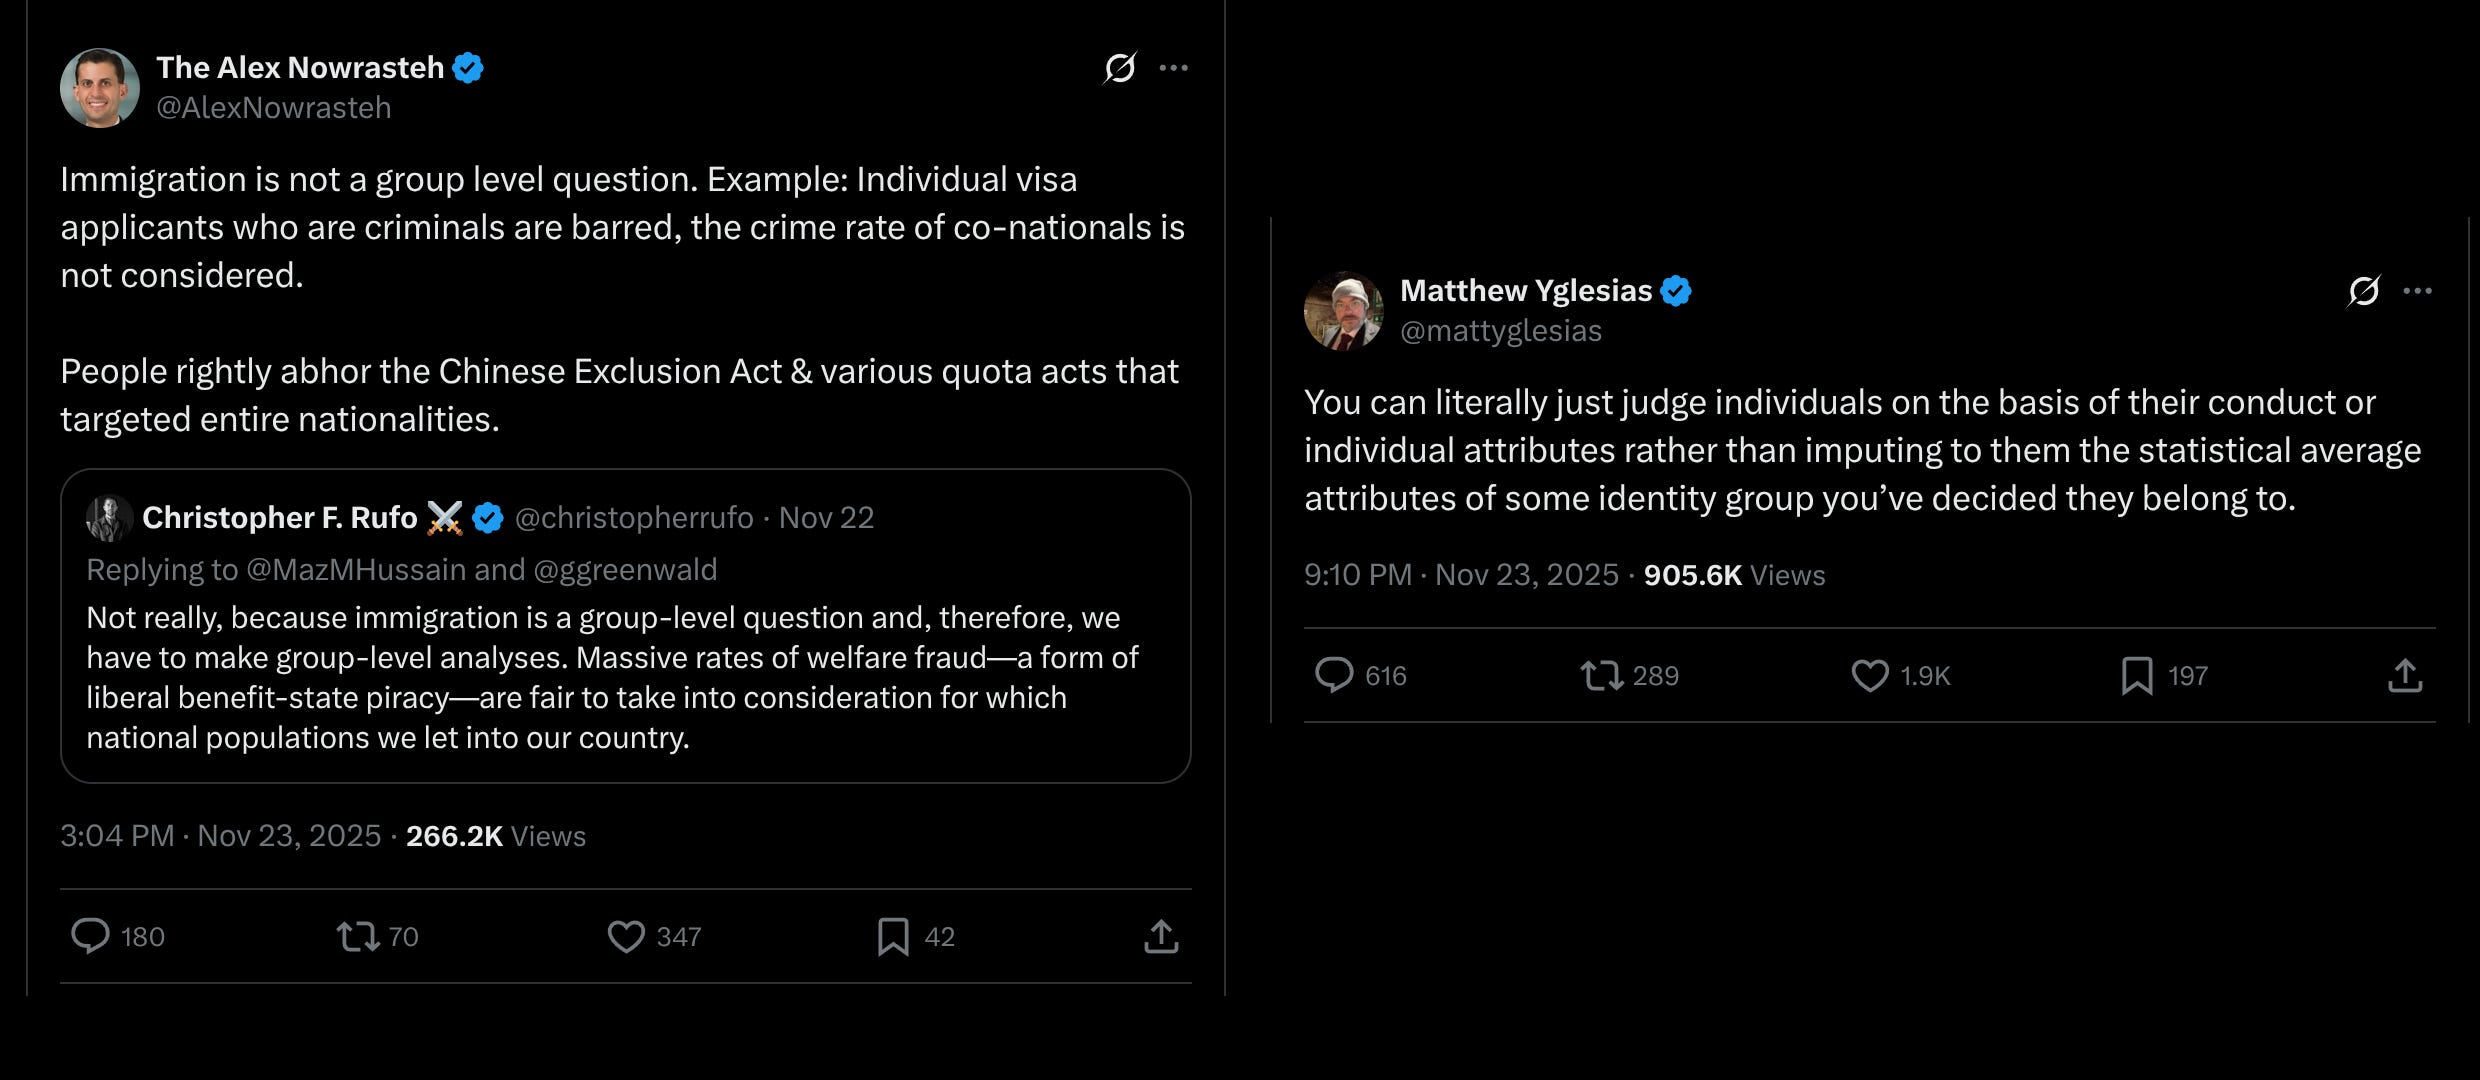
I tried to explain it to Alex Nowrasteh but he acted in his typical smug + wrong fashion that make him so popular. Anyway, the matter is not so difficult to understand statistically speaking. Consider this scenario:
You are a country and you are considering admitting some immigrants for the work force.
You understand that selectivity is key to the success of the policy. You want a simple system that admits anyone above a certain threshold, but are unsure what threshold to use.
Suppose you are just going to use an IQ test, or some other composite variable with the same scale. Assume this test is not biased.
The potential migrants are not selected for IQ from their country of origin to begin with (simplifying assumption we could relax).
Here’s some simulation results:
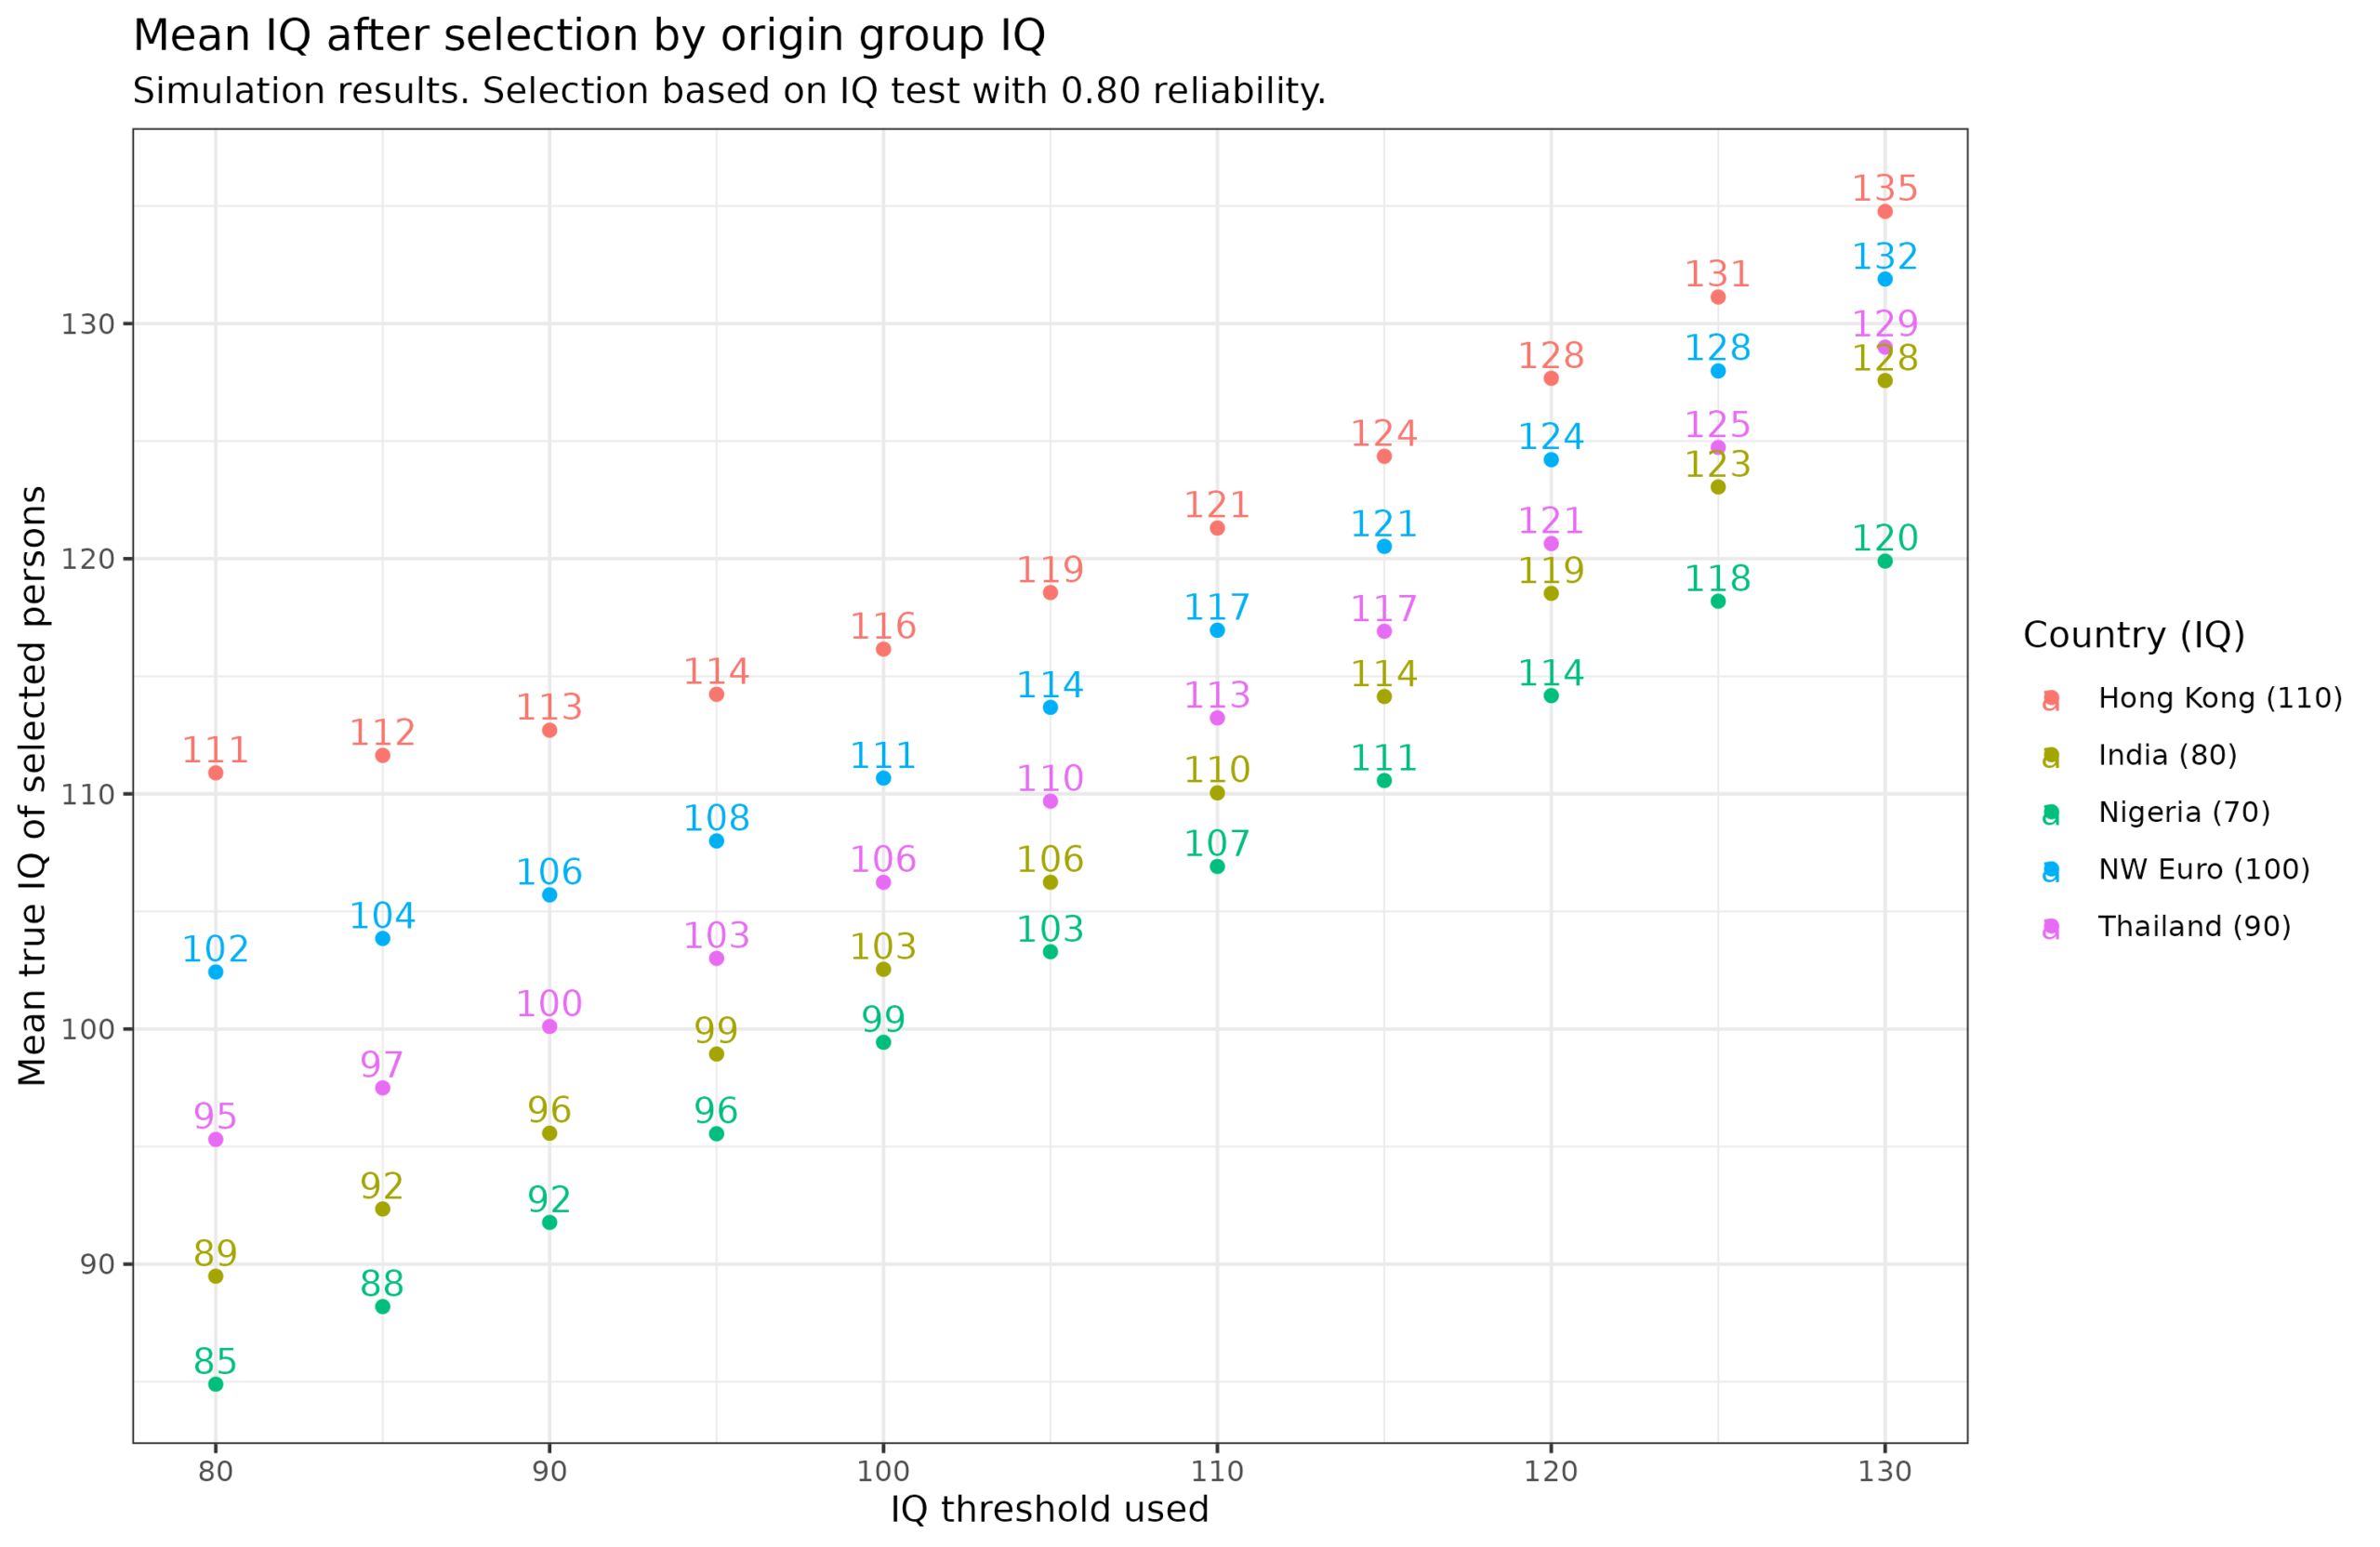
Here we assume the test has a reliability of 0.80, which is around the value of a decent but practically short test for this kind of situation (like a group-administered nonverbal test). The IQ threshold varies from 80 to 130, depending on the hypothetical system you are considering to use. The plotted values show the true IQ means of the people admitted as a function of the threshold applied to the measured IQs and the country or region of origin (with plausible values). We can note a few things. First, no matter the threshold used, the groups have the same rank order before and after the selection event (this fact confuses many people). Second, the gaps are larger when a lenient threshold is used and smaller if a stringent one is used. Third, the same threshold applied to different origin populations does not lead to the same human capital in the selected persons. As a matter of fact, doing no selection at all results in 110 for Hong Kong (their national mean) but you have to apply a threshold of 115 to get Nigerians with the same mean, 110 for Indians, 105 for Thai, and 100 for NW Europeans.
But what if the test is far from perfect? In practical situations, maybe the US government is incapable of giving people a valid test, so they rely on various less accurate indicators such as educational degrees, recommendations and so on?:
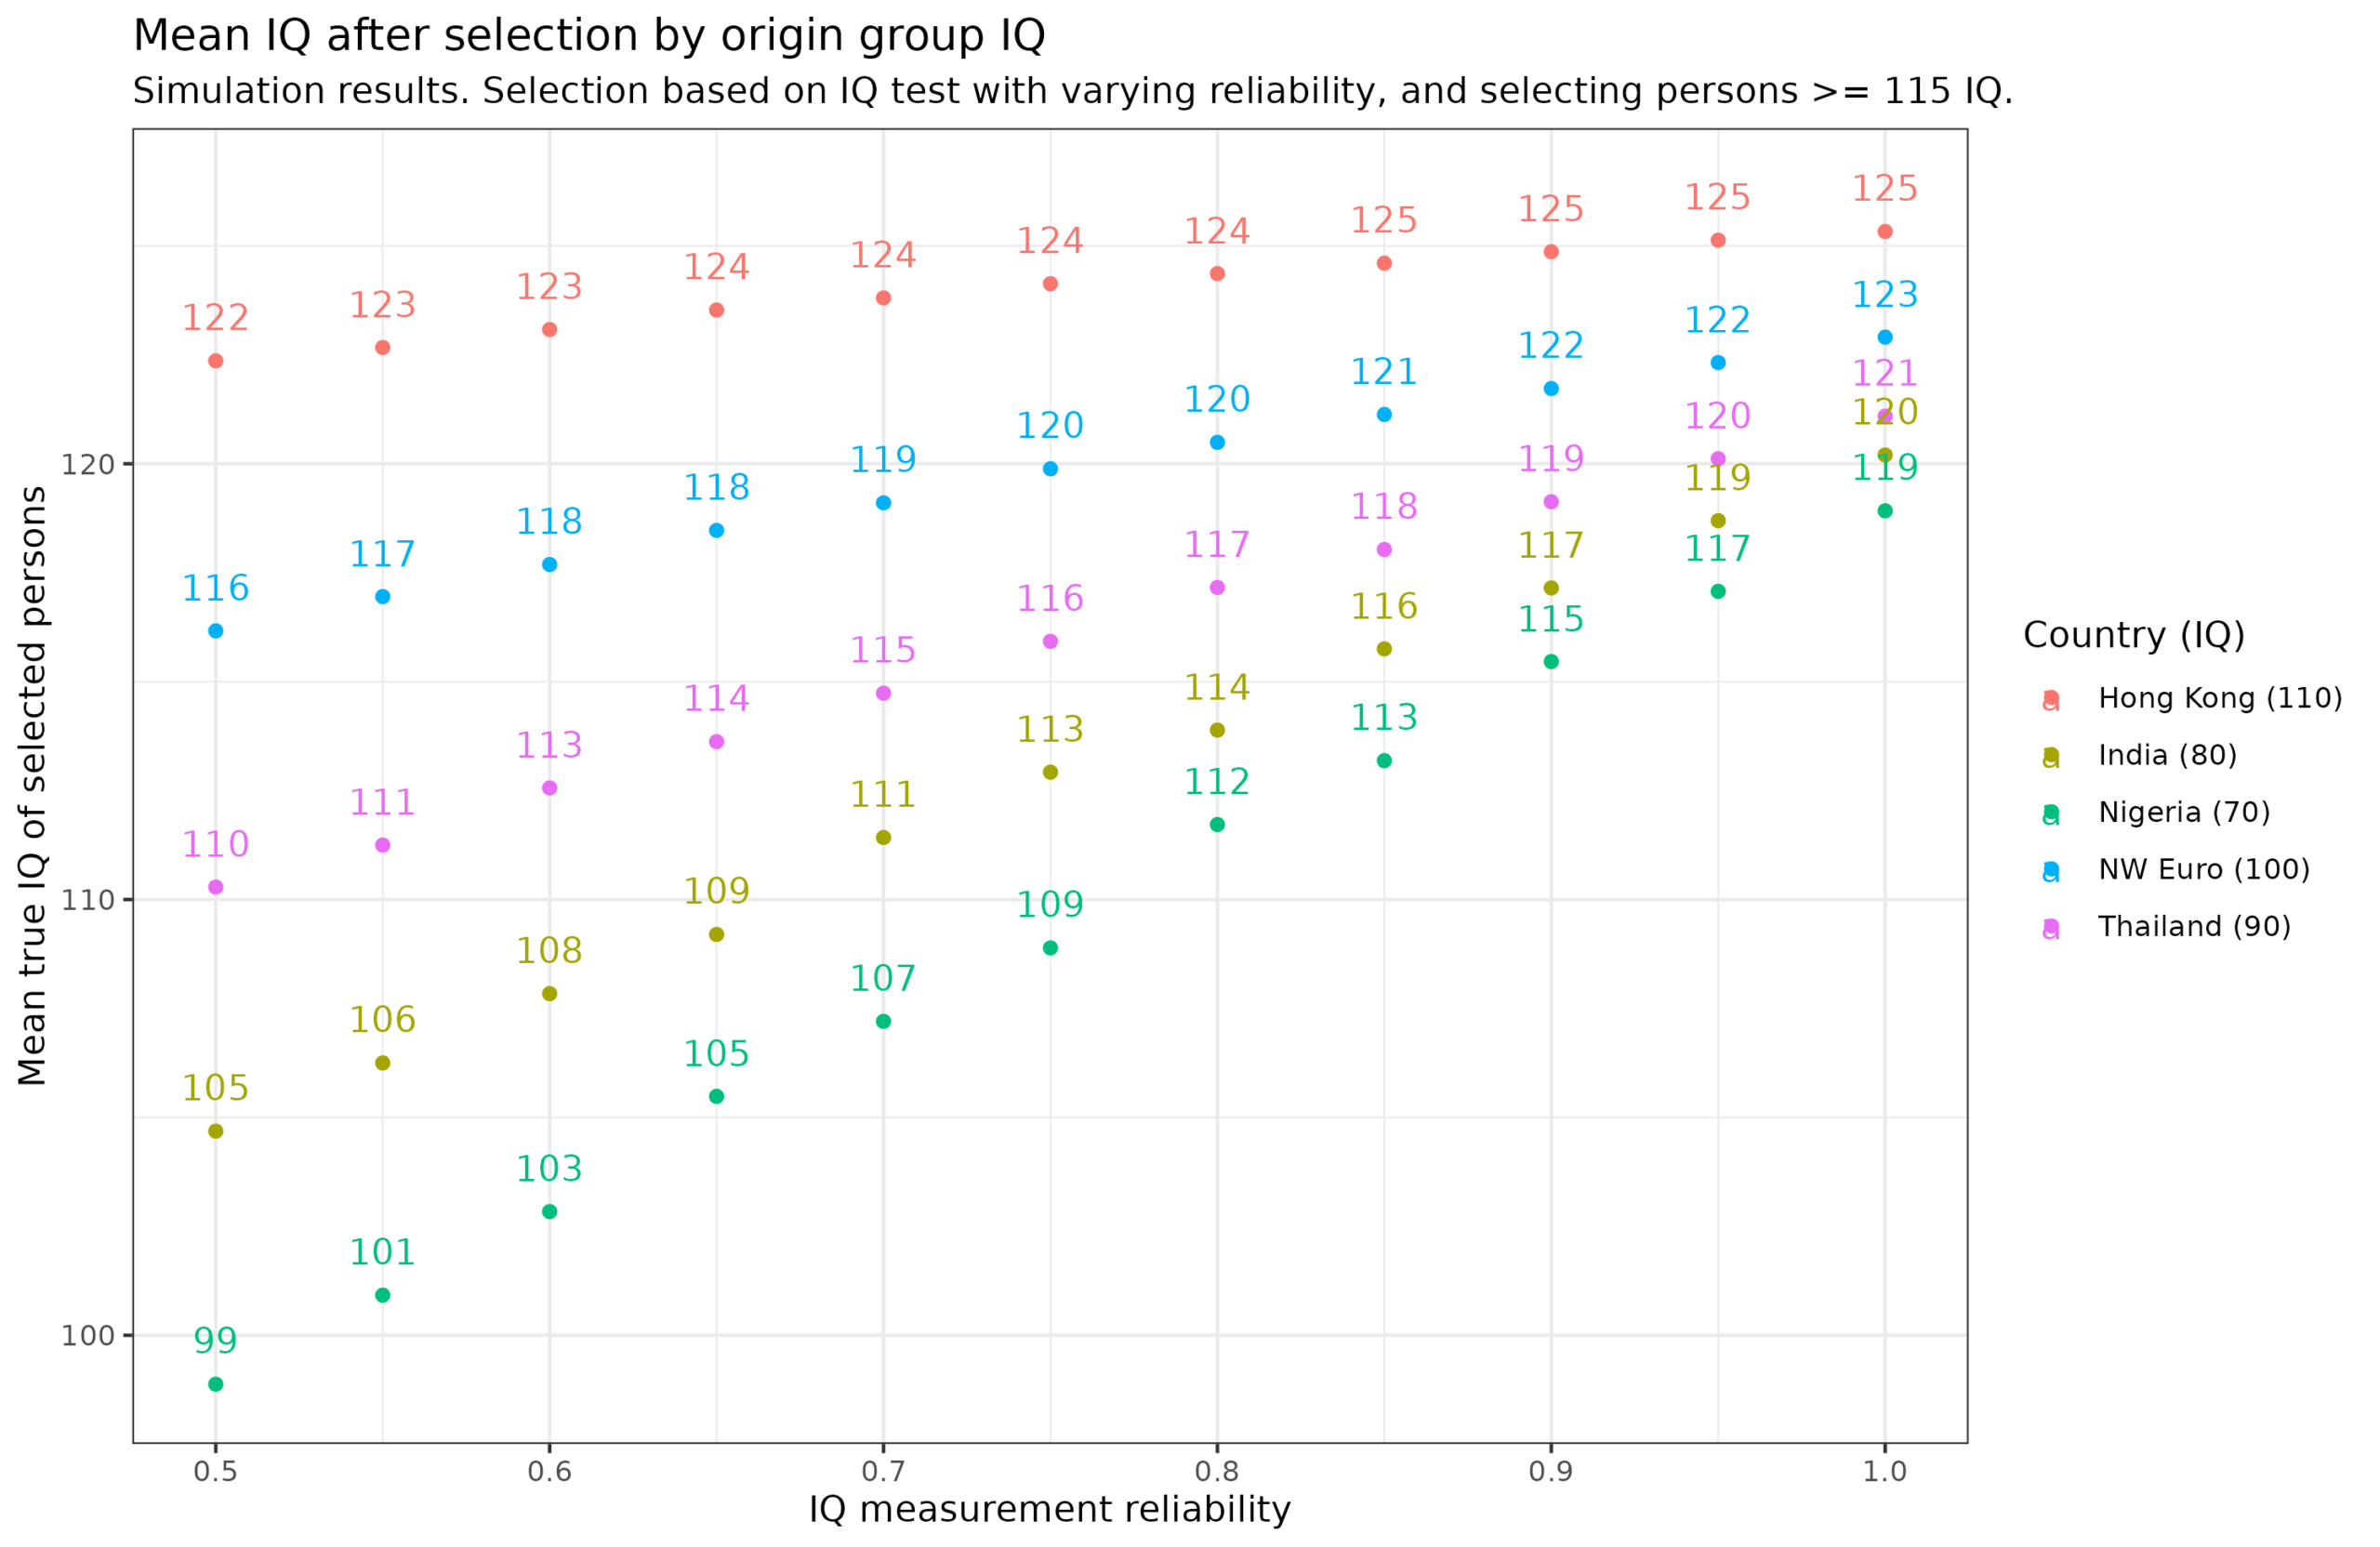
Perhaps a realistic practical immigration composite score might correlate at 0.60 with the intended target trait (’human capital’). If we set our target at professionals defined as 115+ IQ (the top 16% of the population), we can see the effects of varying the reliability of the test. It can look dire. If the test only has 0.50 reliability, even selecting Nigerians for a putative 115+ score filter yields a mean true IQ of the selected group of only 99 IQ. It is only at reliability = 0.90 that the selected Nigerian group achieves a mean of 115. The same story holds for the other groups, just less extremely. On the other hand, for Hong Kongers, it hardly matters what the reliability is. This is a lesson: you don’t need to do a lot of selection if the human capital is already high. You could in fact do no selection at all and end up with a mean of 110. This is cheap and effective.
Is there a way to fix this problem? Well, the mathematical problem is that we observe values with errors, or in other words, rely on imperfect proxies of the thing we are interested in. We cannot both maximize achieving the policy goals and subscribe to maximal individualism at the same time. The equation for estimating a given person has this general form: true IQ = measured IQ*weight1 + group_IQ*weight2 + error. The relative importance of the weights will depend on the reliability of the test.
You may recognize this as a simple case of Bayesianism and it is. There is both a frequentist and Bayesian solution to this issue, but let’s just use the frequentist one for simplicity. Arthur Jensen discussed this problem with regards to university applicants back in 1980 (Bias in Mental Testing):
Measurement Error and Selection Cutoff. A technical question arises involving the fact that measurement error is greater for more extreme scores. This shows up on retest or on an equivalent form of the test as “ regression to the mean,” which simply means that, on average, retest scores will fall closer to the mean by an amount that is predictable from the test’s standard error of measurement, SE_m , or its reliability, r_xx. Because all obtained scores contain some error, scores that are more extreme deviations from the mean are more likely to contain larger error deviations than less extreme scores. Therefore, a more extreme selection cutoff for any group is bound to result in more error than a less extreme selection cutoff, as the regression is toward the mean of the population from which one is selected. One could ignore this problem and thereby give selectees drawn from the population whose mean is farthest from the selection cutoff the “ benefit” of the measurement error. Or one could correct for group differences in measurement error by using estimated true scores instead of obtained scores. Because estimated true scores are always closer to the population mean than are obtained scores, persons who obtain high scores are apt to complain that they have been cheated out of a few score points by conversion to estimated true scores.
True score is a theoretical abstraction in psychometrics. It is the hypothetical score that would have been obtained, had there been absolutely no measurement error. It is a hypothetical score because, of course, in reality there is no perfect measurement. But, by making the reasonable assumption, which is universal in scientific measurement, that errors of measurement are random, uncorrelated, and normally distributed, we can make a statistical best estimate of an individual’s hypothetical true score from his obtained score on a test, provided that we know the mean and the reliability of test scores in the population from which the individual was selected. The estimated or regressed true score, X, as it is called, is given by the following formula:
Estimated true score = r_xx(X - mean_X) + mean_X
(r_xx = reliability of X)
For example, if a person from a population with a mean IQ of 100 obtains an IQ of 129, his estimated true score would be 126.1, if the test’s reliability is .90. If another person from a population with a mean IQ of 85 obtains an IQ of 131, his true score would be 126.4. It can be seen that it makes but little difference when the test reliability is fairly high. (Tests with reliability of less than .90 probably should not be used, except in combination with other measures, for making decisions that affect individuals.) But what if the selection cutting score were an obtained IQ of 130? If the individual’s score were close to the selection cutoff, a small difference could affect a sizable number of individuals whose scores were very close to the cutting score. How this should be handled in practice is usually not a strictly psychometric problem but a policy decision based on numerous considerations. For individuals with scores close to the cutoff, obtained scores are biased (because of measurement error) in favor of individuals from whichever population has its mean farther away from the cutoff score. This constitutes a form of biased discrimination, which, from a strictly psychometric standpoint, it is desirable to minimize. The best available method for doing so is to use estimated true scores.
So let’s try it out:
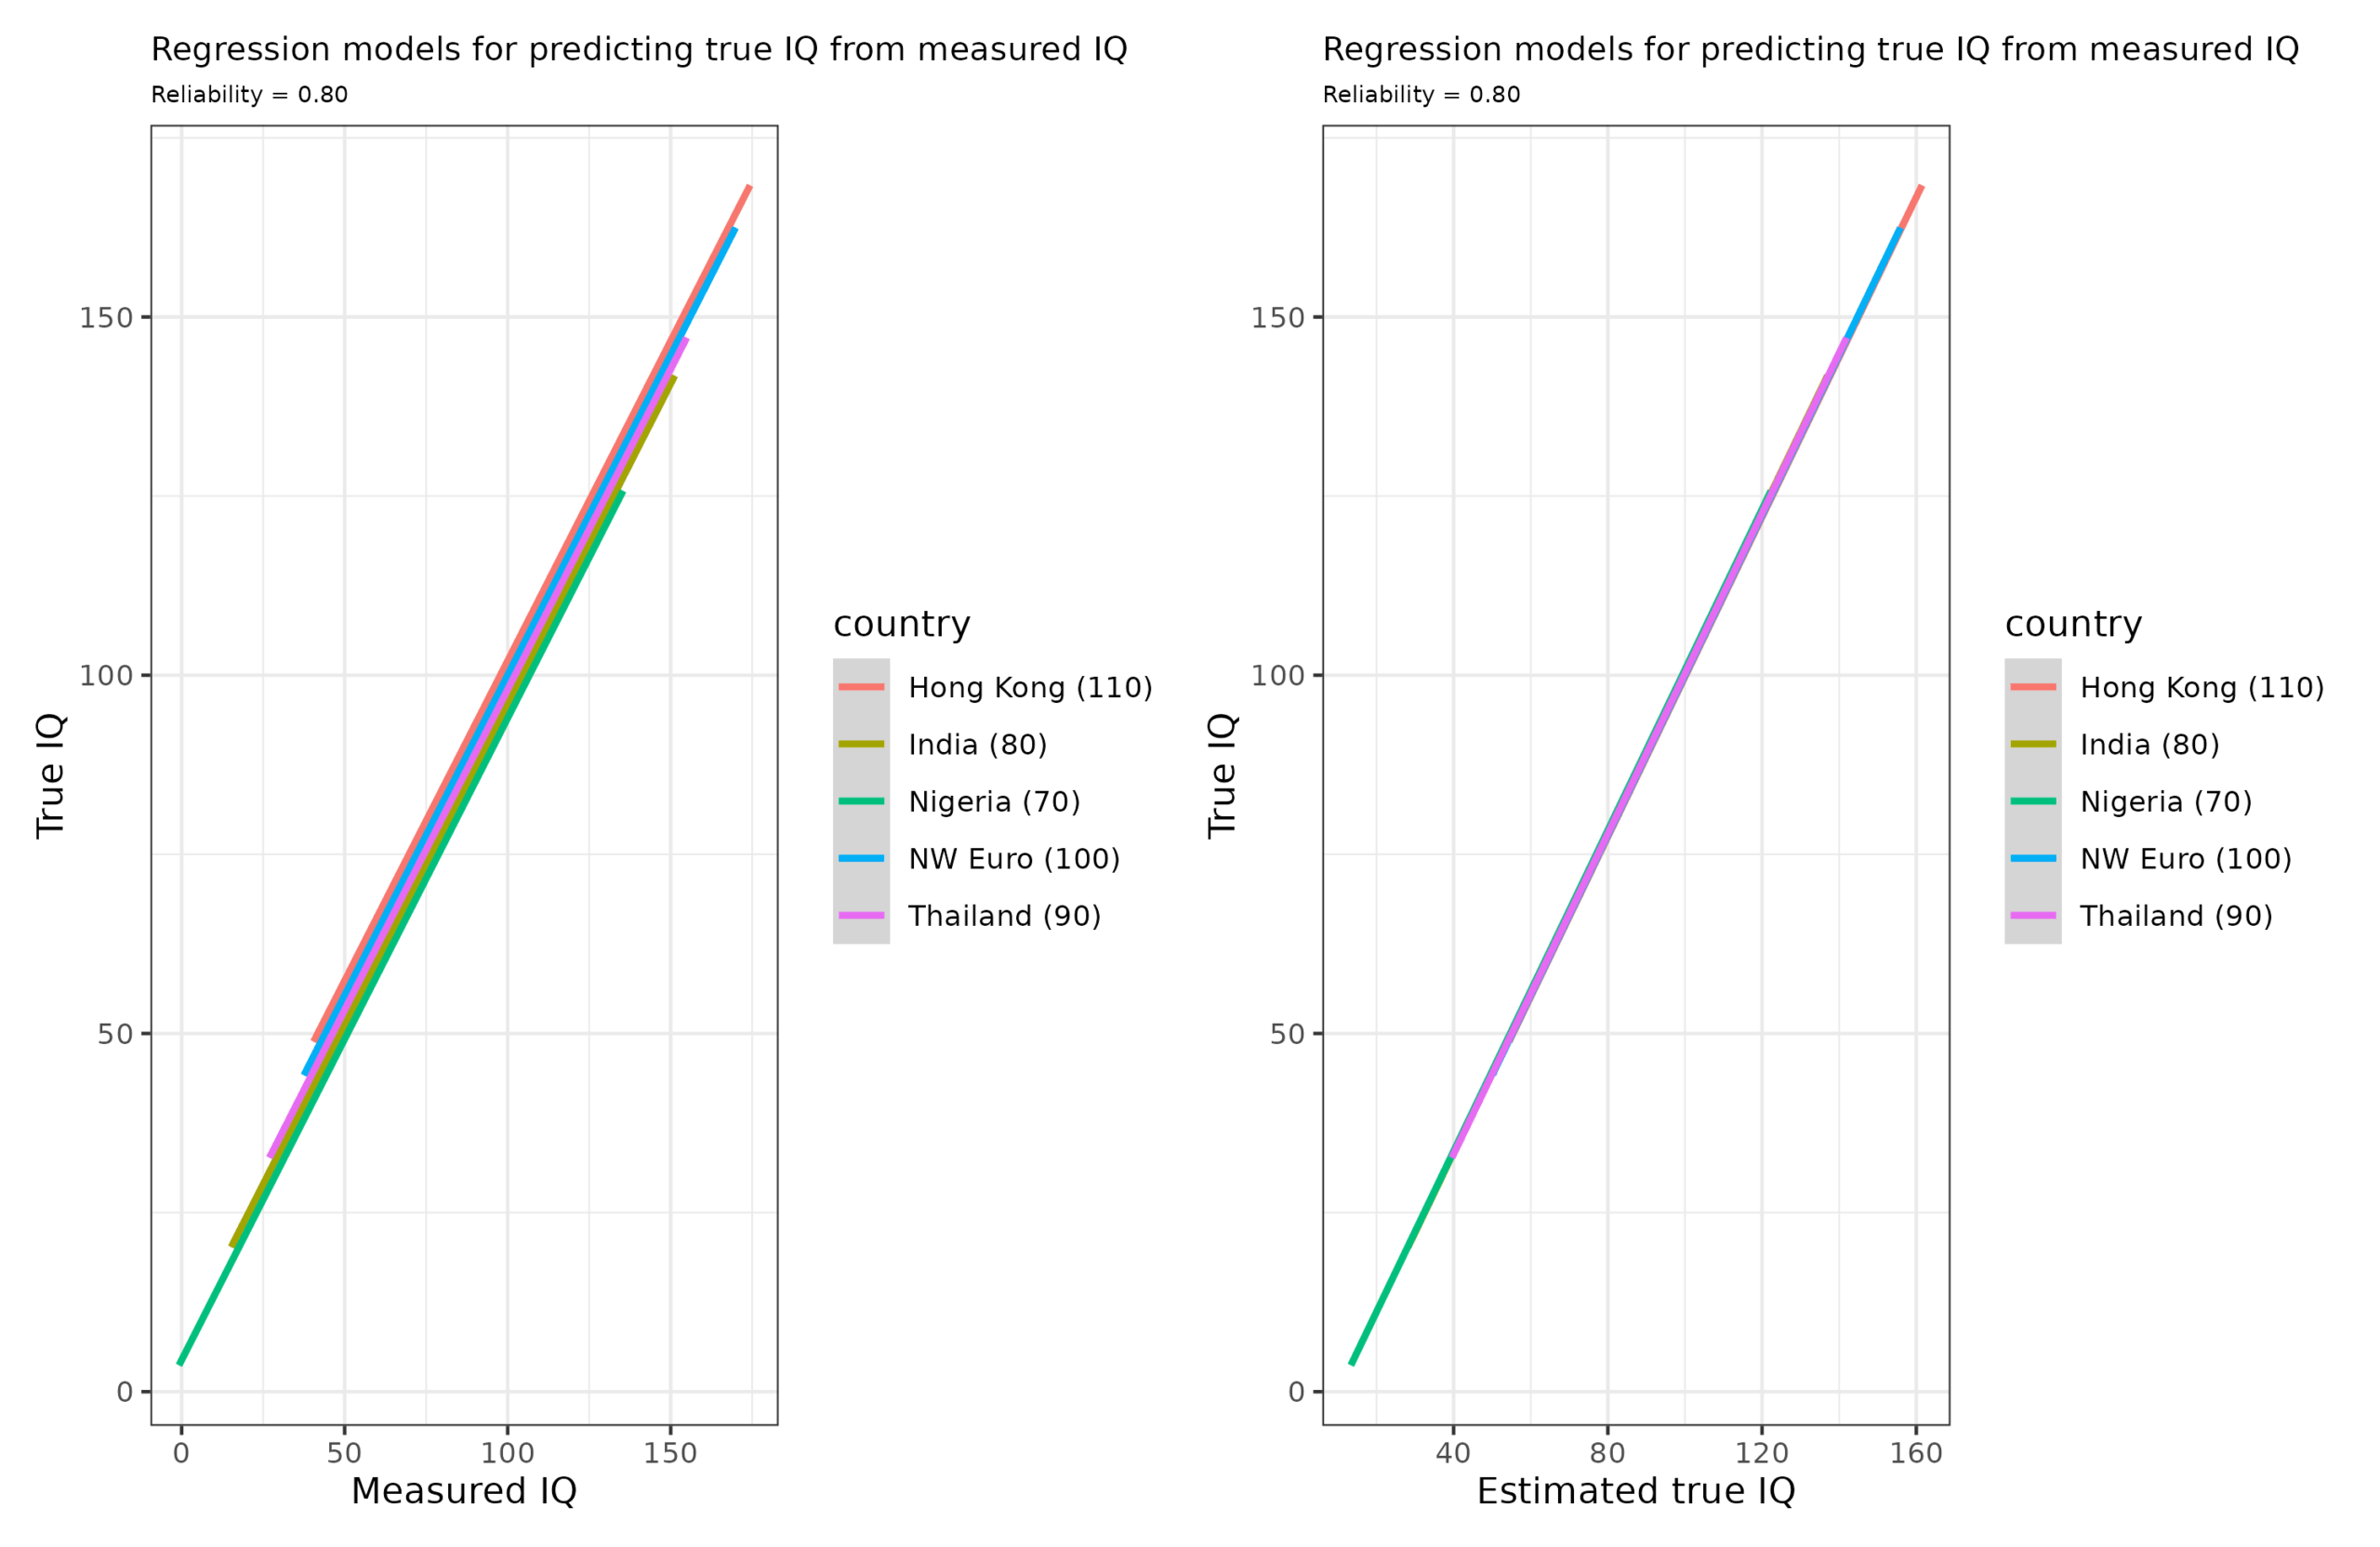
The models on the left show the naive approach used the scores we measured, and the one on the right uses the estimated (penalized) true scores. We see that the naive models have a bit of intercept bias (intercepts vary, slopes identical), whereas the models on the right are unbiased (identical intercepts and slopes). Thus, one can use the estimated true scores to improve the selection method.
We can in fact calculate the values needed to be added to the selection depending on measured and group IQ to get a sense of the amount of correction needed for different cases:
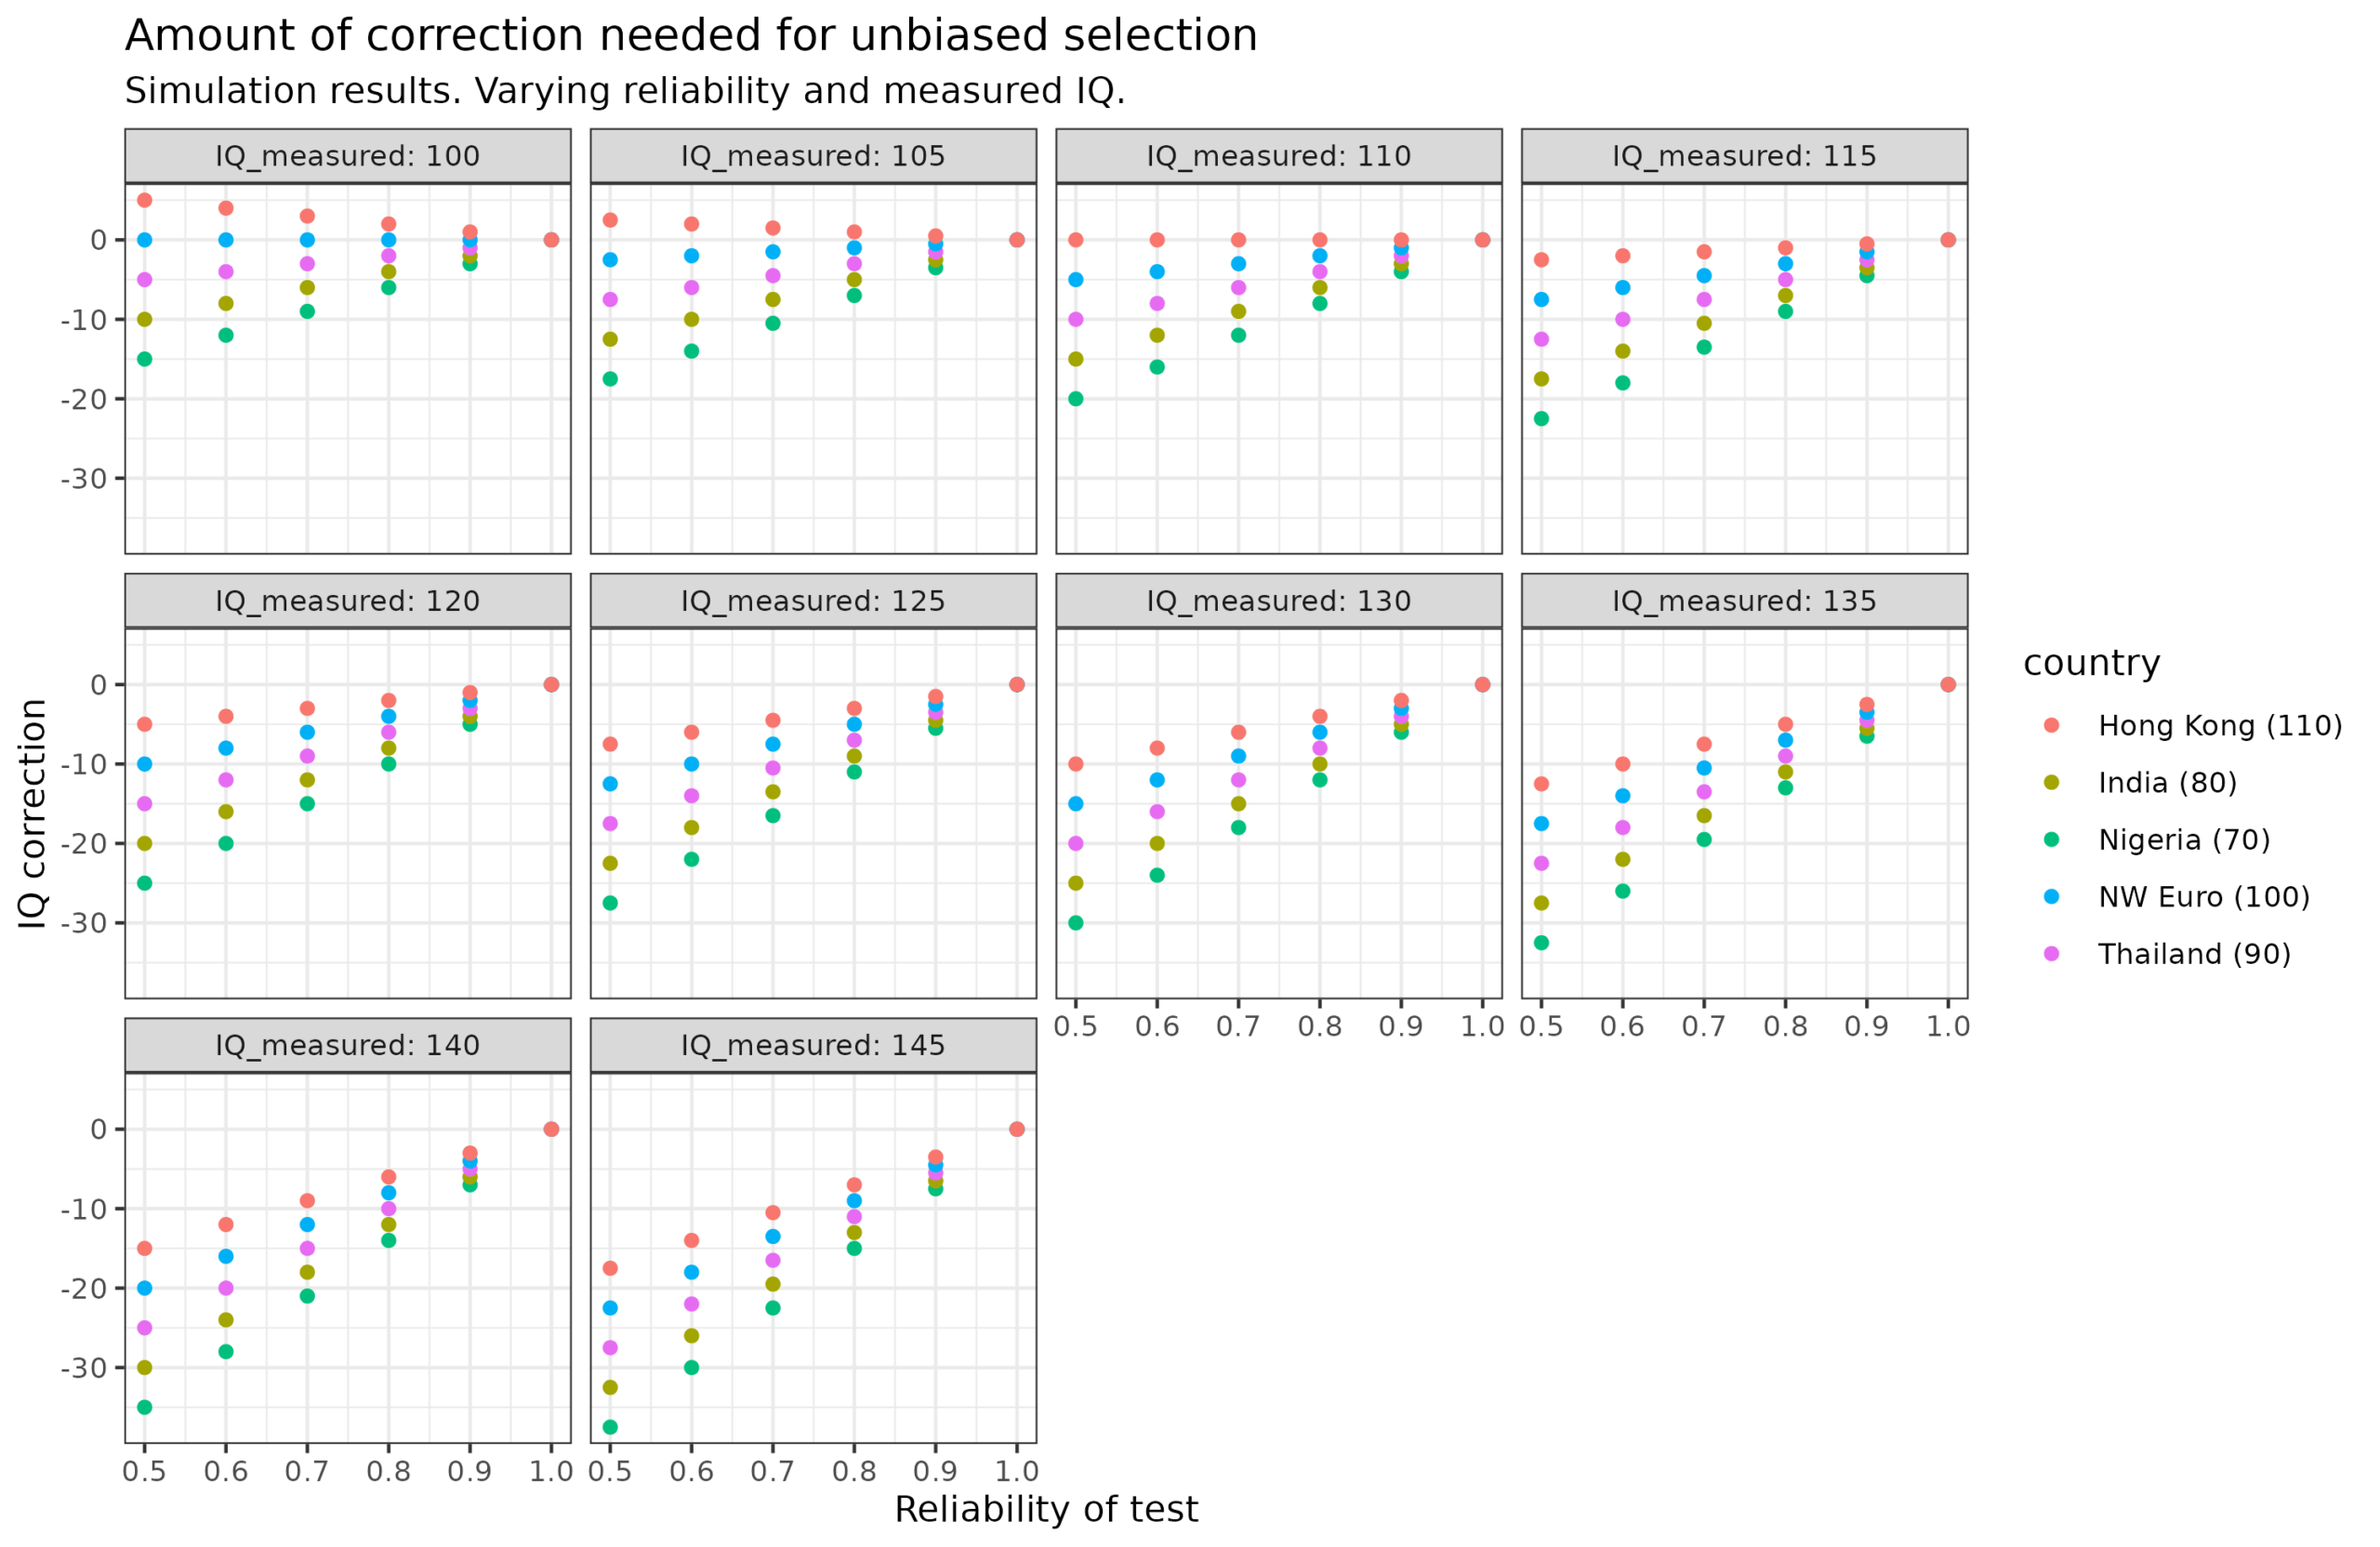
The somewhat complex plot shows us which value we have to add from the measured IQ to adjust for the unreliability and differences in group IQs. In other words, the amount of regression towards the mean to apply. Thus, we see that if the group IQ mean is actually above the measured value, we must add a bit: top left plot for Hong Kong, if we have reliability = 0.5 (poor), and see 100 IQ, we should add 5 to get a best estimate of 105 IQ. In the case of extreme cases where we see 145 IQ with a standard 0.80 reliability test, we need to subtract 7 IQ if the person is from Hong Kong but 15 IQ if they are from Nigeria. Doing so in both cases will result in unbiased estimates of these bright people of 130 and 138 IQ.
Given practical realities amount the validity of whatever measure of human capital is used (e.g. university degree, ranking of university, employment history), thus, rather large corrections or penalties are sometimes necessary for people coming from poorly performing groups. If threshold selection is used, their performance will still not be on average the same, however, it will be much closer. One can choose suitable thresholds by origin country to ensure that immigration groups do not underperform the natives, and thus are not economic liabilities in the long run.
The simple solution is to limit legal immigration to those who secure jobs prior to entry. Let the marketplace decide.
R code for those curious. https://rpubs.com/EmilOWK/immigration_selection_priors