
Misleading plots on secular trends and education

This mistake is very common, and here we look at an arbitrary example I was sent promoted by Rob Henderson on Twitter. This error is quite common (first example I found), so this was not chosen to say Rob is particularly bad at this. The same error can often be found in discussion of The Bell Curve with assortative mating. One can note that double college couples have markedly increased, suggesting increased assortative mating for education, but this is an effect of the increased college rates (especially for women), not of increased assortment, which seems to be near constant. That aside, let's return to the new example:


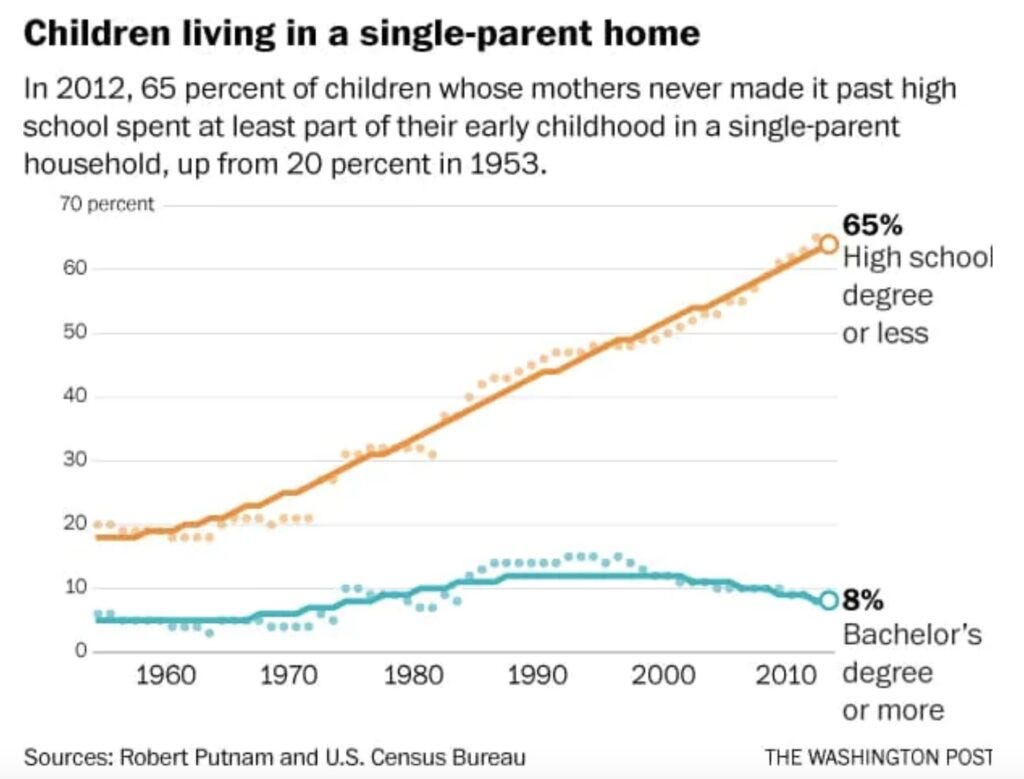
Sorry bad quality, I couldn't find the original article on Washington Post. It ends in 2012, so probably from 2014ish, but it's not this one.
So the desired interpretation here is to show that among mothers with low education, the proportion of single-parenthood has skyrocketed. The problem here is that the meaning in psychological terms of "high school or less" is not constant. That's because the distribution of education changes over time. This plot therefore cannot show what they purport to show. A simple way to show this is using the GSS, a public dataset of Americans. Audacious Epigone already made this point in 2019 of sorts (Average IQ of College Undergrads and Graduate Degree Holders by Decade), but here we will redo it a bit better.
Download the GSS data, complete cross-sectional database. Load it into R. After doing some recoding, we are ready to model the data. Let's look at the distribution of degrees by white males aged 35-60, all born in the USA.
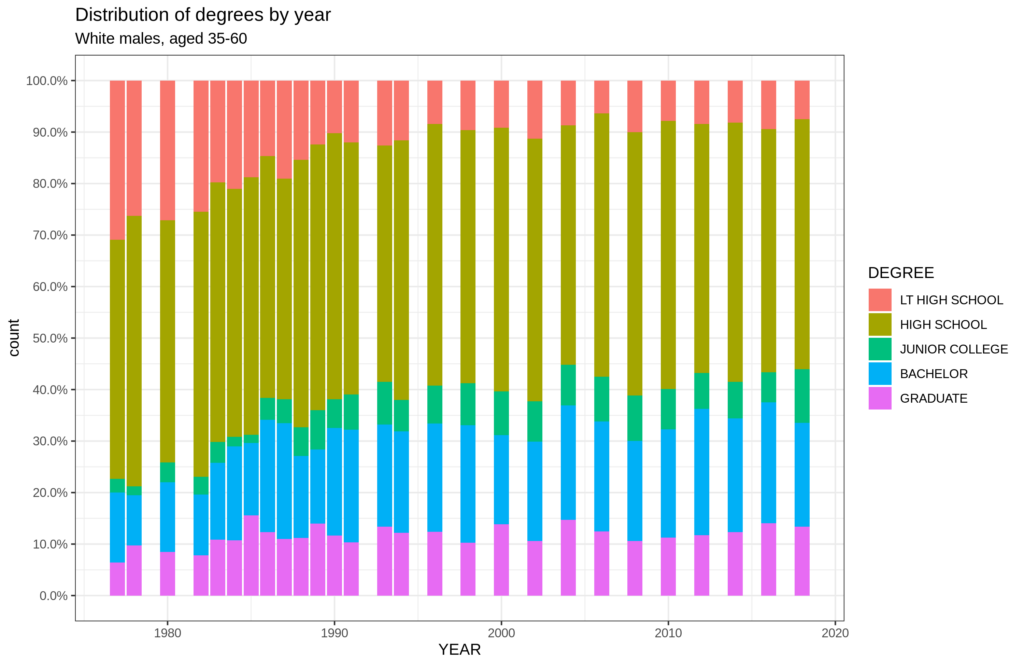
Why this group? Well, previously, women weren’t pursuing as much education, and we can avoid this effect by looking only at men. The age section is chosen to look only at people who probably have completed their formal education. With that in mind, we see that less than (LT in the plot) high school used to be about 30% of men, high school another 50% or so (summing to 80%). Now it's closer to 55%. The value may seem low but that's because we include people up to age 60 recall. Let's look now at the chief human capital measure available, Wordsum score (see this post for Wordsum details):

The model used is this: WORDSUM ~ AGE + SEX + rcs(YEAR) * DEGREE (In R formula syntax). Thus, we include the interaction of year and degree to open to the possibility that some degrees declined more. The rcs() is a cubic spline, we use this to allow the possibility of nonlinear effects across the years. Thus, we have a nonlinear interaction, but that's alright since our sample size is a whopping 21.4k. Model fit is reasonable R2 = 24%.
The reason all the lines decline is that all degrees are increasing in prevalence. Thus, the selection threshold to reach the next degree is decreasing for each of them, which causes lower mean human capital levels inside every degree group (including the bottom, since it is getting depopulated). The overall mean is not actually declining, that's a Simpson's paradox/fallacy. In these data, because we standardized the values within each year of testing, the mean across years is exactly the same i.e., 0. With that in mind, we see that high school graduates (but not higher) used to be about average intelligence in 1970s (z score is about 0), but now it's somewhat below average at -0.35 or so. Less than high school is now considerably below average at about -1.30, whereas it used to be about -0.75.
Thus, to go back to their plot, we cannot just consider women with high school or less as the same talented group over time. This group has become markedly lower in human capital traits, including intelligence but also other factors like impulsivity, over time due to the increase in formal education. Ideally now, we would re-do the original plot to see if this matters in this case, but that exercise is left to the reader. I would guess their pattern is still there, just less drastic. If we looked at the e.g. 25th, 50th, and 75th centiles of intelligence over time, what would be the single-parenthood among these? They would all increase, but most increase would be in the bottom 25th I would guess.