
New paper: Psychometric Analysis of the Multifactor General Knowledge Test
With Seb Jensen again

A while ago, Seb Jensen and I did this new study, and it was only released now due to technical issues:
Kirkegaard, E. O. W., & Jensen, S. (2025). Psychometric Analysis of the Multifactor General Knowledge Test. OpenPsych. https://doi.org/10.26775/OP.2025.07.28
Different methods of scoring the multifactor general knowledge test were evaluated to test what the best method of calculating scores is. The best methods of calculating scores were treating every checkbox as an item and adding up all of the scores of the items or creating IRT models of the answers and distractors separately. The test was highly reliable (ω = 0.93), had a low median completion time (571 seconds), and a high ceiling (IQ = 149). One set of items (internet abbreviations) were found to have very low g-loadings, so we recommend removing them. The test also had age, national, and gender differences which replicate previous literature. The test was clearly biased against non-Anglos, especially in the sections of aesthetic knowledge, cultural knowledge, literary knowledge, and technical knowledge. DIF testing could not detect this bias, calling into question its usefulness in identifying highly biased tests. Between sexes, DIF found that many items were biased against both genders, but the magnitude of the bias did not vary by either sex. We recommend scoring this test by adding up all of the distractors and answers, and the use of a cultural and linguistic translation on an international scale.
You may know that there exists this website, https://openpsychometrics.org/, which has a number of personality tests but also a few cognitive tests. I’ve already examined their vocabulary test in a prior study, so this study looks at their Multifactor General Knowledge Test (MFGKT). You can take it in that link and it takes about 10 minutes.
The test uses a rare design: the choose up to 5 out of 10. Here’s an example item:
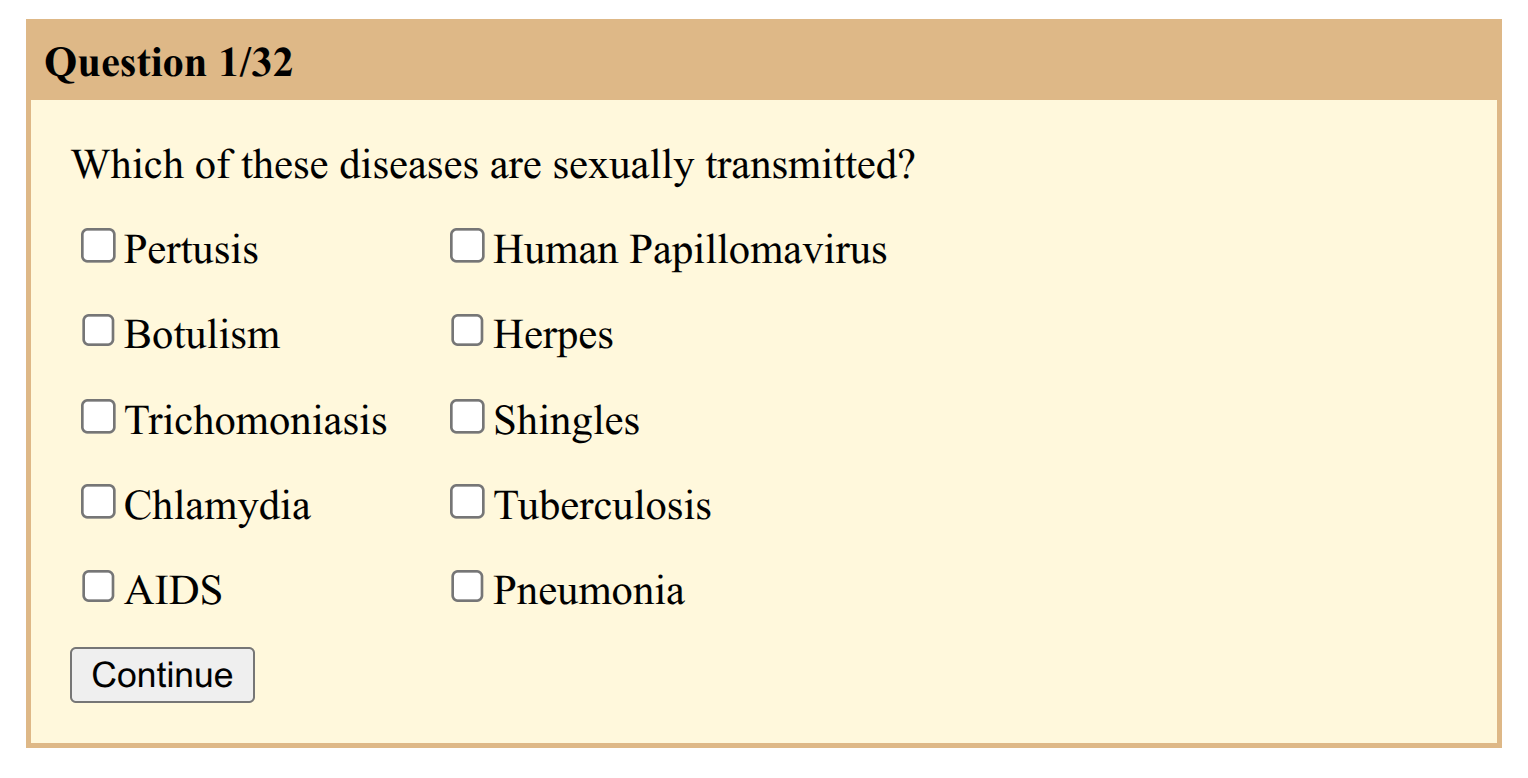
5 of the options for each question are correct and 5 are wrong. Picking a correct option gives 1 point and NOT picking an incorrect one gives 1 (the website uses negative points for the incorrect ones but the scores are equivalent). Your maximum performance is when you pick all the correct options and none of the incorrect ones (10 points). In this case, AIDS (actually HIV), chlamydia, herpes, trichomoniasis, and HPV are correct. There are 32 such questions about different topics, so as to balance out the domains of knowledge reasonably well.
The problem for the analyst is determining the optimal way of scoring such items. First question to ask oneself is whether one is interested only in general knowledge, or also want knowledge scores by domains. If one simply wants general knowledge, the simplest way to score the test is to treat each option as independent and score all of them as 1 point each. This gives a maximum score of 32*10=320 points:
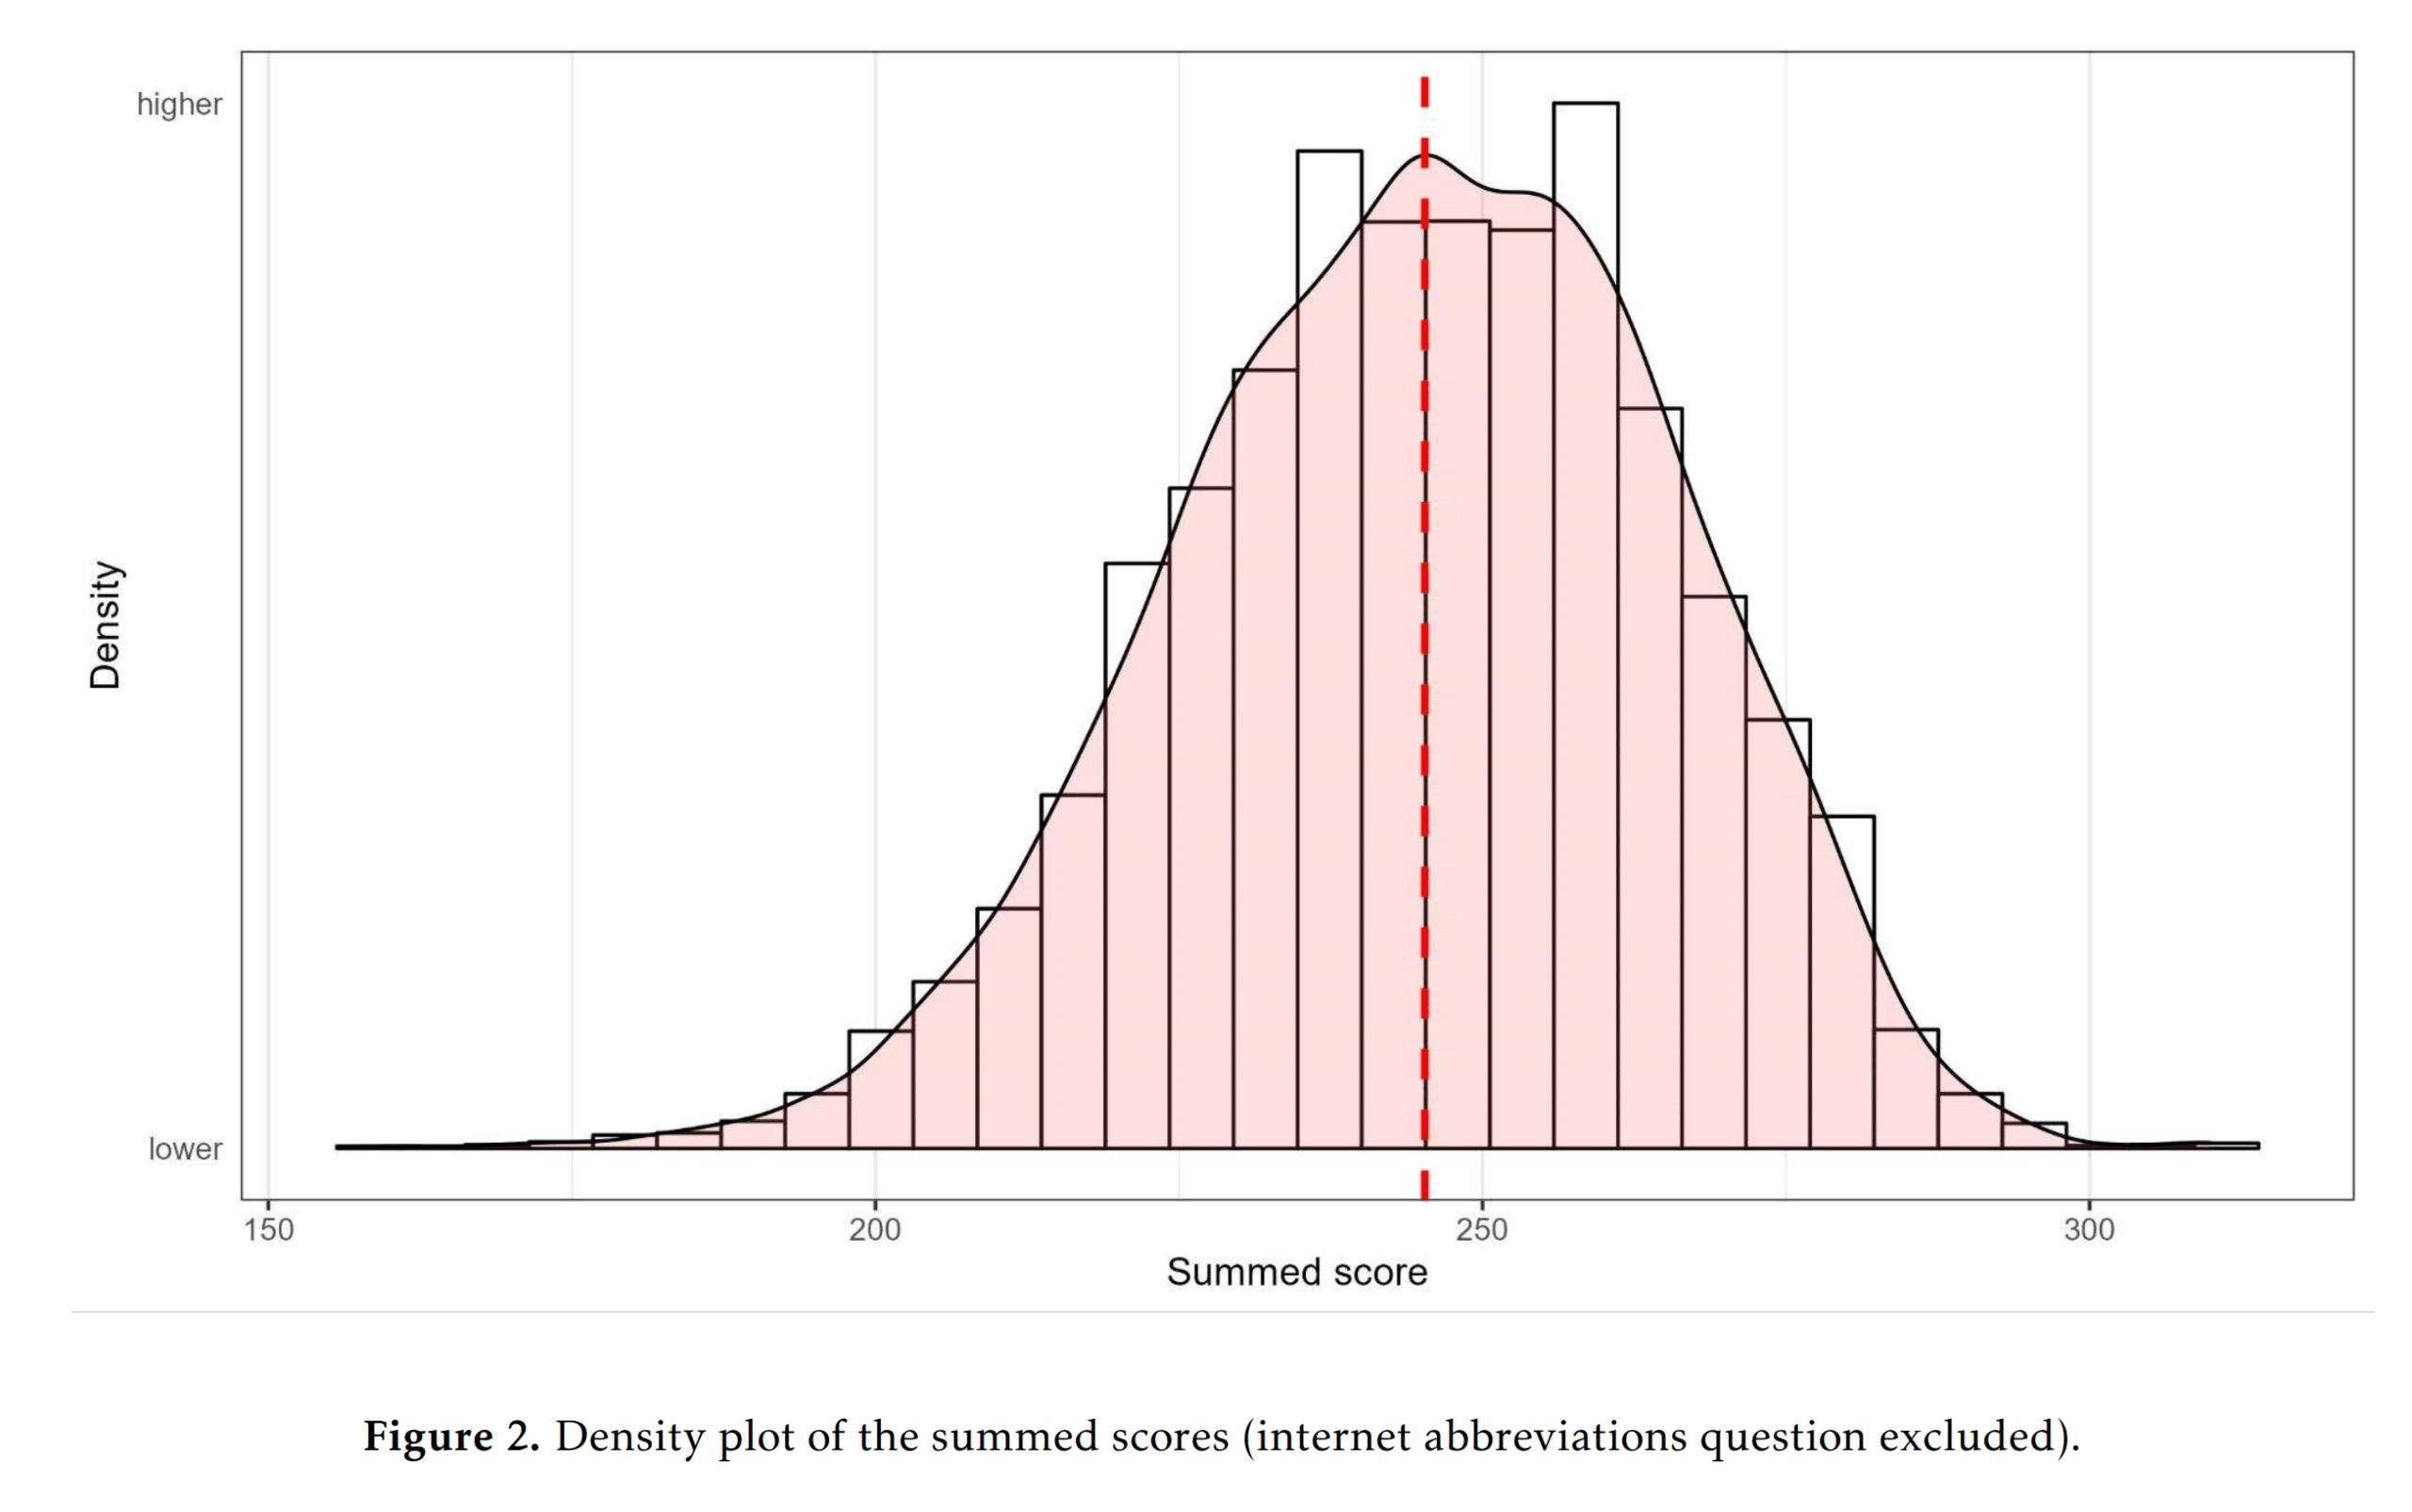
Actually, in this figure the internet abbreviations item was removed because it had very poor g-loadings. I’m sorry nerds, but knowing what ROFL means is not indicative of intelligence much. We can also note that the dataset doesn’t appear to have a lot of cheaters, as very few people got 320 correct.
There are several other more fancy methods that could be used:
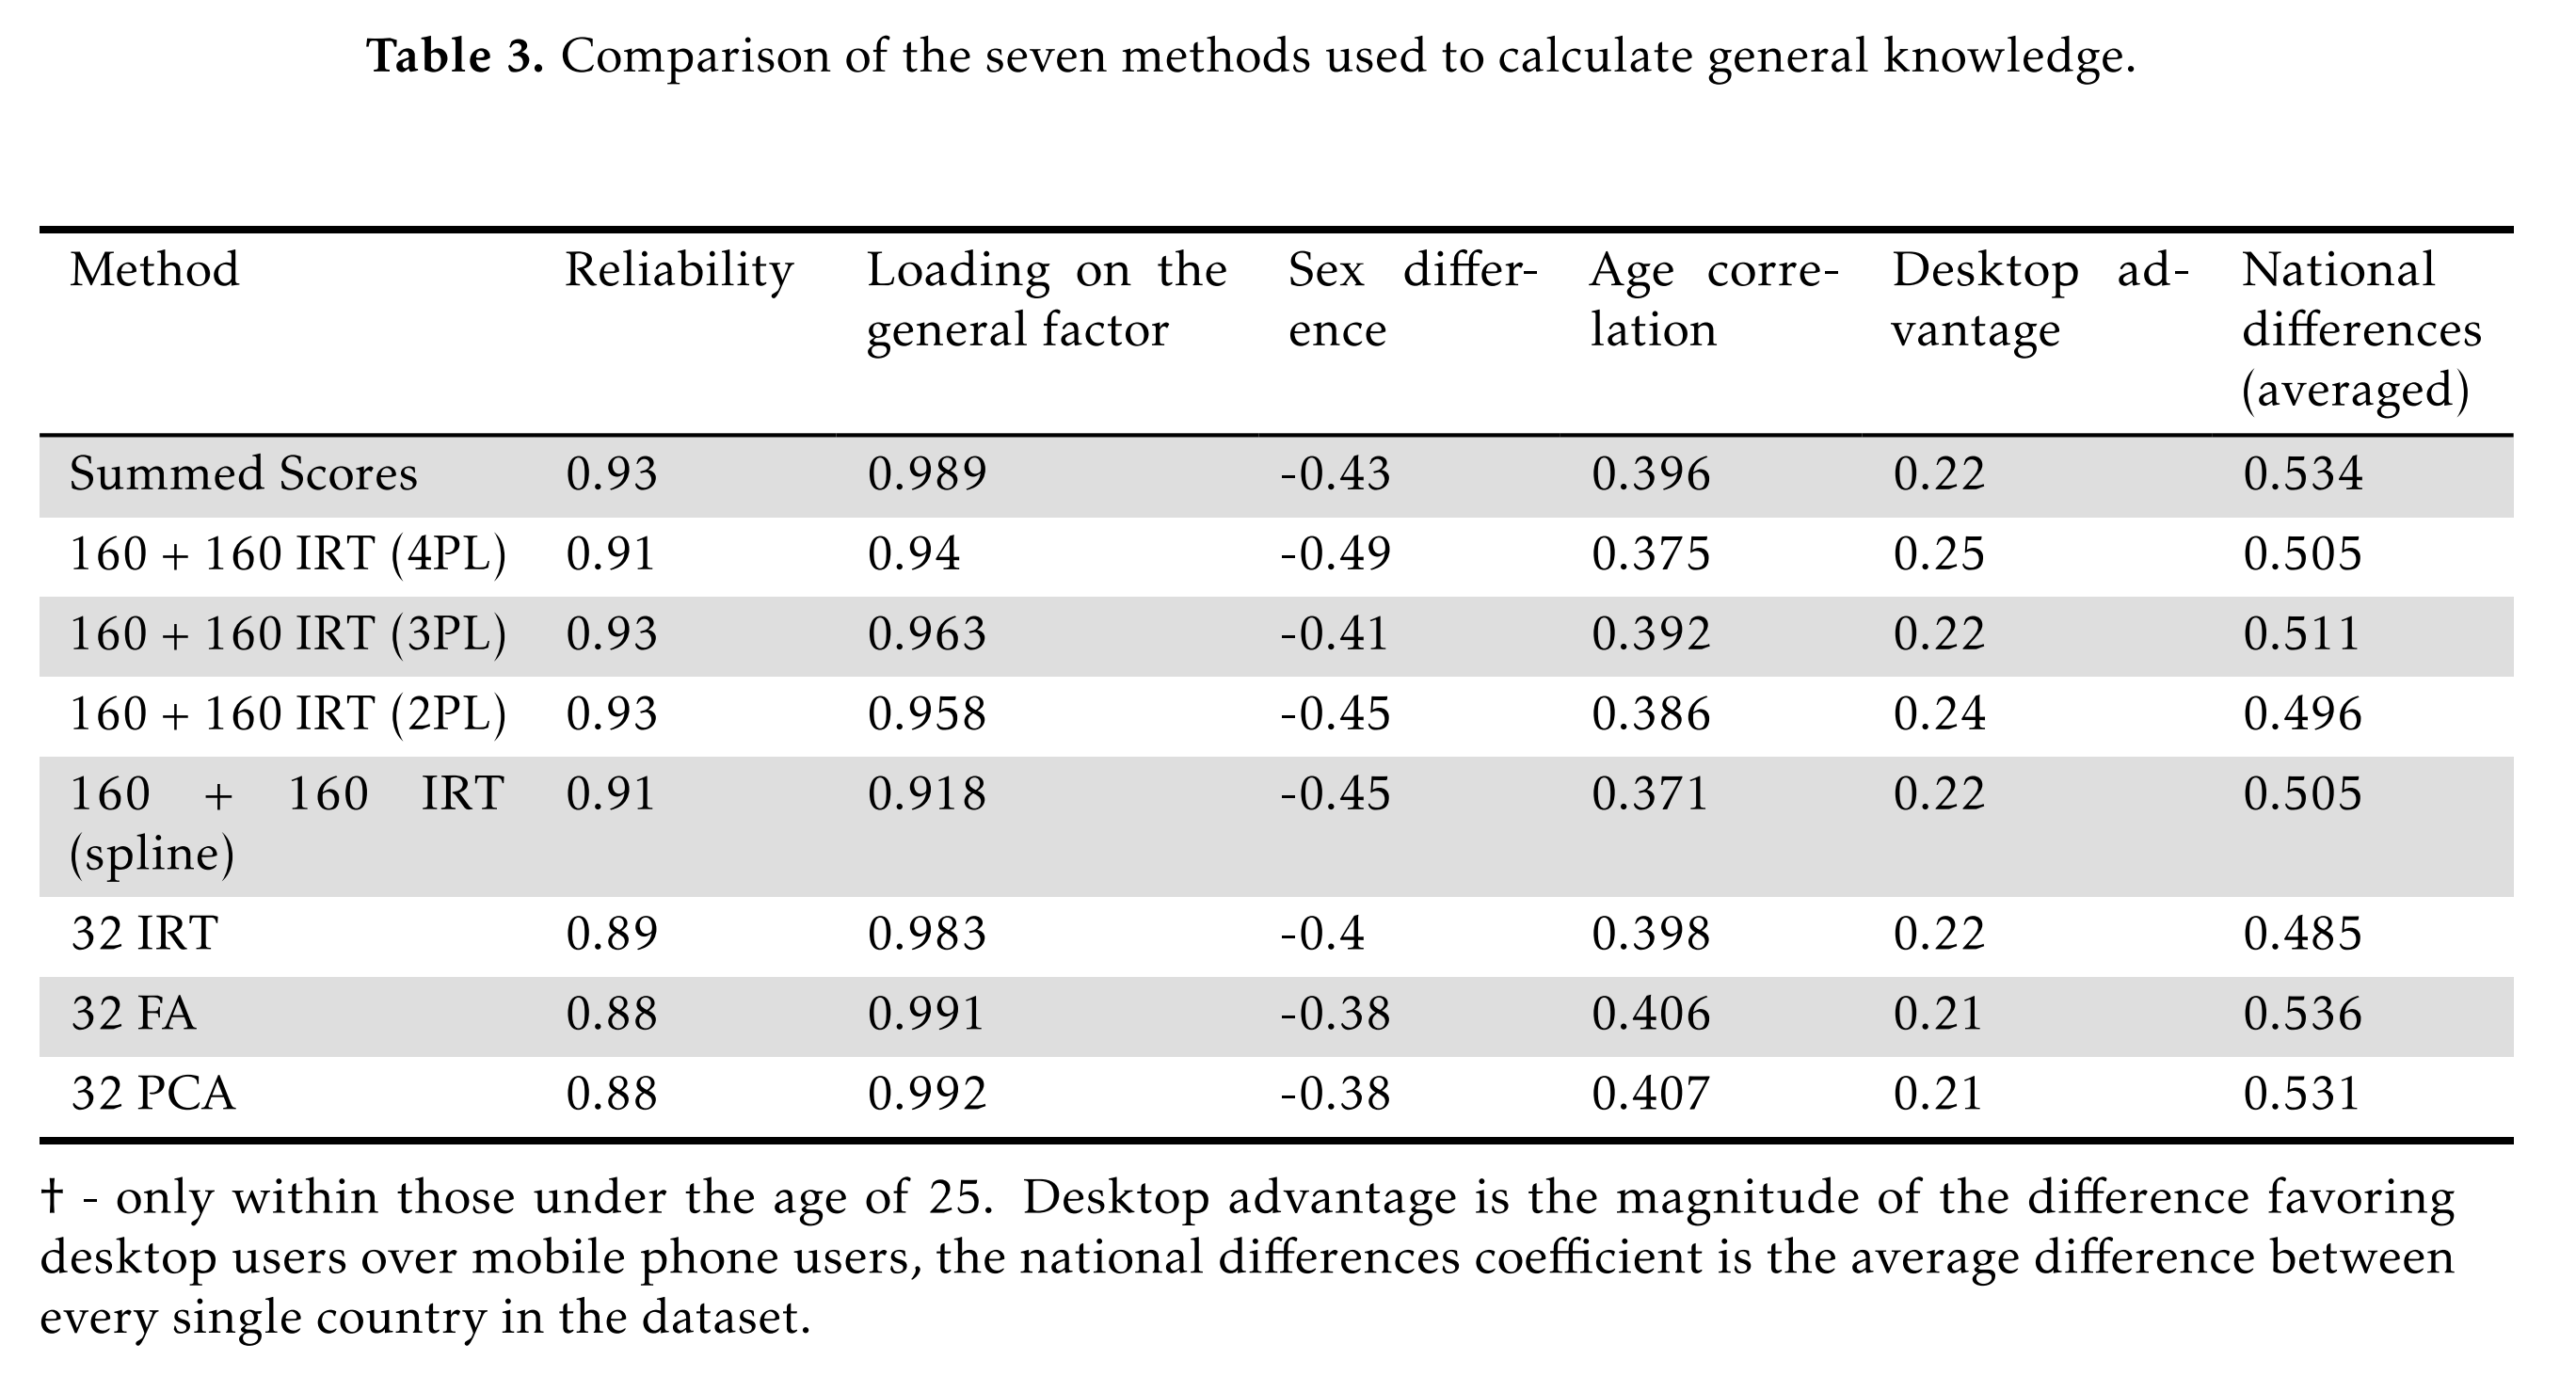
These are:
Summed scores: selected correct options + unselected incorrect options.
IRT models on the sets of correct and incorrect options (4 submethods).
Treating the 32 items as having a 0-10 ordinal scale and using IRT on these.
Ditto, but using FA or PCA instead.
As usual, it turns out that every method produces approximately the same results, so we are left to wonder which method is optimal. We might care about the ease of doing the scoring as well as the strength of correlations with other variables. The dataset (which is public but outdated) provides a few other variables, such as age and sex. Looking across the covariates, it doesn’t appear that one method produces the strongest relationships overall with the variables, and thus we are left with simplicity as our criterion. The test shows 0.38 to 0.49 d male advantage in general knowledge (6-7 IQ). This is also what other studies found. I recently made this image for ease of spreading online on this topic:
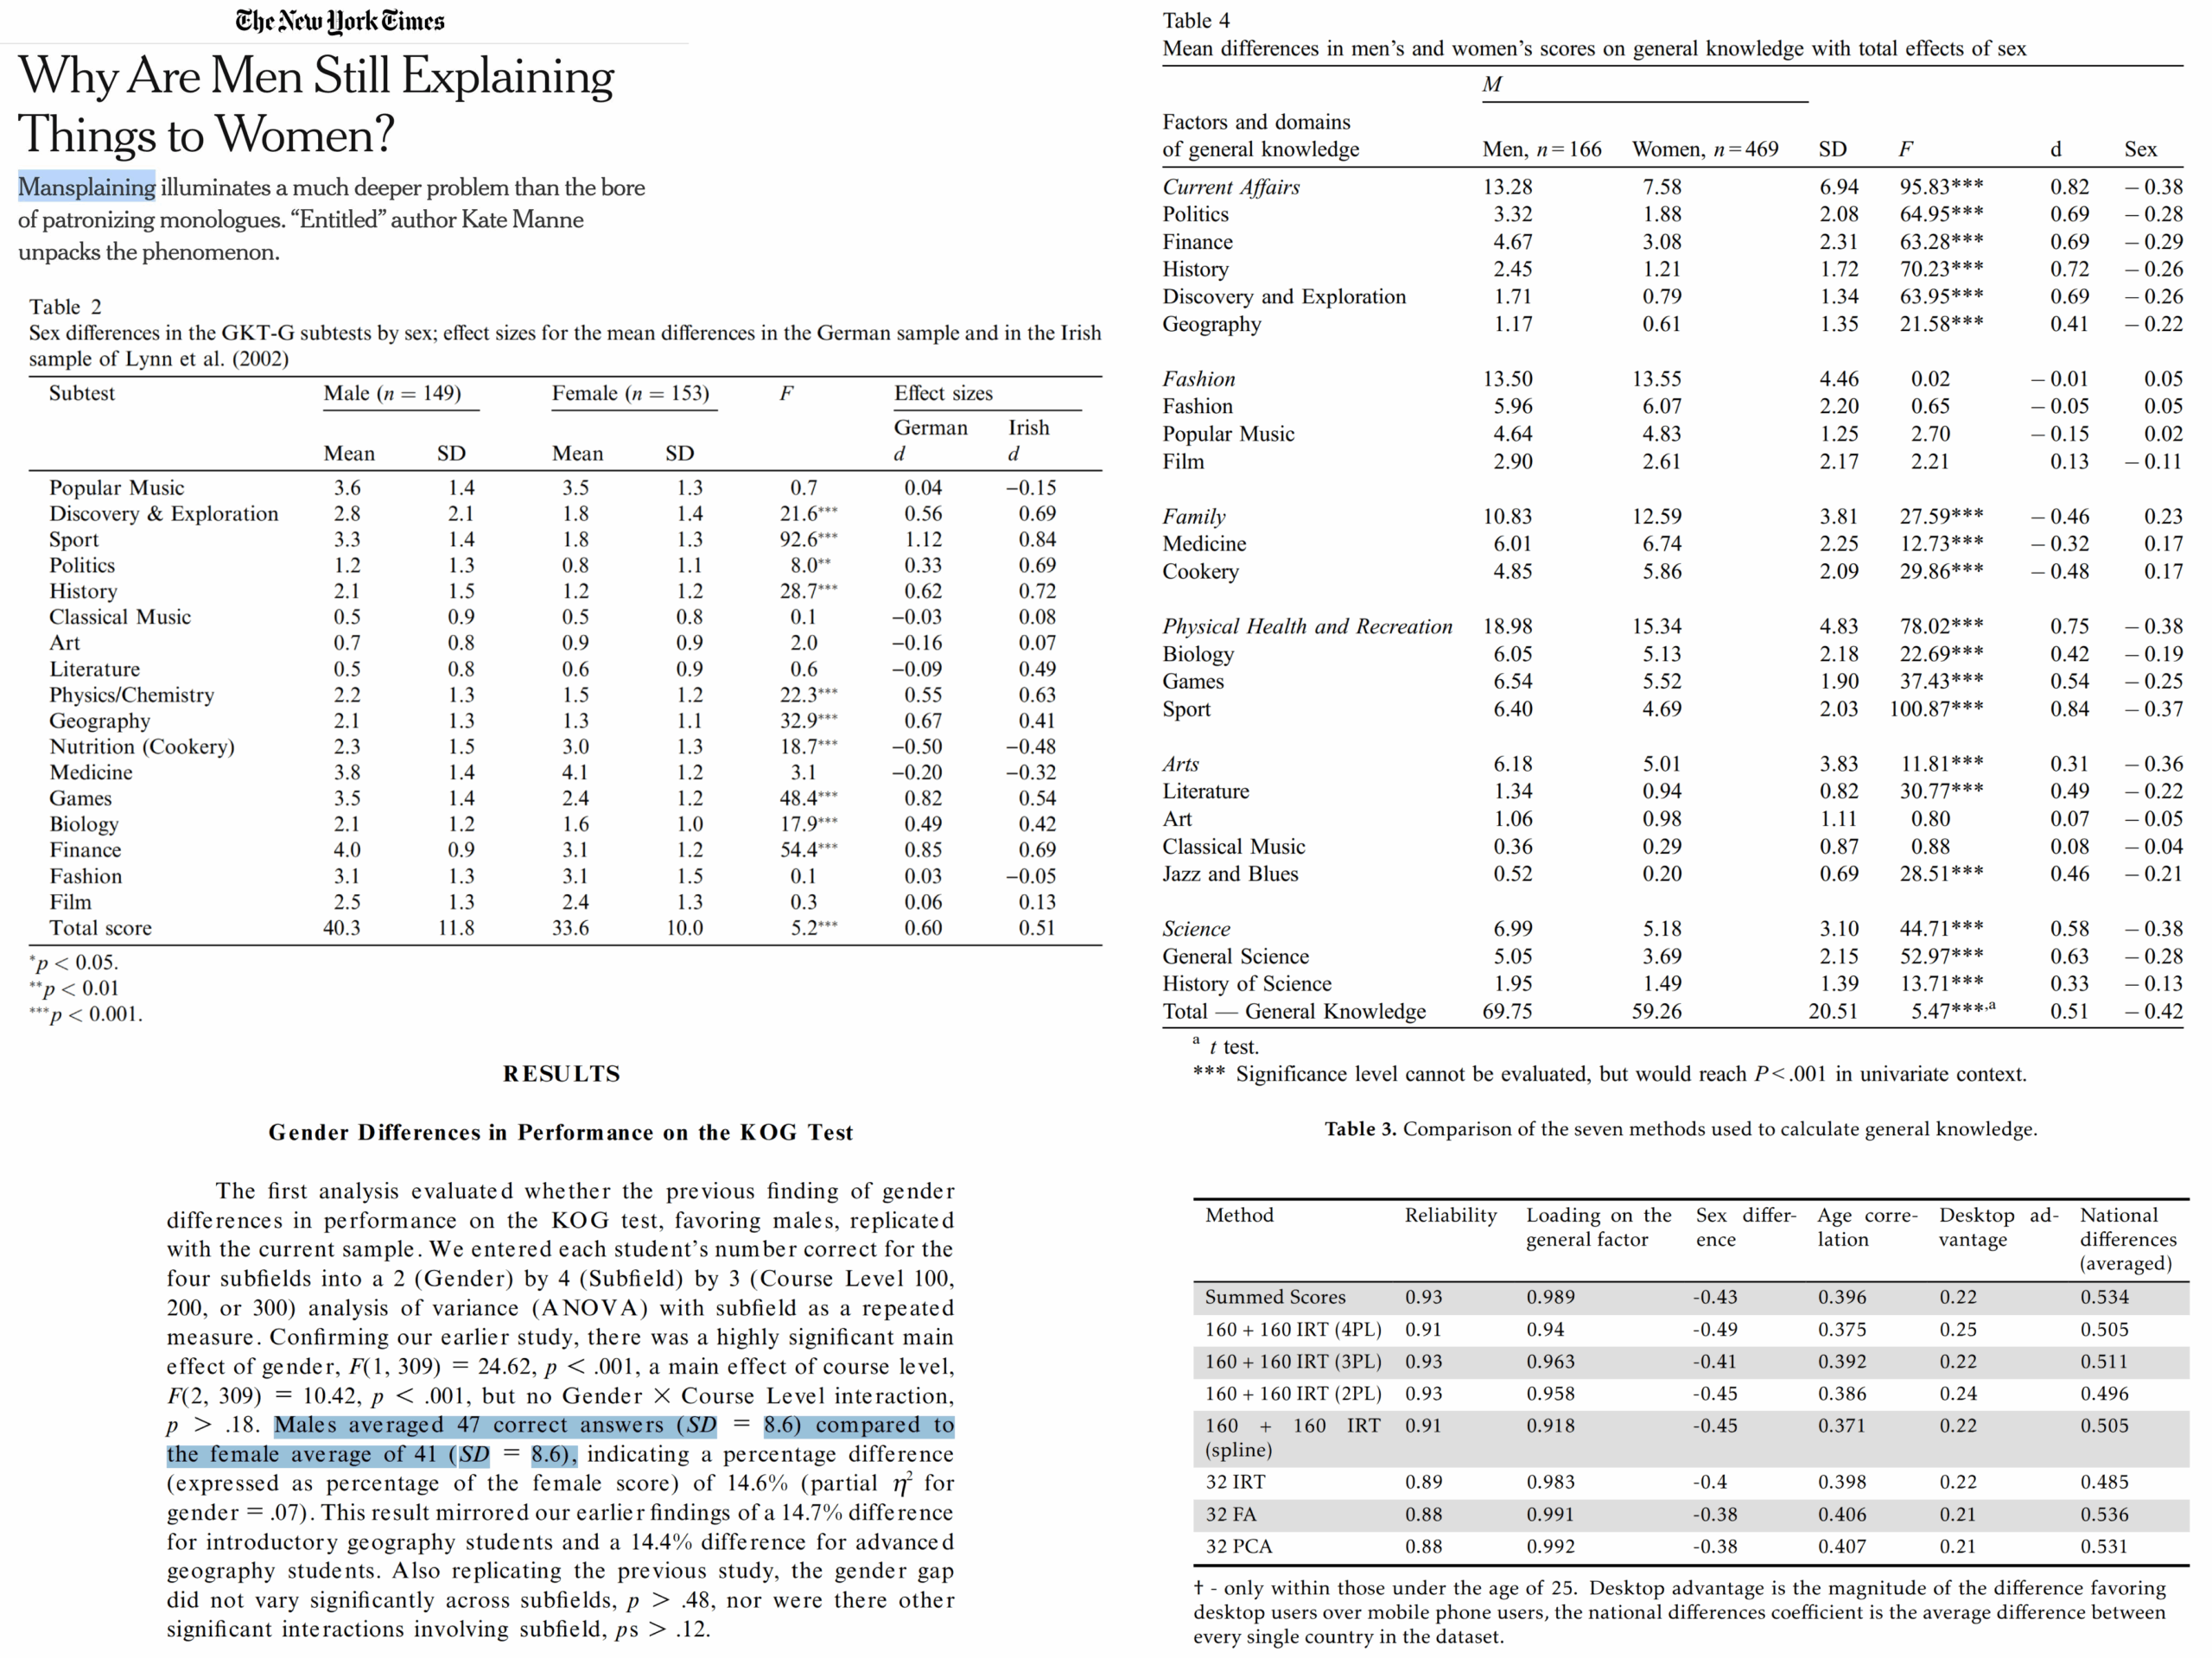
This was intended as a reply to leftist media that complain about ‘mansplaining’ (men explaining how stuff works to women). Well, we know why it makes sense for men to explain stuff to women, which is that men know more than women in general, and especially about certain topics. Given the greater male variance is also in effect (see Inquisitive Bird’s review of findings), the male % of people with very high knowledge levels will be larger still. Here’s the distributions:
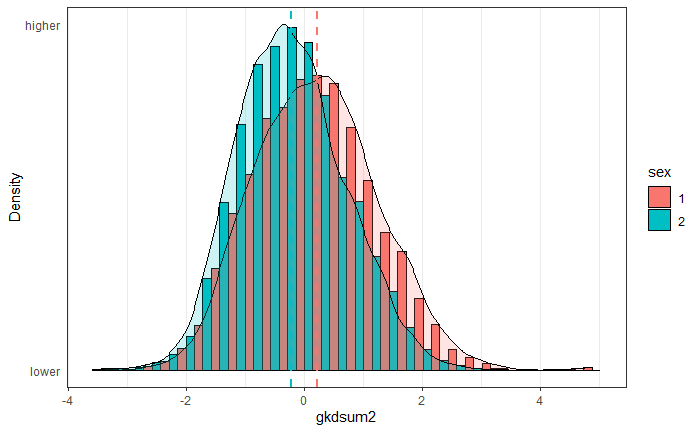
The female distribution is taller, meaning that the standard deviation is smaller. Variance differences are quite sensitive to scoring methods, but every method of scoring the test resulted in greater male variance. The standard deviations were 1.03 and 0.908, thus giving an SD ratio of about 1.13 (p < .001). (I note that there’s a small number of men with ~perfect scores on the far right tail, these may be cheaters.)
Considering that this is a general knowledge test, and some items concern topics of much greater interest to one sex than the other, we may wonder about measurement bias. We used the usual DIF testing approach to find the biased items:
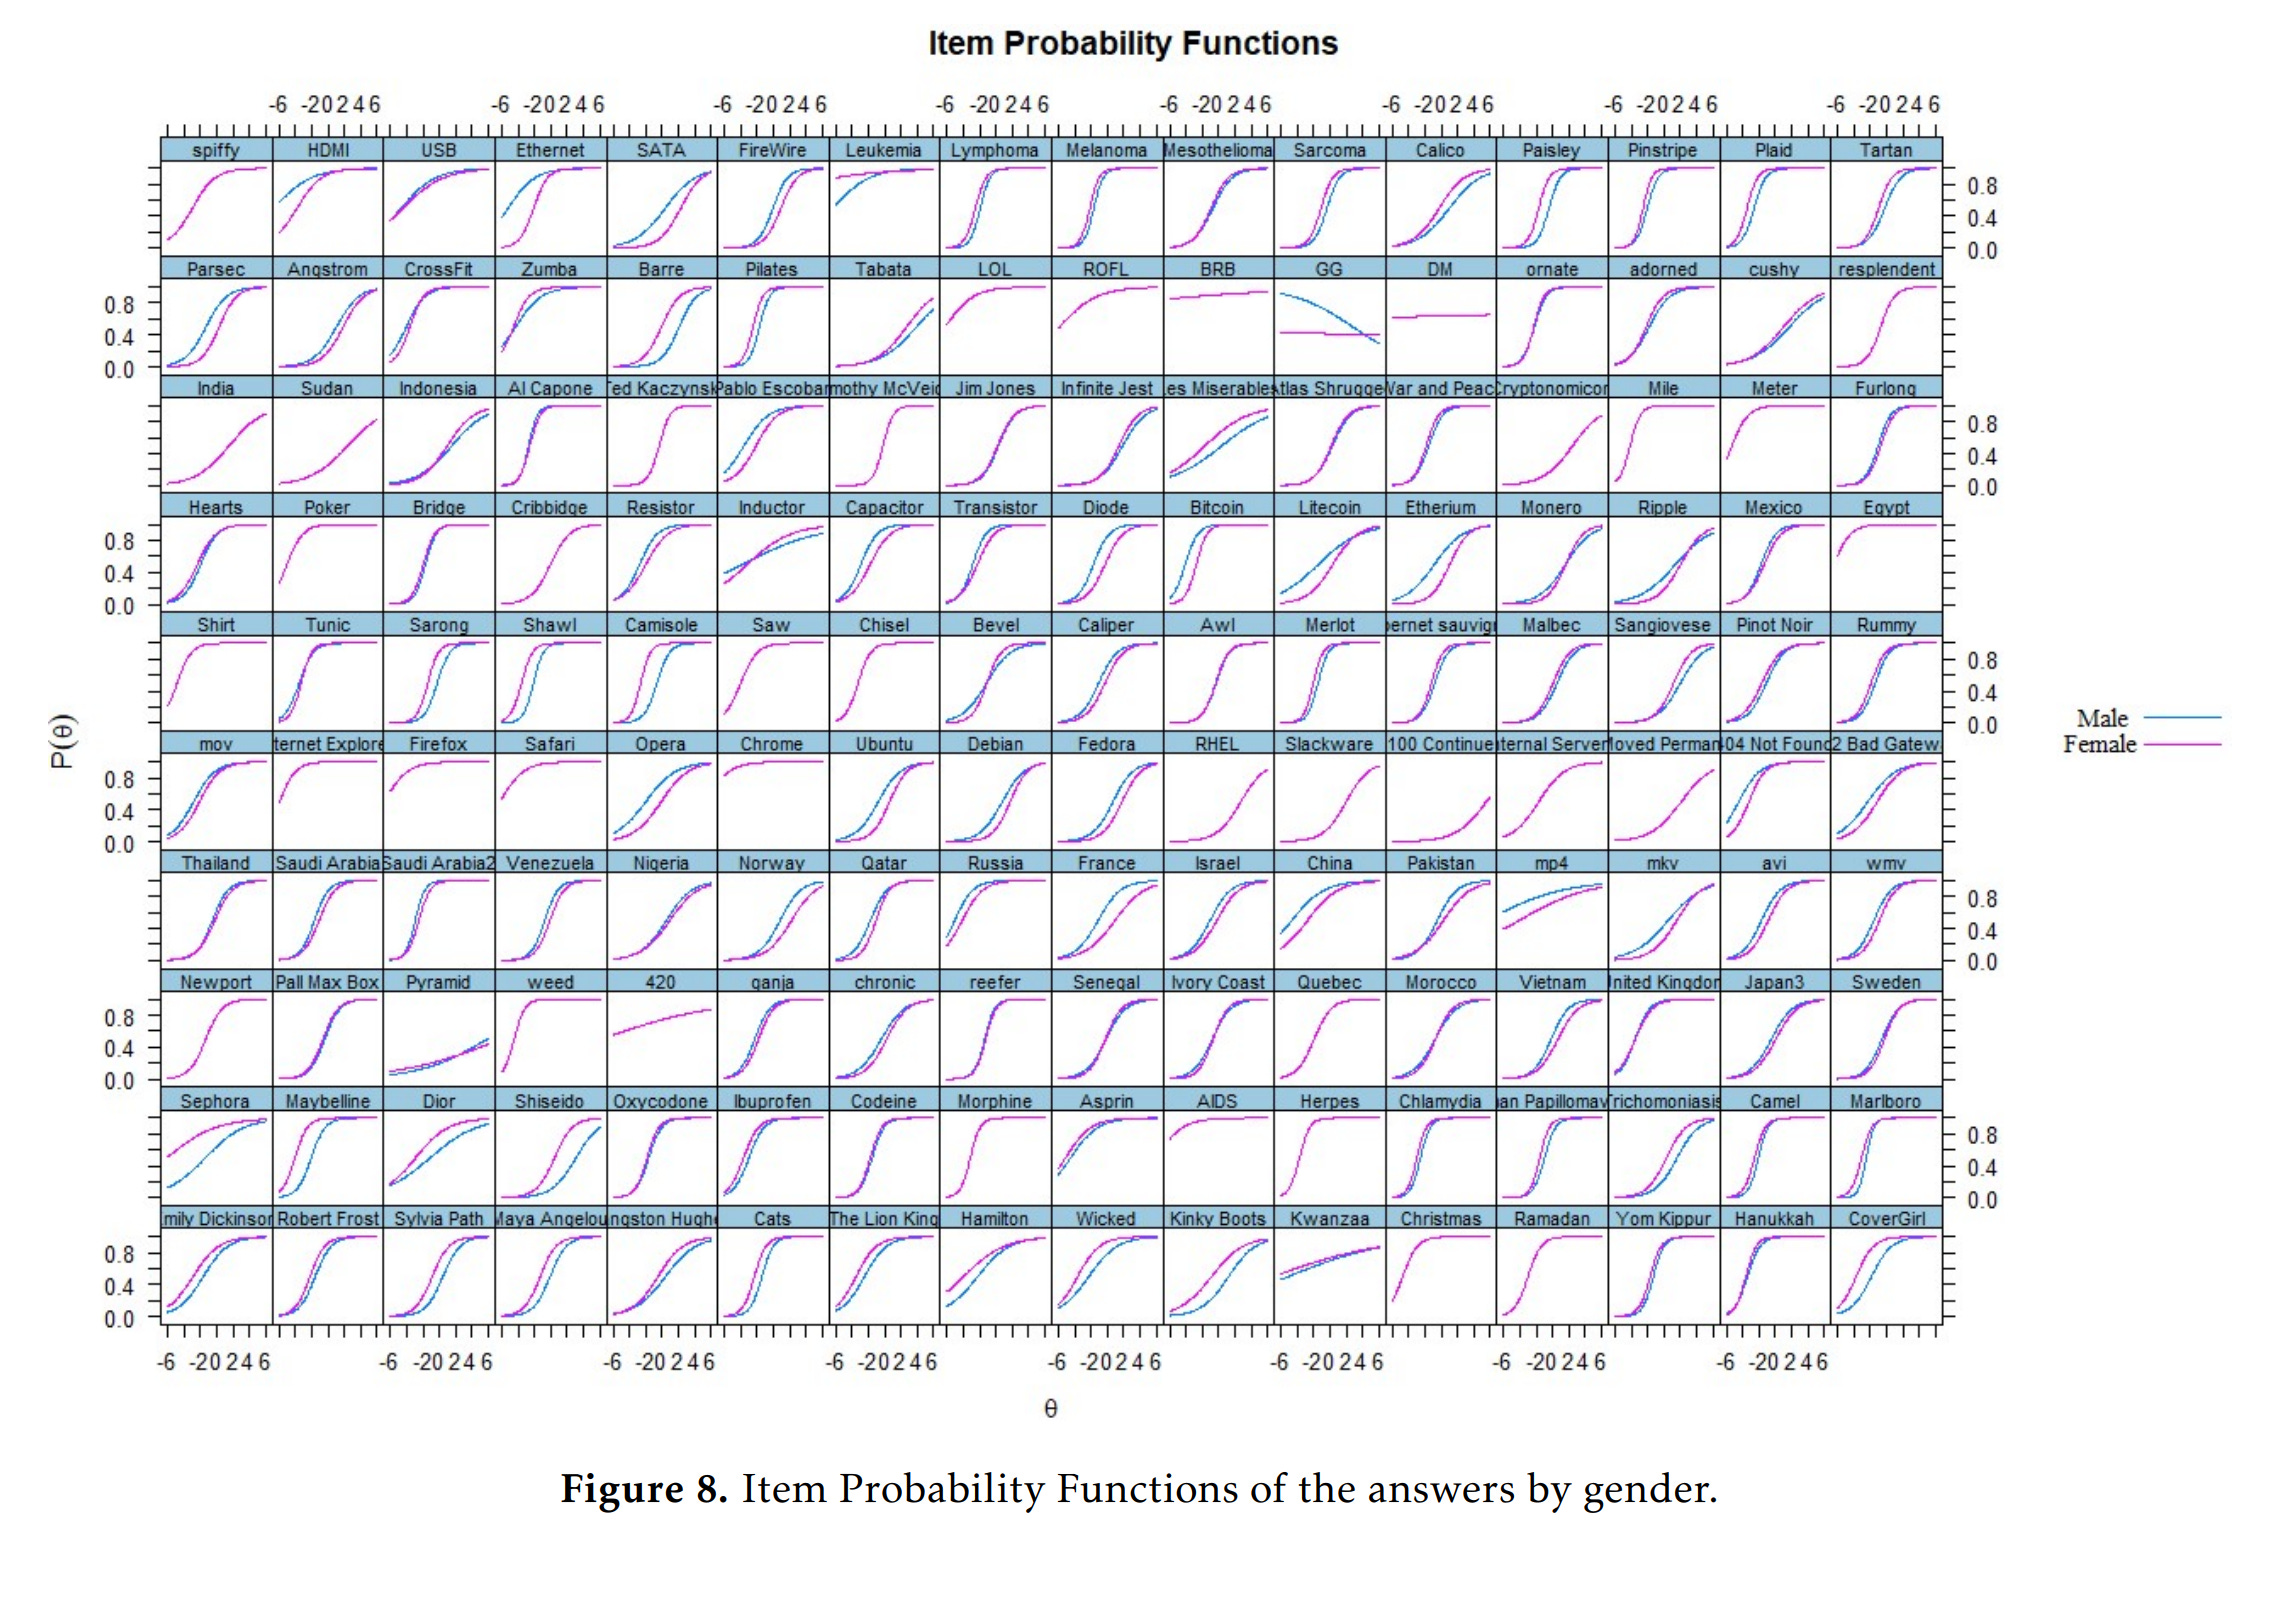
The data is modeled as every item measuring general knowledge and nothing else (1 factor model). Since clearly knowledge is not 1-dimensional, this will get every item flagged for bias insofar as it relates to some specific domain of knowledge on which the sexes differ in interest. Thus, any item with such a sex difference in interest will be flagged and the lines will diverge. If you look for the kinds of items that favor women (purple line above the teal), you see that these usually concern clothing (e.g. Sephora, make-up brands question), or literature (various authors, women read more fiction). Items favoring men concern technical matters such as computers (e.g. Bitcoin), physics (e.g. parsec). A more sensible approach, then, is to compute sex differences by domain of knowledge, as previous studies have done:
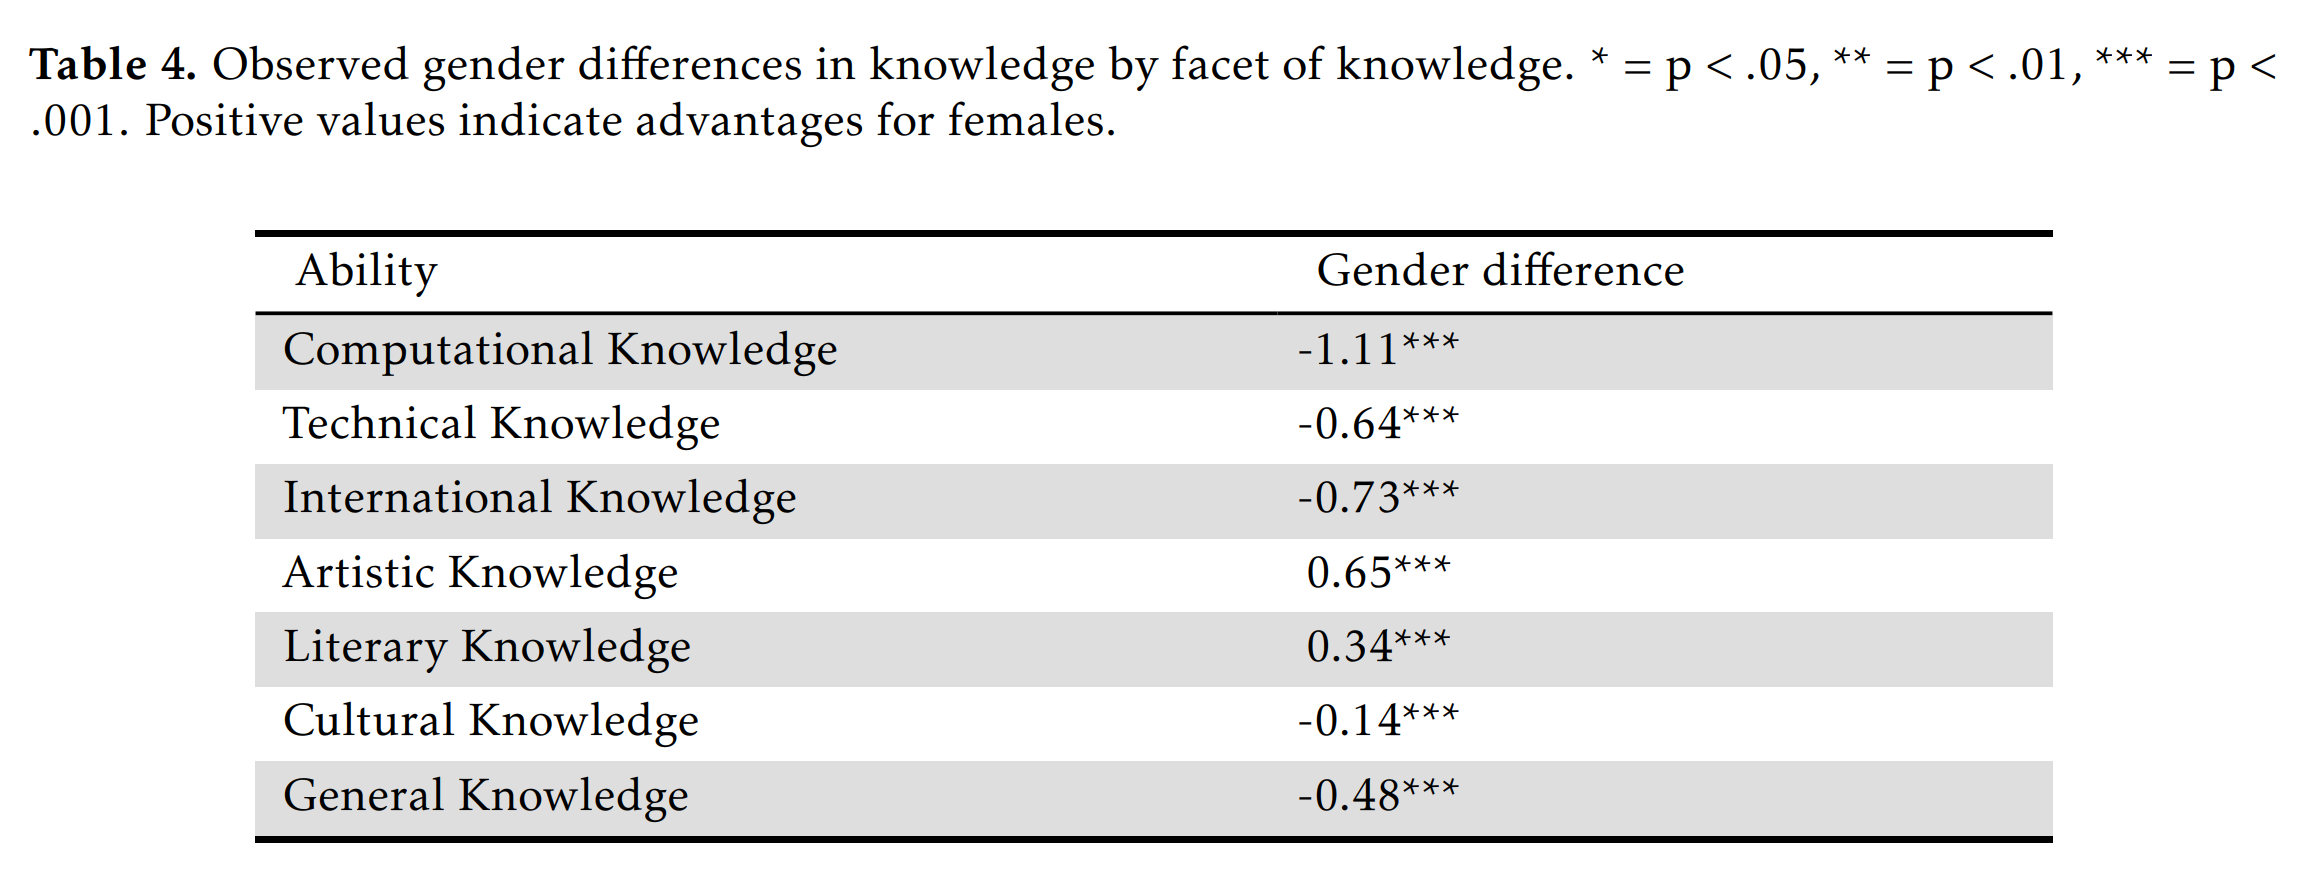
So we just see the same findings but more directly, women know more about art and literature, but less about everything else. The difference is particularly large for computer-related knowledge (1.1 d), surprising no one. The combined effect of the item biases was roughly nothing because there were many items favoring both sexes and their effects canceled out.
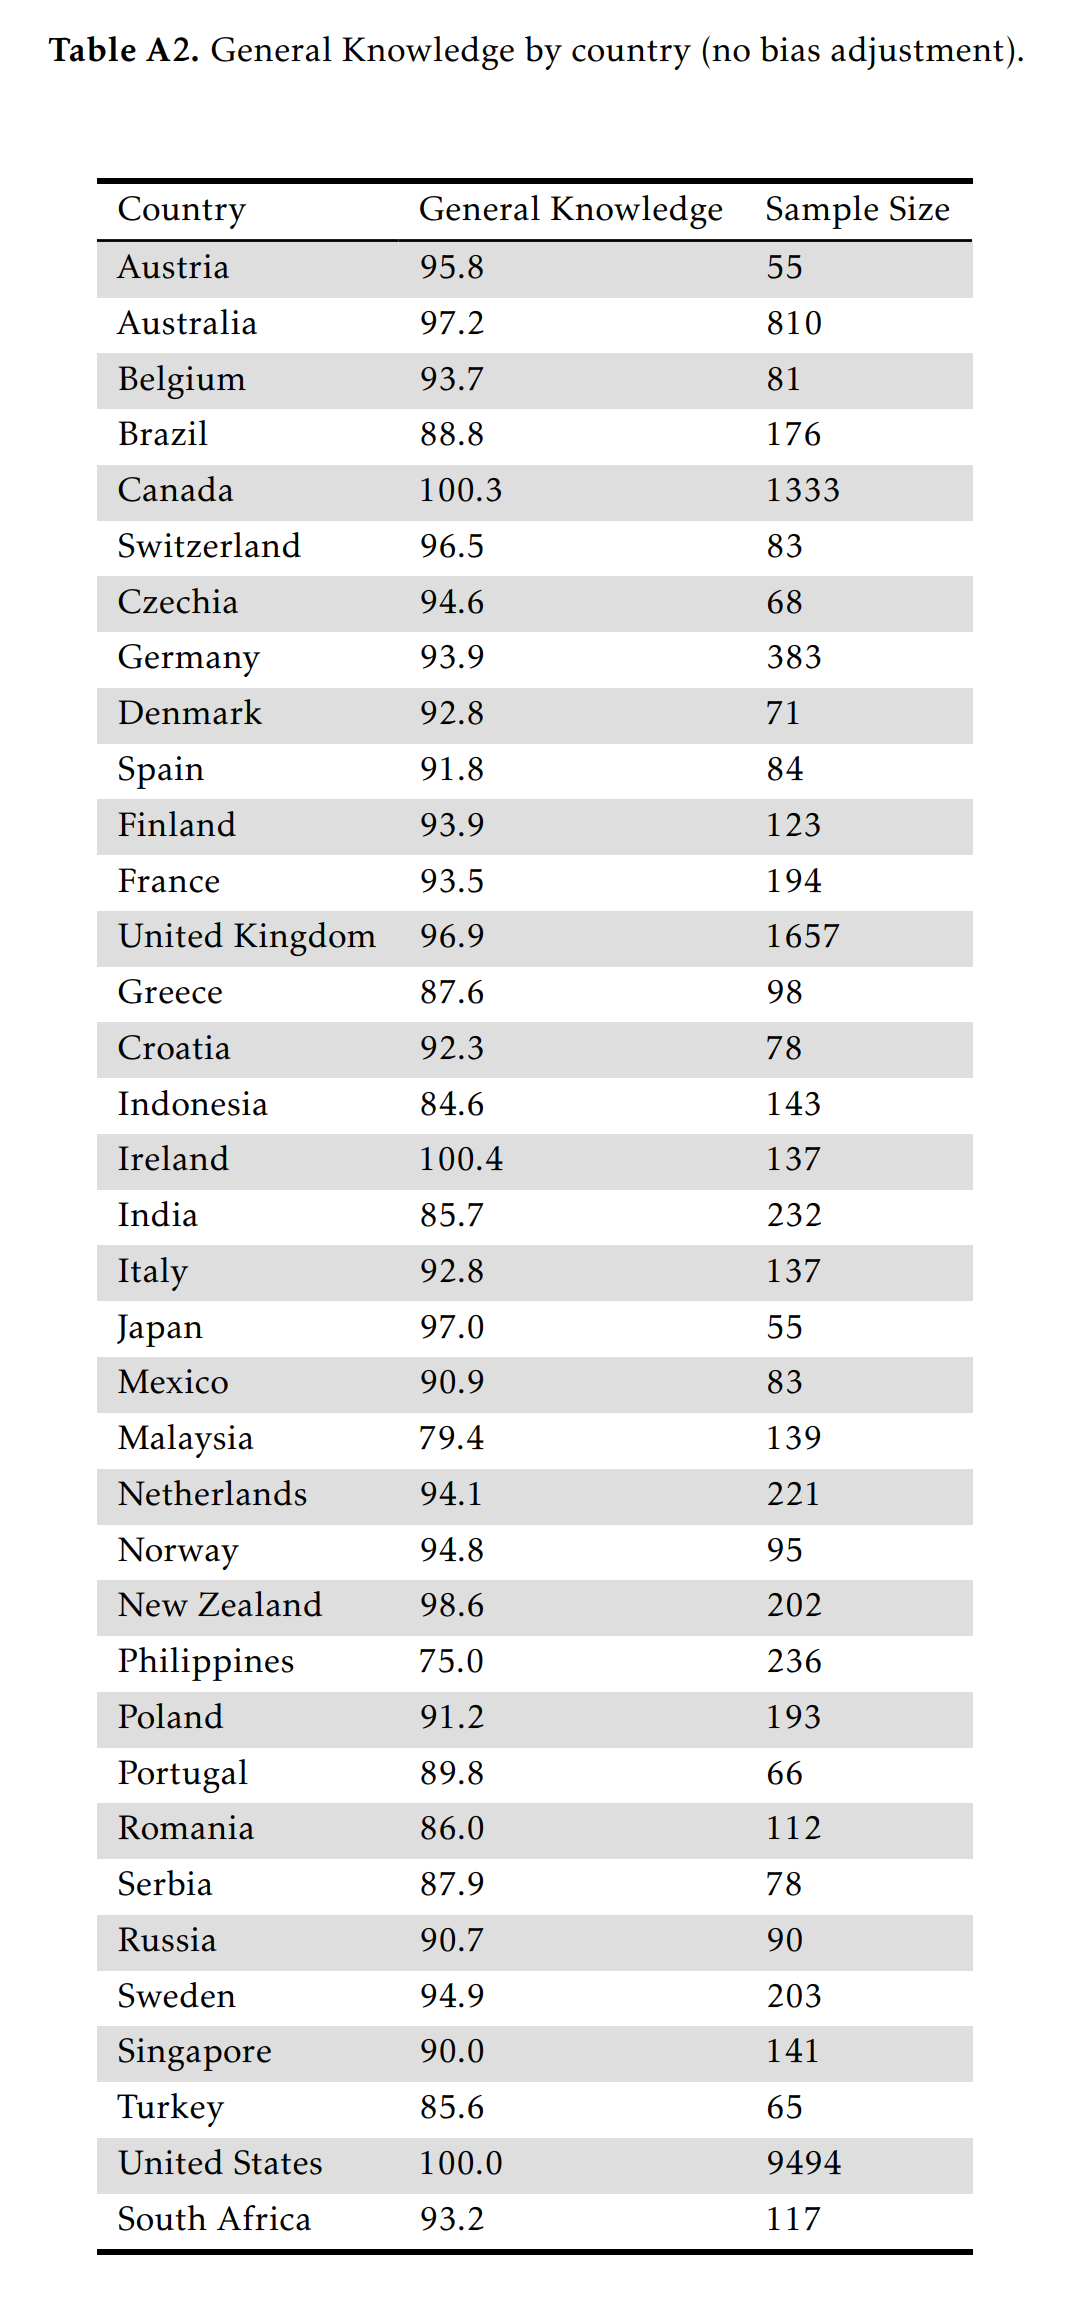
Concerning cultural bias, this test is decidedly Anglo-American in content (e.g. American authors). One can compute the national IQs to see this issue (USA set to 100/15):
In theory, one could detect the biased items and adjust for the bias. However, this did not work well in practice because:
The raw difference in ability between Germans and Anglos was -0.46, which increased to -0.54 after adjusting for bias using DIF. This is not plausible given that the IQ of German speaking countries (99.5) is almost equivalent to those of Anglo ones (98). This is probably because most of the items in the test were Anglo-favored, resulting in the unbiased items being improperly flagged as pro-German. In the case of sex differences, adjusting for DIF bias did not change the difference because the bias of the male and female favored items balances out.
The issues results from the methods which rely on relative bias detection. To find bias, one must choose some anchors (items assumed to be bias free), or test items in a leave-one-out fashion. My standard DIF approach is the leave-one-out method, which because of pervasive pro-Anglo bias results in the non-biased items being declared biased! Possibly, if one manually specified the anchors to be the most neutral questions, one could maybe achieve a sensible bias reduction. Still, the test has English language bias on top of the American cultural bias, so it is difficult to adjust entirely.
In addition to the culture and language bias, note that all these self-selected samples in online tests have varying degrees of selection bias. South Africa obtained an IQ of 93, higher than Poland. This is not credible and presumably suggests that some small number of English speaking South Africaners were the ones in the sample, while the Poles were not good at English. We have made some efforts to see if a truly unbiased knowledge test could be made for online testing purposes, and maybe more fine-grained analysis of this dataset could suggest some ideas in this regards. So far we have not been very successful. Asking questions for a general knowledge test that only involves culturally universal topics is difficult, and mostly results in questions about astronomy and physics. Even these are debatable due to differences in science curriculums in schools.
Finally, the paper provides norms for those wishing to calculate their IQ based on the knowledge test. To use this, go to the test page and get your results. Mine look like this:
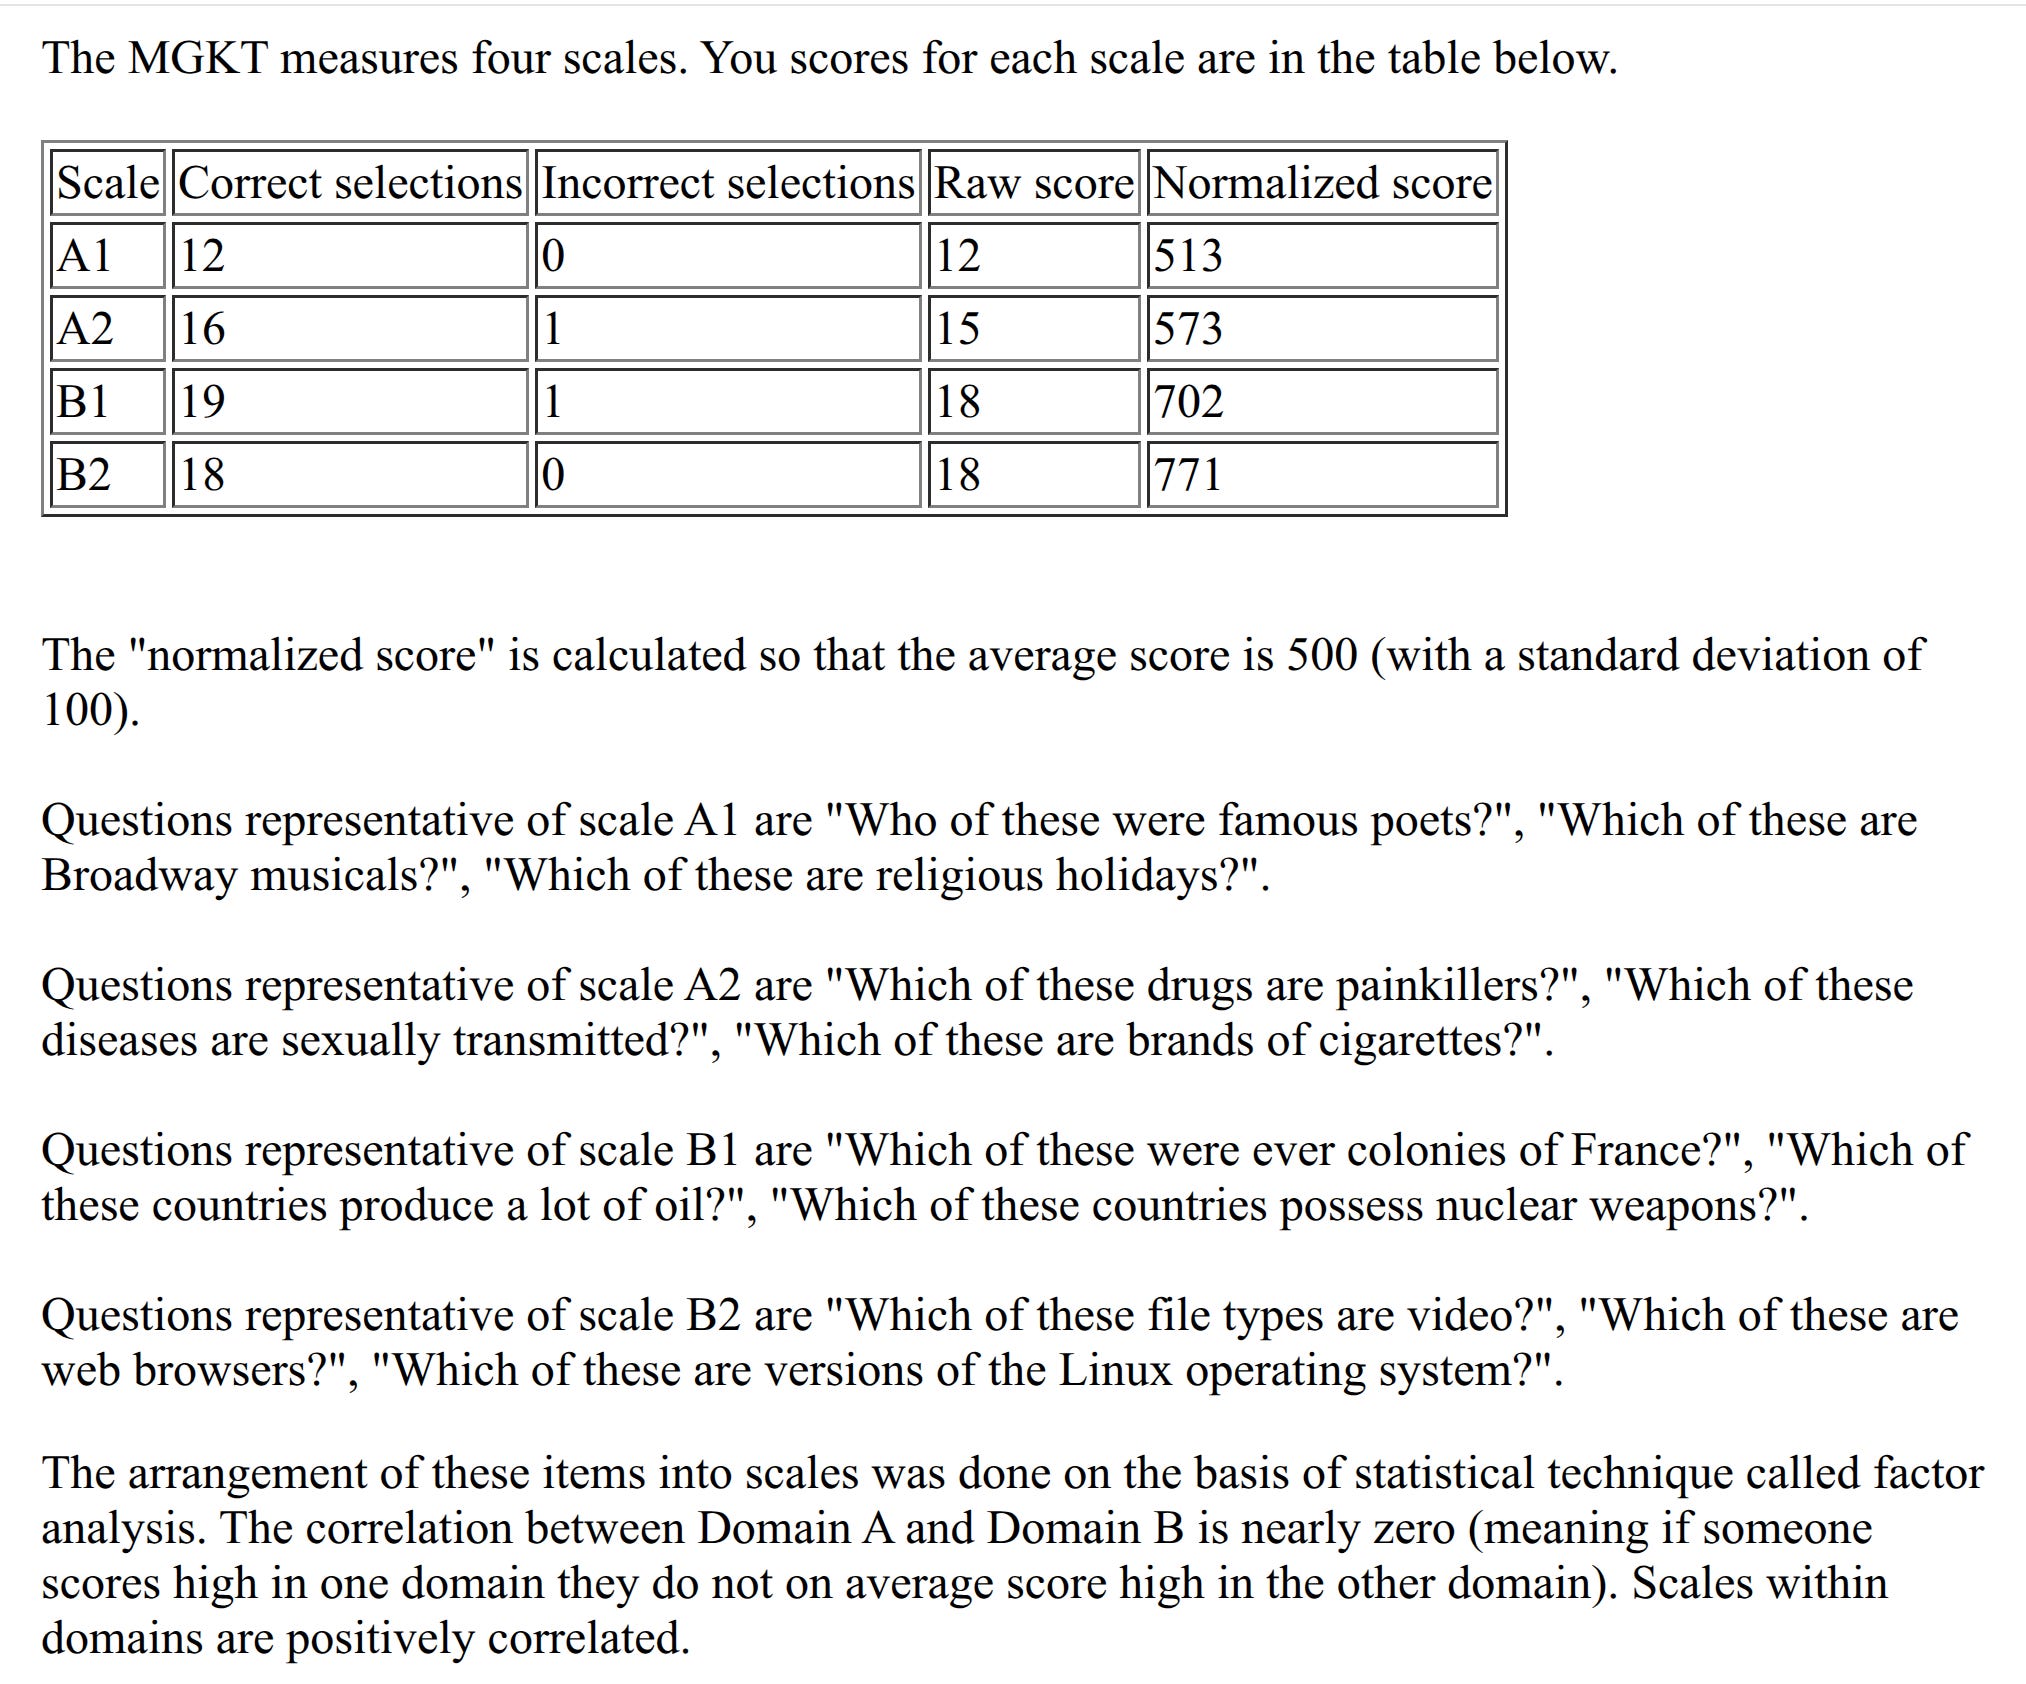
The site provides you with scores for 4 domains (I don’t know how the structure was decided upon). They are set to the PISA-like 500/100 scale, so you have to first convert the scores to z-scores (z = (score-500)/100), so in my case:
Poets, musicals, religious: 513 -> 0.13 z
Medicine, biology, cigarettes: 573 -> 0.73 z
History, geography, military: 702 -> 2.02 z
Computers: 771 -> 2.71 z
Due to the way composite variables work for correlated variables, you cannot just take the mean of the z-scores to get the composite score z score (the variance of a composite is the sum of variances but also covariances, so correlated variables increases the overall variance). This post provides the statistical details. The AIs are good enough to do the math (I assume a mean correlation among scales of 0.60):
Prompt:
if i have 4 variables that correlate about .60, and the z scores for one case is 0.13, 0.73, 2.03, and 2.71. What is the composite score z?
Grok:
The composite z-score is the z-score of the sum (or equivalently, average) of the four variables, accounting for their correlations.
Sum of given z-scores: 0.13 + 0.73 + 2.03 + 2.71 = 5.60.
Variance of the sum: 4 (from individual variances of 1 each) + 12 × 0.60 (from 6 pairwise covariances, doubled for variance formula) = 11.2.
Standard deviation of the sum: √11.2 ≈ 3.347.
Composite z-score: 5.60 / 3.347 ≈ 1.67.
[ChatGPT agrees]
Thus my score corresponds to about 125 IQ on this Anglo-biased test.
Alternatively, we could use the norm table we provided for the sum scores. First, we need to calculate the sum score. The test has a total of 160 correct options and 160 incorrect ones. Of the correct ones I picked 12+16+19+18=65/160. Of the wrong ones, I picked 2, thus a score of 160-2=158. Thus, total score was 65+158=223. For the age 31-50 norms, this corresponds to an IQ of 71.8. So what went wrong? It’s actually the website that gives very wrong counts for no reason I can tell. I did a manual count and my score should have been about 127 correct selections, and maybe 3 incorrect ones. This should give a score of 284. Looking up the norms for this suggests 125 IQ again. It is pretty annoying that the displayed sum scores are incorrect on the website, but the workaround is that one can use the scaled scores.
> Picking a correct option gives 1 point and NOT picking an incorrect one gives 1 (the website uses negative points for the incorrect ones but the scores are equivalent).
Is this a description of the scoring method you advocate, or the scoring method used by the website? They emphasize that picking a correct option gives 1 point and picking an incorrect option gives -1.25 points, which seems like a significant difference compared to +1 / -1.
I was also put off by the many spelling errors in the test. "Cribbidge" isn't a card came, but "cribbage" is...
> In this case, AIDS (actually HIV)
Really? This looks like a case where the answer on the test is correct. Wouldn't AIDS be the "disease" and HIV be the "pathogen"?
Just took it. The presence of incorrectly spelled versions of correct answers ("Quatar" for oil producing countries, "Lukemia" for cancers) was confusing. I had to weigh the probability of the test writers making a mistake versus the probability of them including decoy answers that test knowledge of spelling, which I doubt is the kind of calculation test subjects should be making.