
Newest results in 'deep roots' in the Americas
Ancestry in disguise

I am currently collecting reader questions from paid subscribers. Ask your questions here (or email me at emilowk@proton.me).
While we wait for our upcoming Admixture in the Americas 2.0 (maybe in the December release of MQ), let’s look at some other recent results for ‘deep roots’ literature, also known as ancestry or admixture regression, in the Americas. We’ve already seen the new Mexican sibling admixture study, so let’s now look at the other recent study.
Jaramillo-Echeverri, J., & Álvarez, A. (2025). Does ancestry shape access to education? Evidence from surnames in Colombia. Journal of Development Economics, 103626.
We examine the deep historical roots of contemporary disparities in access to high-quality education in Colombia. Using rare surnames to follow lineages of ethnic minorities and elites from the colonial era to the early 20th century, we analyze whether ancestry predicts access to educational institutions. Our findings reveal strong correlations: Students with Afro-Colombian or Indigenous surnames are less likely to be enrolled in high-quality schools and more likely to be attending low-quality schools, while those with elite surnames show the opposite pattern. Although we observe regression to the mean for some historical elites, privileged access to education holds over time for persistent elites. We explore assortative mating as a mechanism behind this persistence in inequality of opportunity. We find that marriage patterns differ significantly between attendees of high- and low-quality schools, with homogamy reinforcing educational disparities. These results demonstrate the enduring influence of past-rooted hierarchies on contemporary educational inequality in one of Latin America’s most unequal countries.
I couldn’t find a copy of this study (email it to me if you can), but the authors published the preprint version 2 years ago. I assume they are roughly the same thing (research moves glacially in academia).
The research framework is the standard left-wing one, with talk about educational apartheid (even though there is no apartheid in the South African sense):
Due to the lack of reliable longitudinal data, it has been challenging to show if the contemporary educational apartheid has been persistent over time. However, using rare surnames and their relative representation in socioeconomic outcomes has shown to be a very productive way to overcome the limitations of scarce long–term longitudinal data.3 We study social groups from different historical periods and ethnic backgrounds linked with a clear position on the social ladder in the past to evaluate their position in the educational system today.4 Our analysis is based on using rare surnames to follow multiple generations and take advantage of the availability of rich contemporary administrative data–sets and historical information (Clark et al., 2015; Guell, Mora, & Telmer, 2013; Jaramillo-Echeverri, Alvarez, ´ & Bro, 2021). We also exploit the official rule of registering paternal and maternal surnames inherited from the Spanish naming customs to describe the marriage patterns of our historical groups in the educational system. Following Chiappori, Dias, and Meghir (2020), we measure assortative mating in the marriage market as another measure of segregation in the educational system
Despite that angle, they found the research by Greg Clark using surnames as family and ancestry indicators useful, and applied it to Colombian data. Their causal model is a sort of conspiracy theory where the elites control the educational institutions and prevent the unprivileged from using them, thus keep social inequality going. A cursory search reveals quite the contrary. Colombia was one of the first Latin American countries to implement affirmative action (in 1991), that is, pro-underperforming ‘minority’ bias in the educational system. Naturally, Africans are the target beneficiaries:
As a result, in 1996, the Programa de Créditos Educativos para Comunidades Afro-Colombianas (Afro-Colombian Educational Credits Program)2 awarded university credits to Afro-Colombians for community service, whether “social or academic.” To qualify for the program, students must be certified members of an Afro-Colombian community, must demonstrate academic excellence and limited socioeconomic resources, and must present a project aimed at solving a local community need.3
Moreover, starting in the late 1990s, several Colombian public and private universities created special admissions programs for ethnic minorities.4 The affirmative action programs began admitting Indigenous students first and then expanded to include Afro-Colombians.5
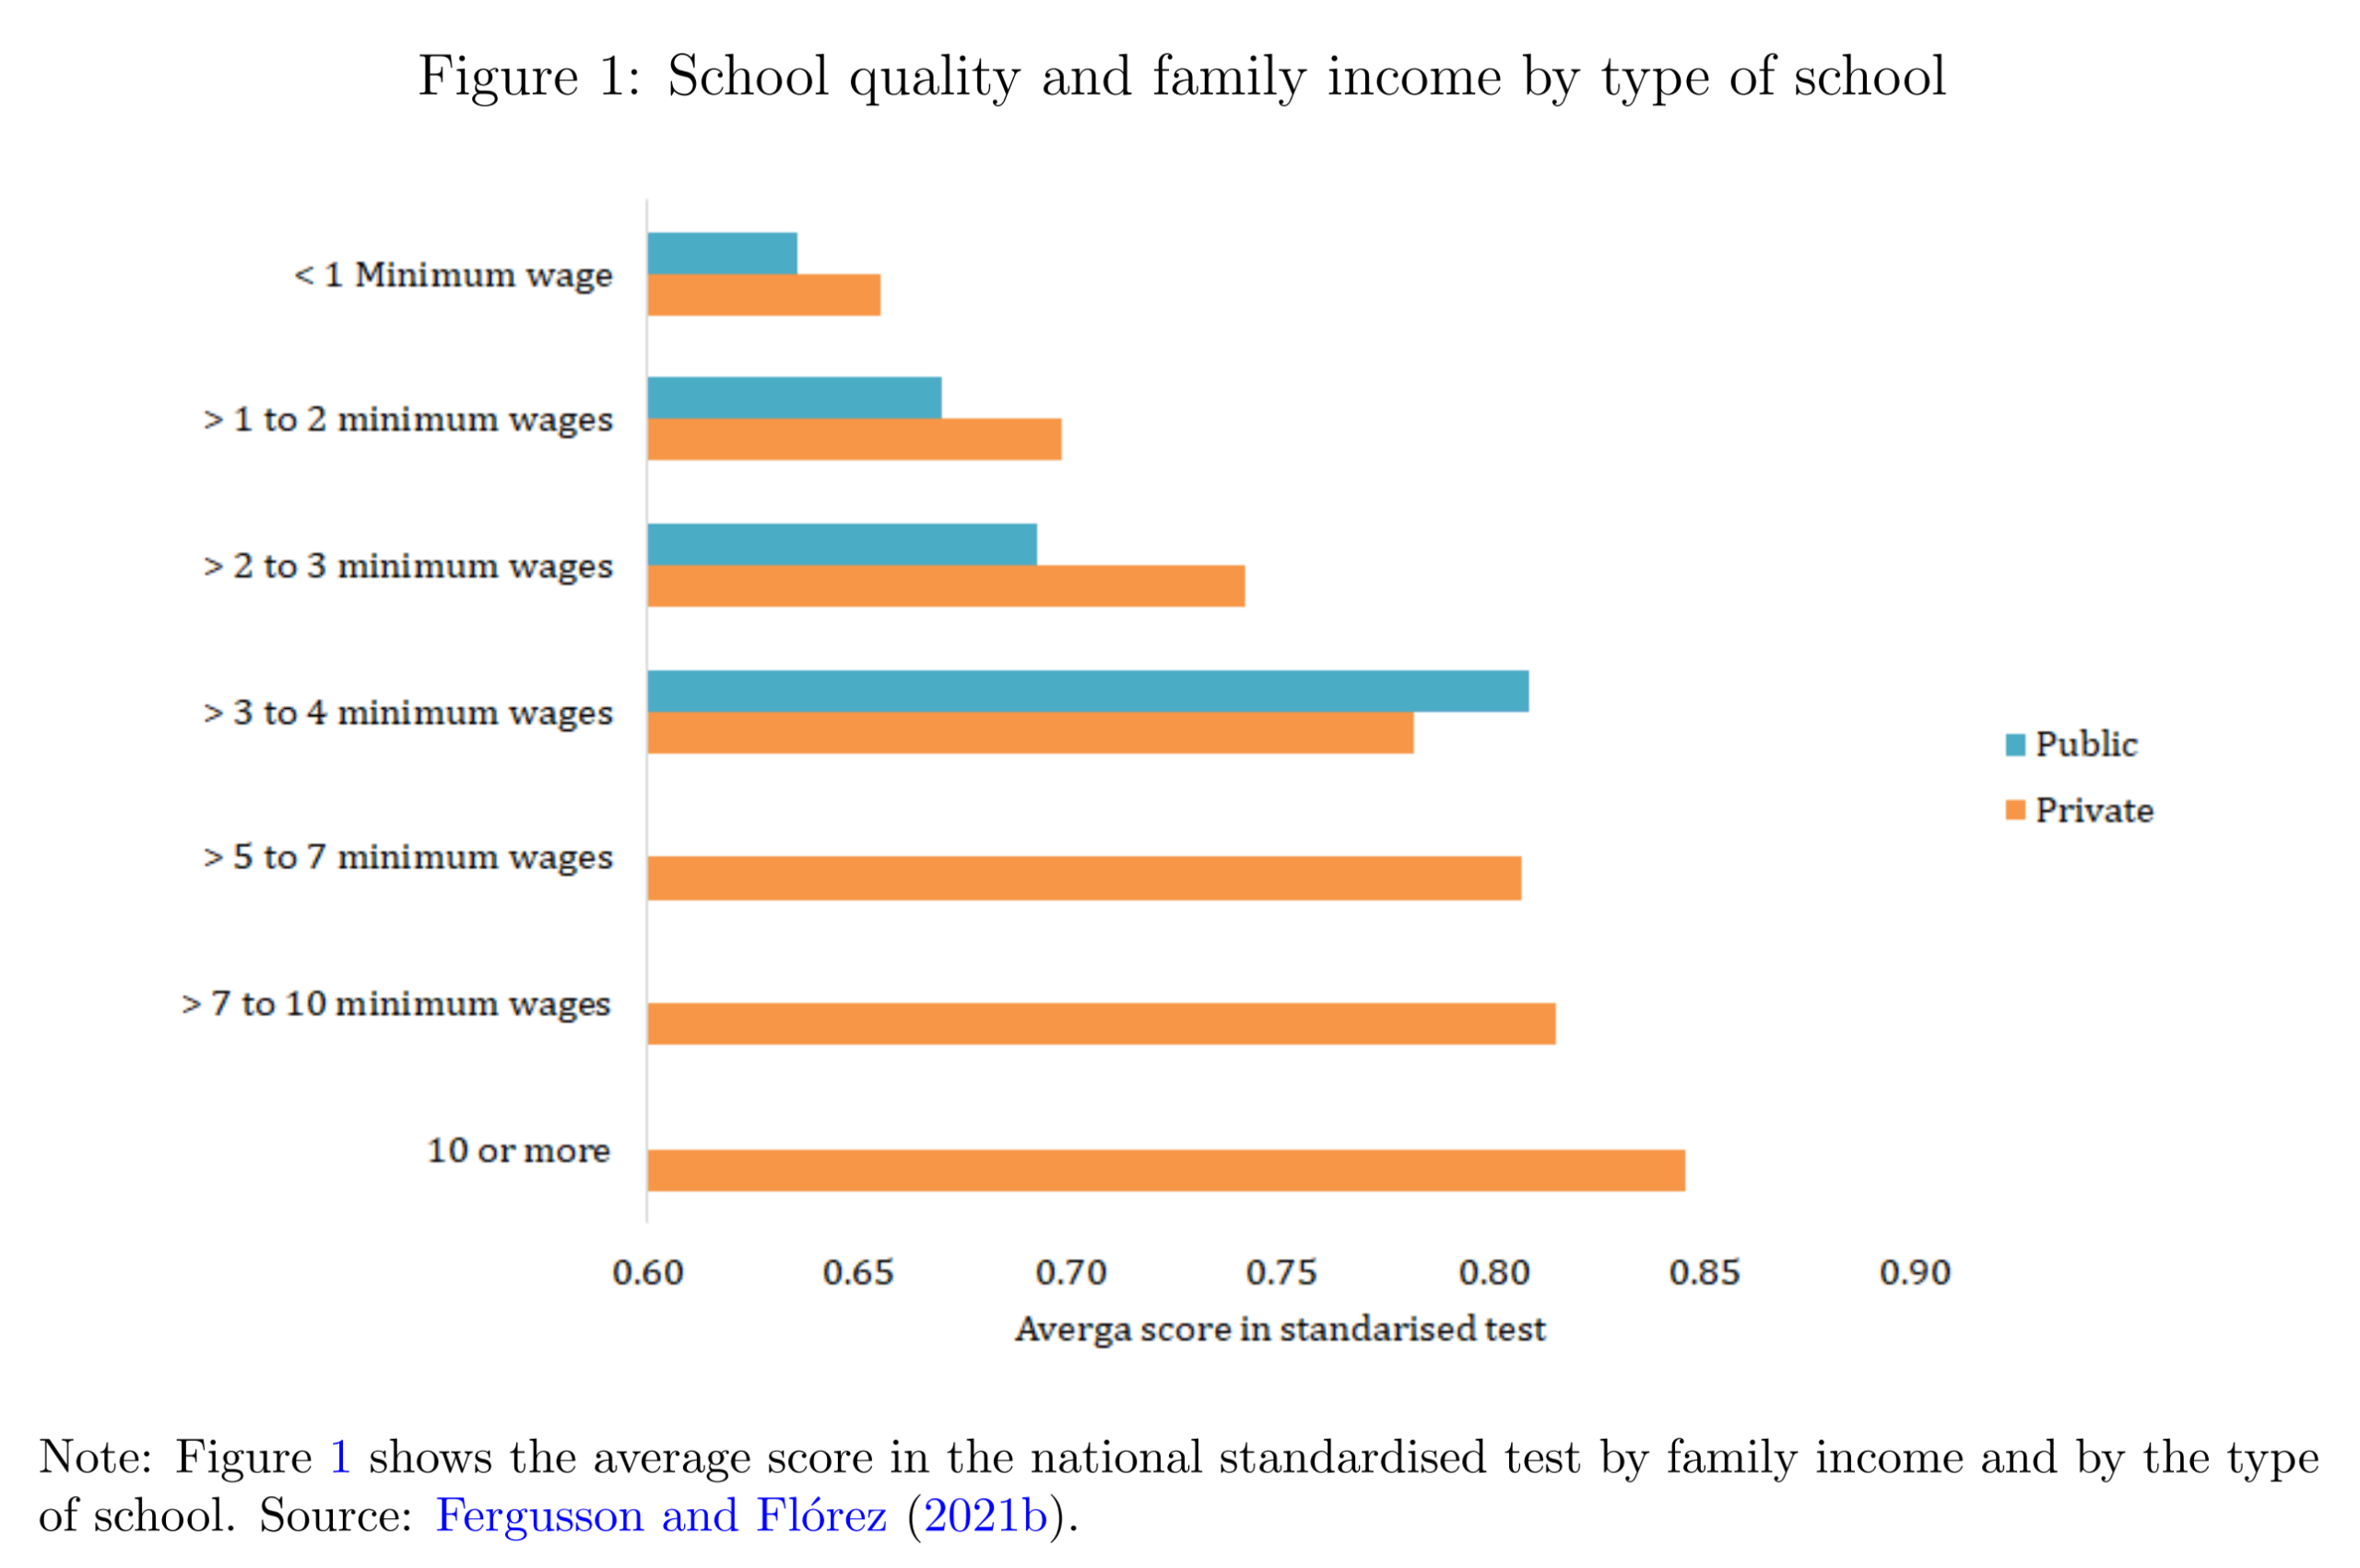
Parents like to avoid such problems and the regular issues with sending your kids to schools with subpar students (harassment, violence etc.), so the higher status parents respond by avoiding the public schooling and use private schools (thus they pay twice for schooling in part to keep their kids away from the problem kids):
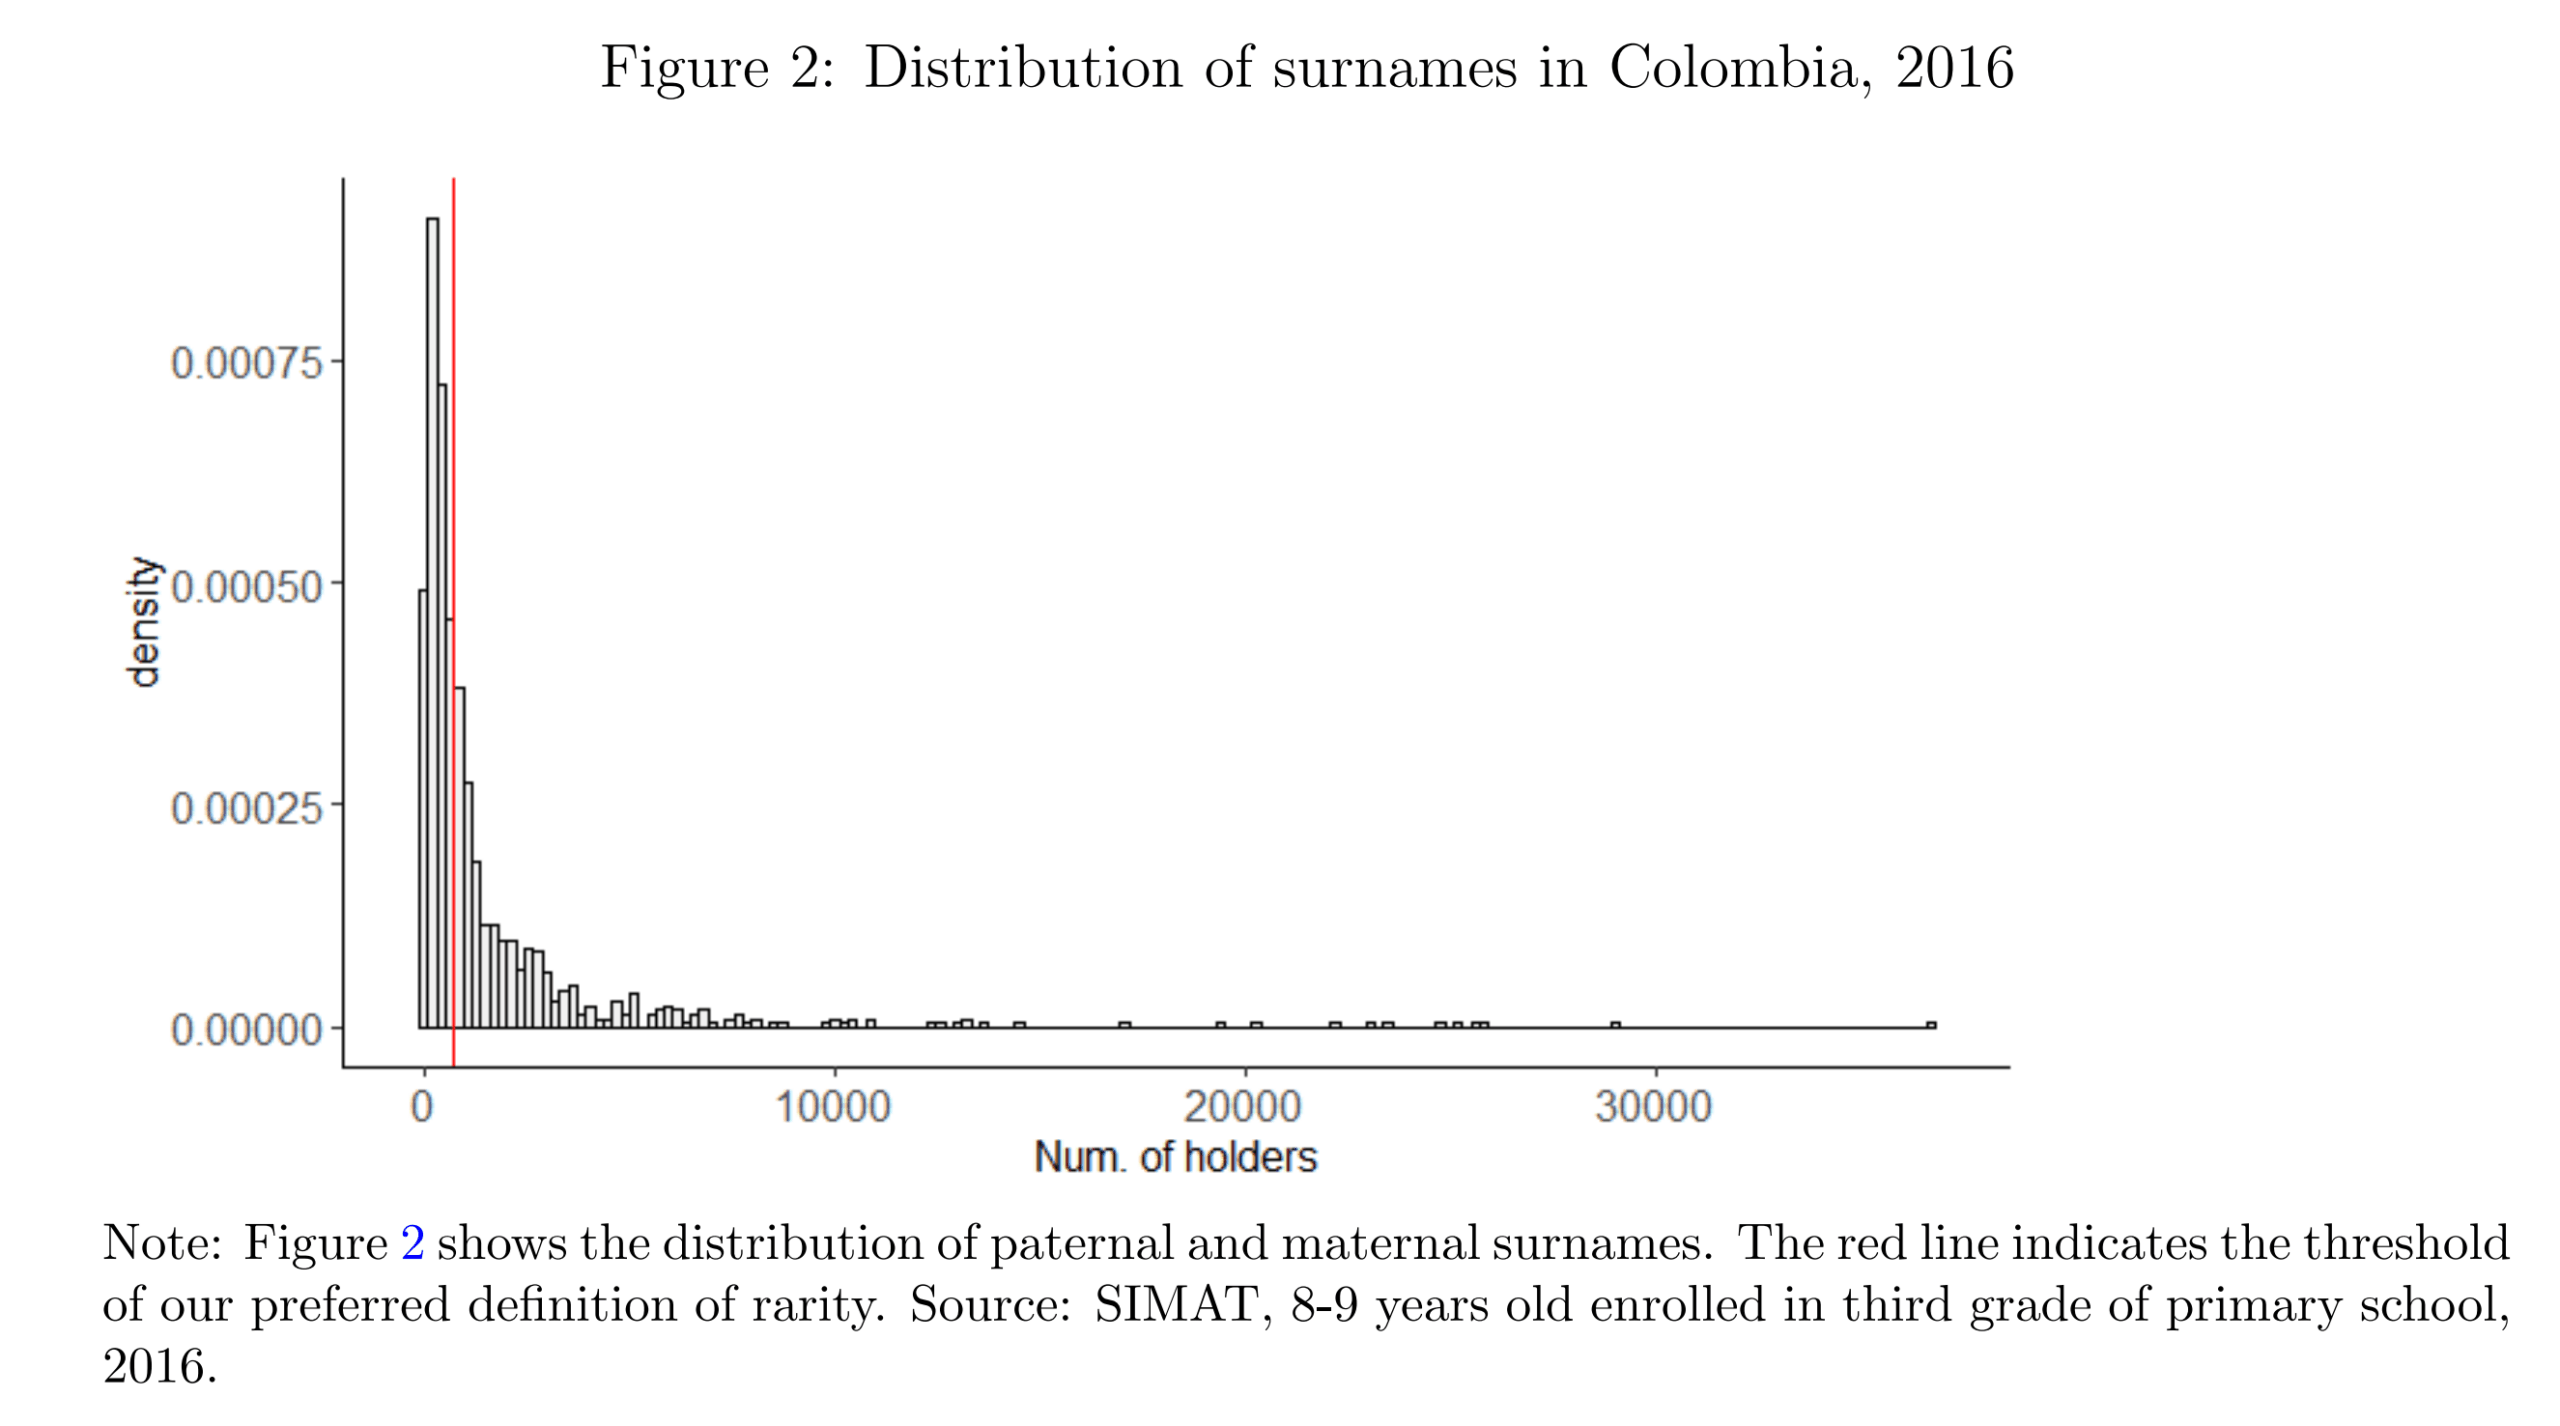
The distribution of number of holders of surnames (last names) follow the usual power law-like distribution:
After this, they compute the relative representation by surnames, the same was Clark’s studies. Beginning with the common surnames:
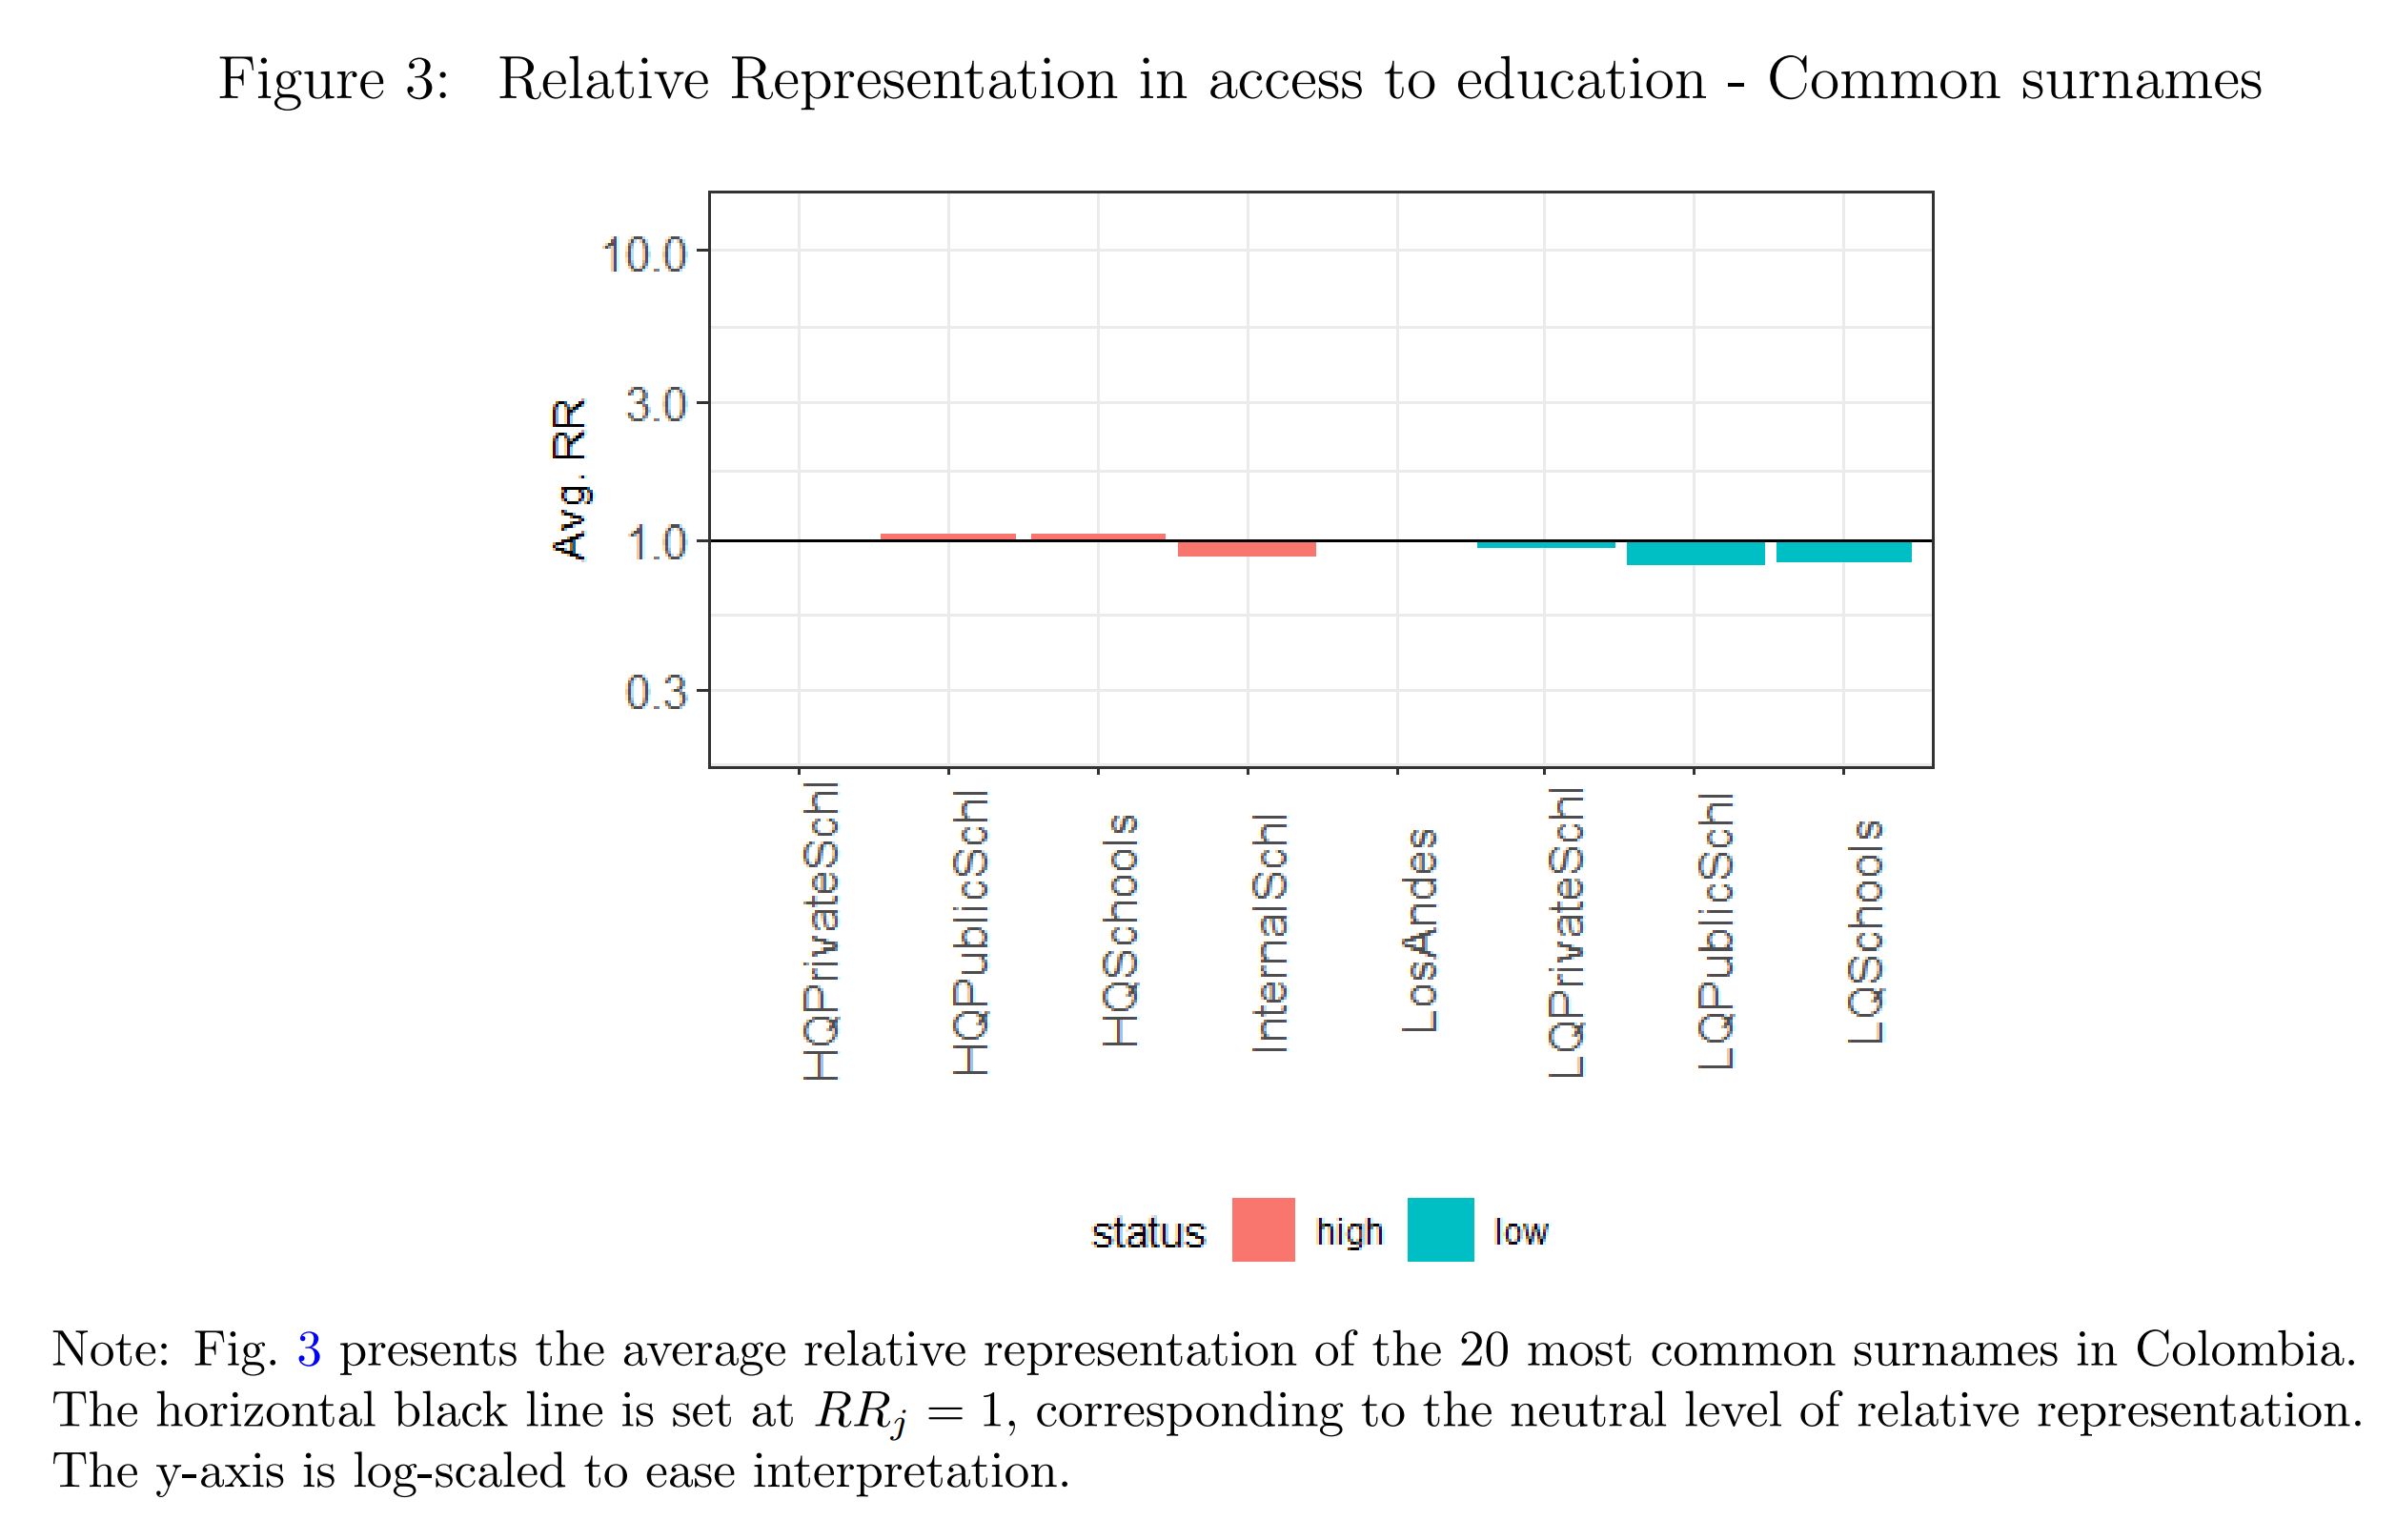
As in other countries, the common surnames are approximately representative of the population as a whole. Next they group surnames by ethnic and ancestral social class belongings:
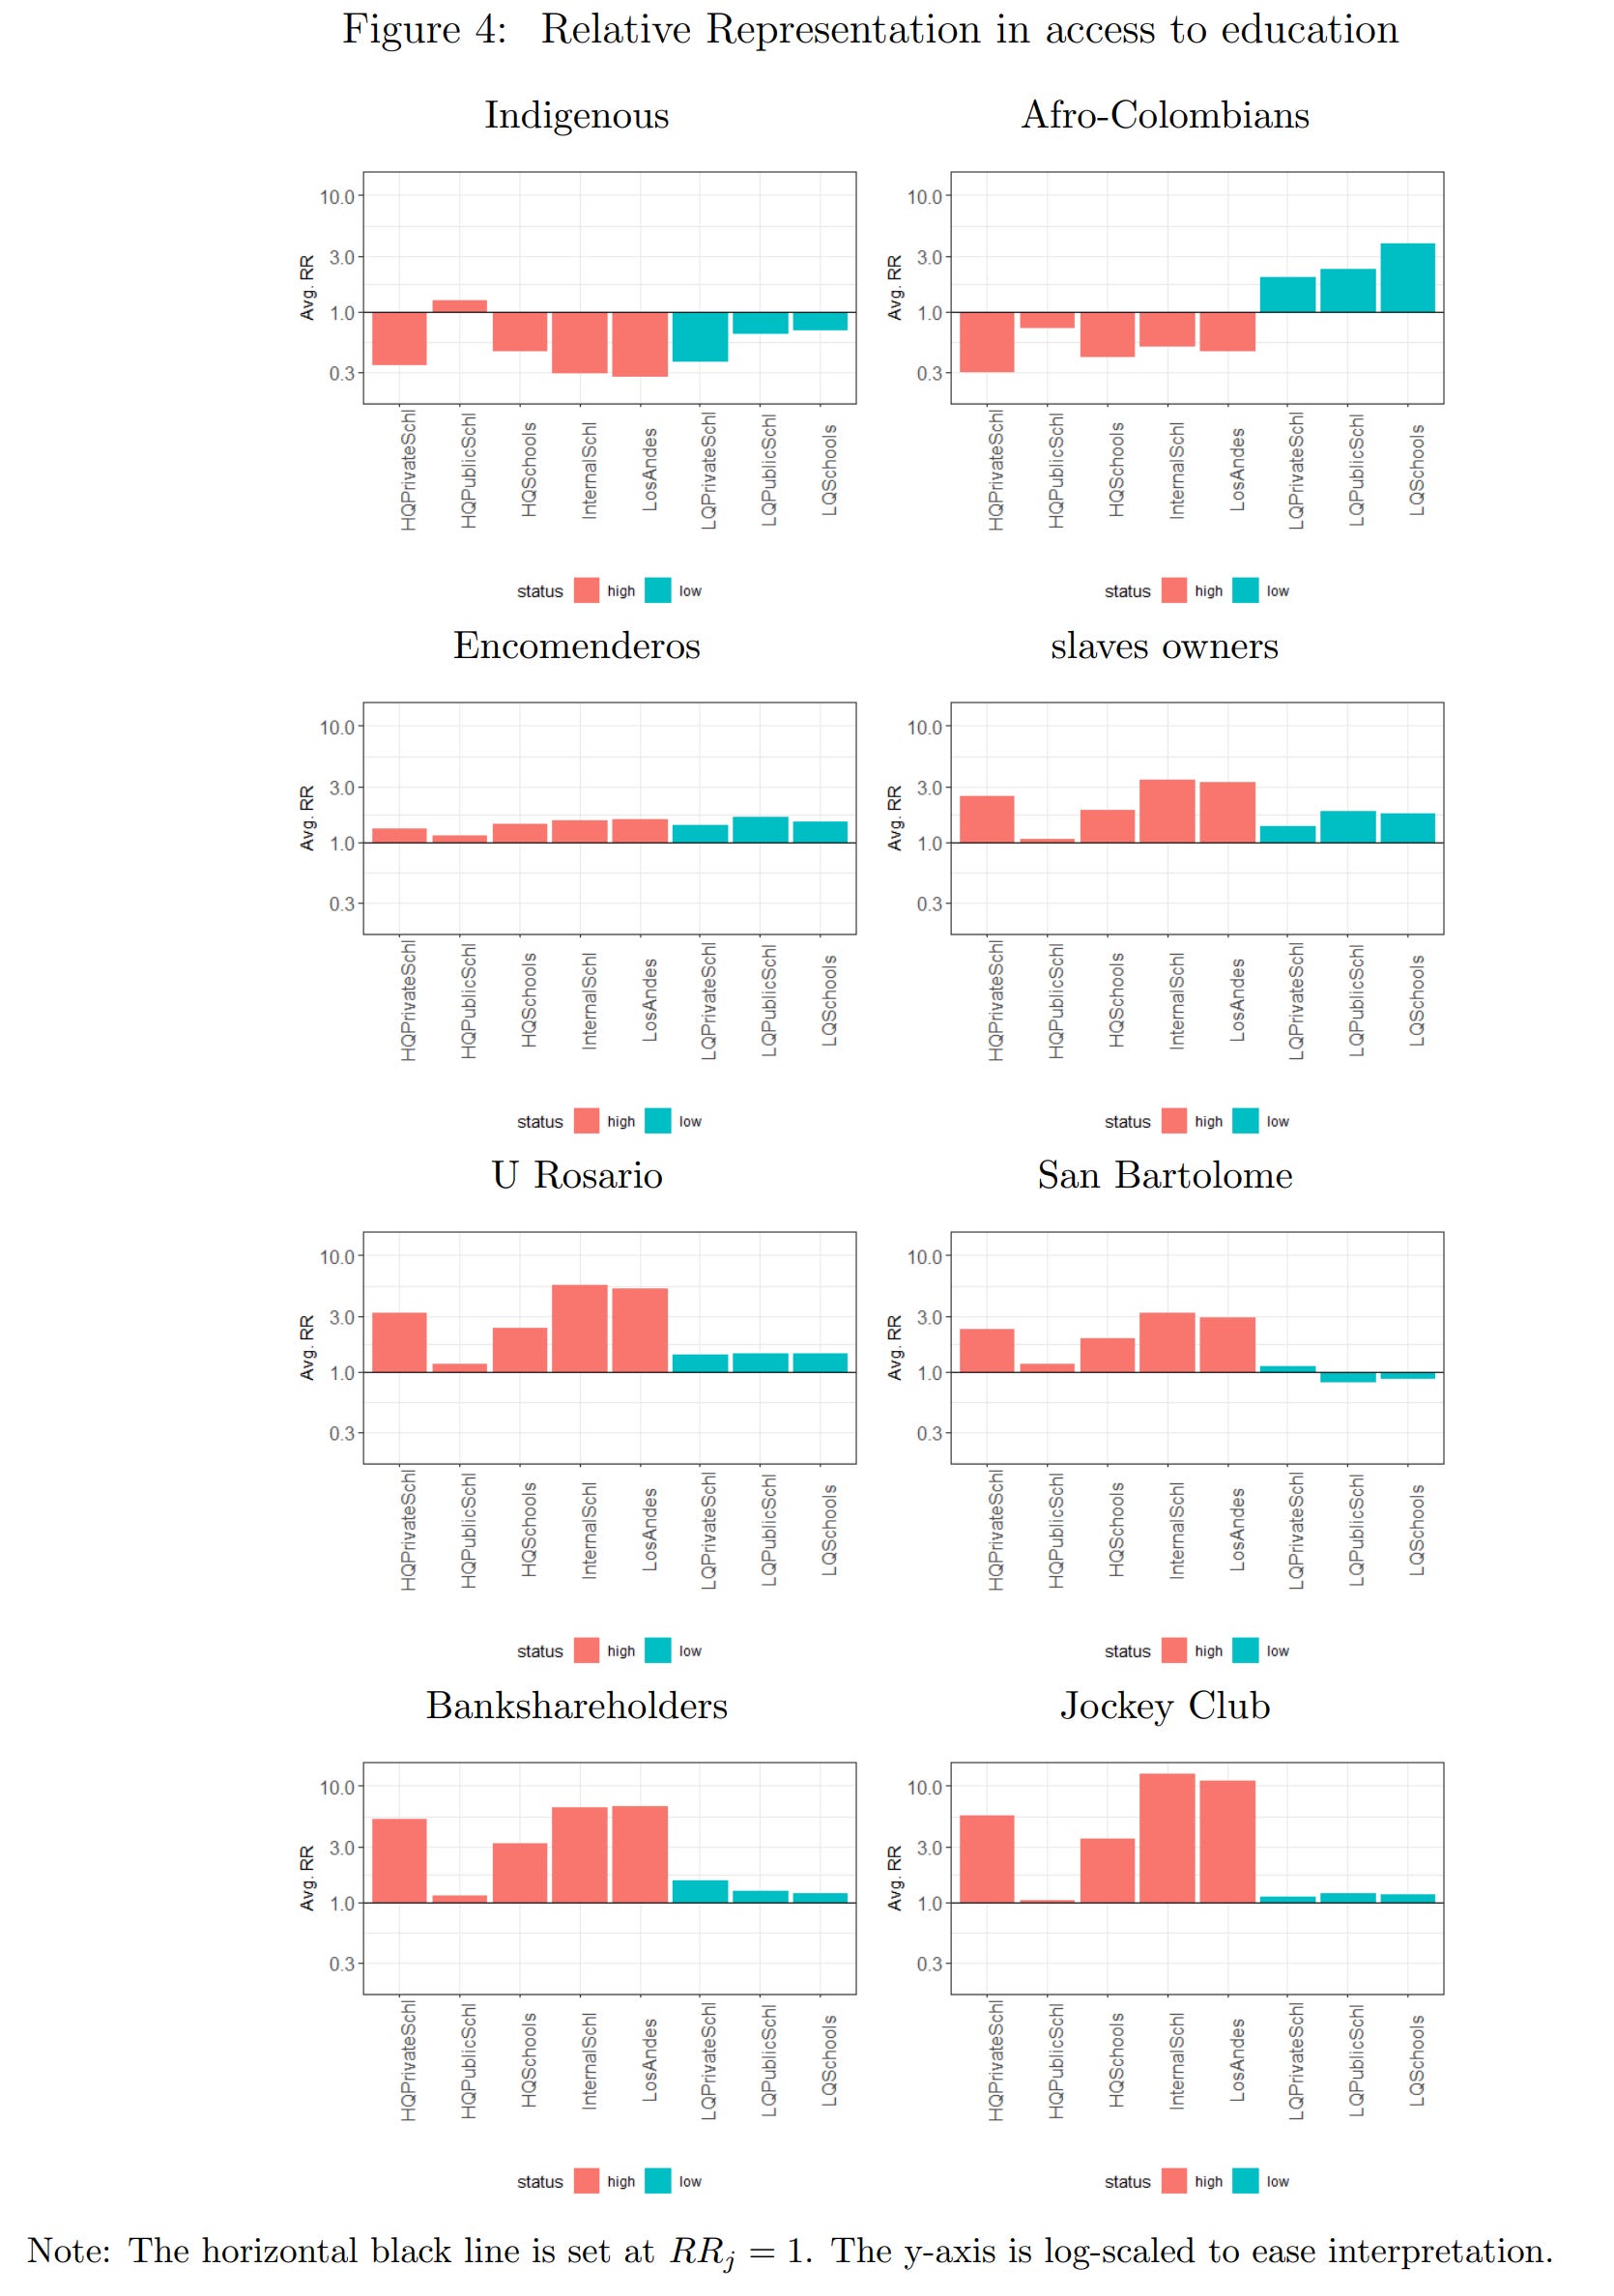
LQ = low quality, HQ = high quality, Los Andes = national top university, international schools = high ranking schools. With this in mind, we can interpret the figures. In the top left, we see that native American (indigenous) surnames are ~0.3 as like to attend the top university, but also mysteriously less likely to attend the low quality schools. My guess is that their children often don’t go to school at all. Otherwise, how do the results make sense? The authors don’t discuss this obvious issue with the results. The African descent population is also less likely to attend the top university, but over-represented in low quality schools. My interpretation is that they live in cities and send their kids to school, but they end up in the worse schools because they perform poorly academically. The various other elites also have kids that are over-represented in high quality schools and to a lesser extent the low quality schools (again, I assume because many children just don’t go to school at all).
This kind of research can’t really tell us about causes by itself, and anyone writing such a paper must therefore gloss the findings in whatever narrative the authors prefer. Given the facts about widespread affirmative action and the time since the colonial elites were actually in power (independence from Spain in 1810), slavery was allowed (1851) etc., it is difficult to believe in a purely social model.
There is another recent study that helps with the causality:
Woo-Mora, L. G. (2025). Unveiling the Cosmic Race: Skin tone and intergenerational economic disparities in Latin America and the Caribbean. Journal of Development Economics, 103594.
This paper examines how skin tone shapes intergenerational economic disparities across 25 Latin American and Caribbean countries. First, it analyzes the distribution of ethnoracial identities and skin tone, confirming Mestizo predominance and revealing how broad categories obscure substantial phenotypic diversity. Second, it documents non-linear gaps in income and education, with darker skin tones consistently linked to economic disadvantages. A variance decomposition shows that skin tone explains significant within-group variation, offering explanatory power beyond self-reported ethnoracial categories. Finally, using mothers’ education as a benchmark, the study provides novel cross-country evidence on skin tone gaps in absolute educational intergenerational mobility, revealing barriers to upward mobility for darker-skinned individuals. Robustness checks with machine-assessed skin tone data from Mexico, incorporating additional parental and contextual controls, confirm these disparities. These findings underscore the need to account for phenotypic variation when studying economic inequality in Latin America.
As before, I can’t find a copy of the published journal version, but a preprint from 2024 is available here. You won’t be surprised to learn that the author also thinks race is made up:
Race is socially constructed rather than biologically determined (Jablonski 2021a; Darity 2022; Rose 2023). Sociologists argue that racial conceptions are often based on physical characteristics or phenotypical traits, while ethnicity pertains to cultural traits. The long-term co-evolution of culture, genes, and environment explains differences in pigmentation (Henrich 2016; Jablonski 2021b), with skin tone being a key, but not the only, element of race (Sen and Wasow 2016).
The dataset used here is the LAPOP:
To study phenotypical disparities across Latin American countries, I leverage a comprehensive dataset that examines both ethnoracial identity and phenotypic dimensions. This dataset originates from the Latin American Public Opinion Project’s (LAPOP) AmericasBarometer survey.The survey is conducted biennially in most countries across the Americas, employing a standardized questionnaire and utilizing stratified, nationally representative samples of voting-age adults (LAPOP 2024).
It’s a public access dataset which you can also download from here. We’ve used this a few times. In fact, we already carried out this research idea some years ago when exploring the data, though we didn’t end up using it (aside from Argentina). The surveys were given to people in Spanish, Portuguese and English, depending on country. The surveys are rather long and mostly ask about politics, but they also ask about social status indicators (e.g. ownership of a house, cars, water toilet, computer etc.). On top of this, some of the surveys asked about skin color which the interviewer rated on a rating scale like this one:
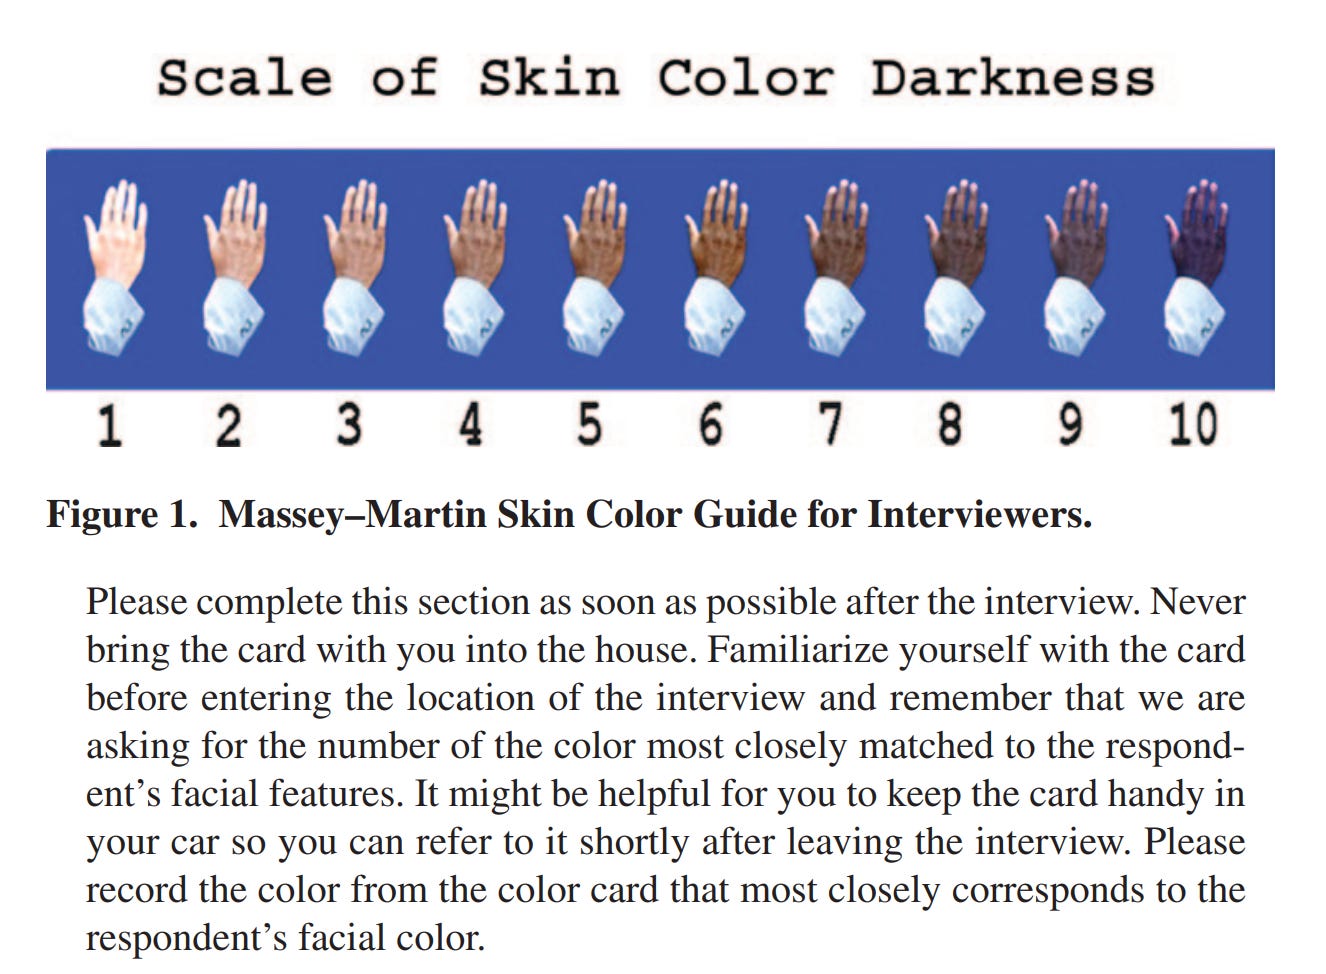
LAPOP even administered a few knowledge items (depending on year and country), from which one can make a very crude IQ test (not used in this study). Here’s the skin color ratings by self-identified race/ethnicity (social race):
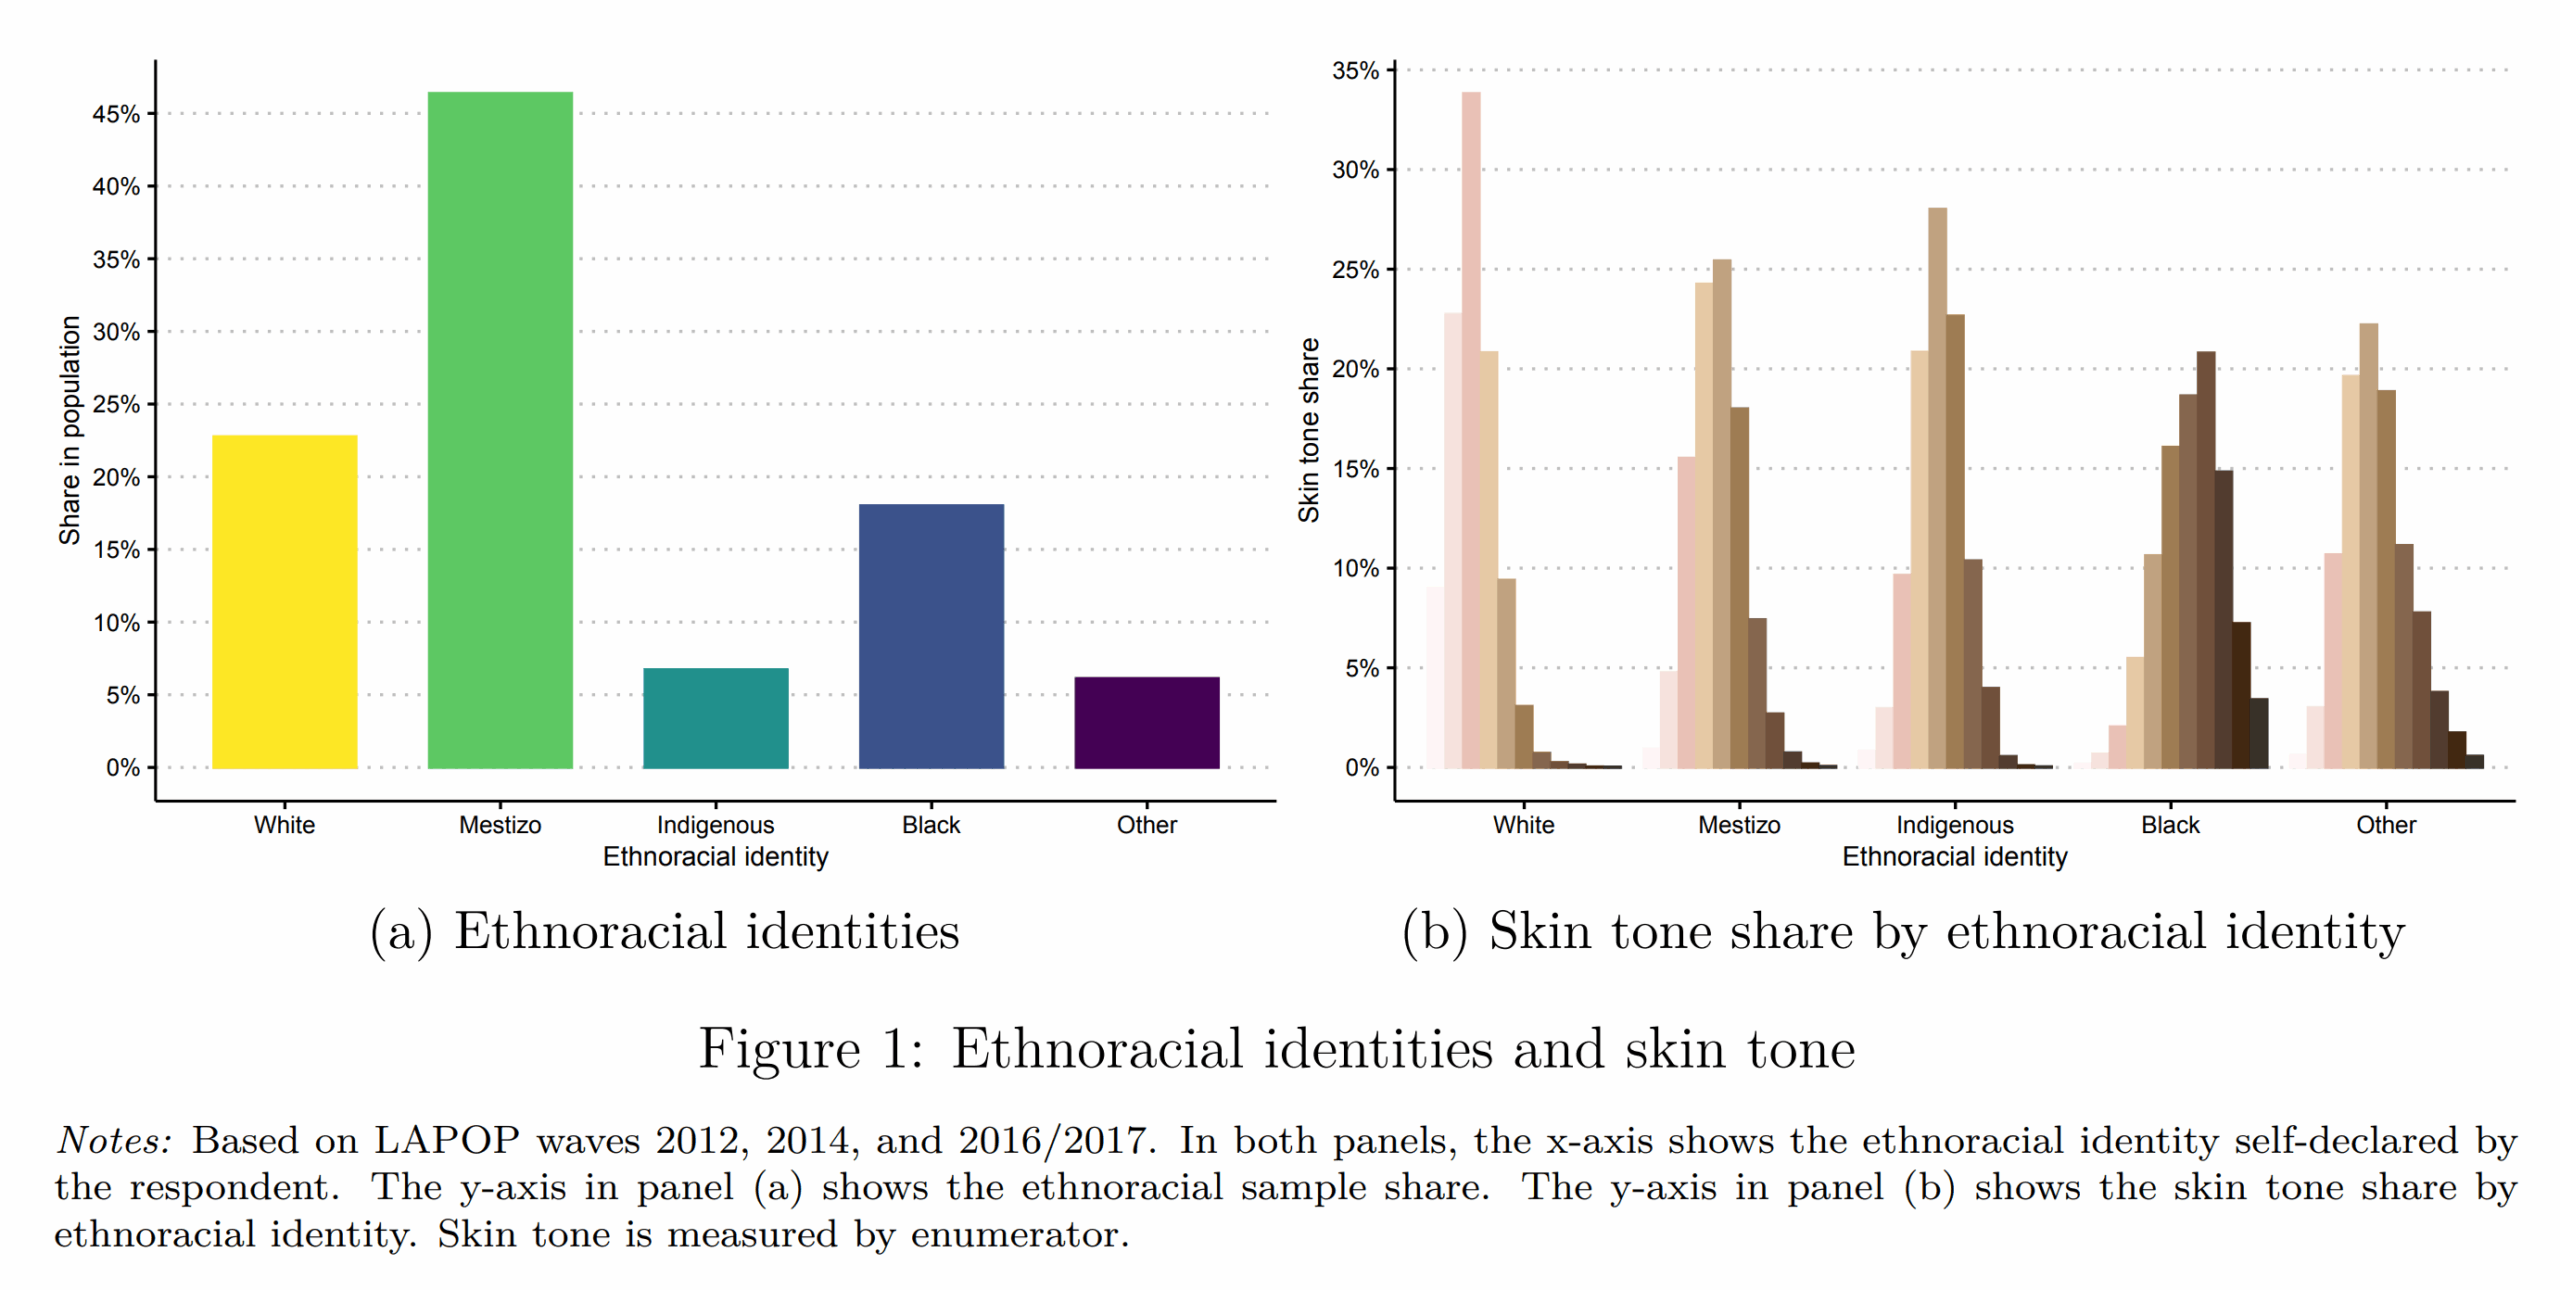
We see that the self-identified race categories have quite substantial skin color variation. Some variation is expected on purely methodological grounds:
Interviewer ratings of skin color correlate about 0.70 with each other (or so).
Even within a narrow race (say, Danes), there is some genetic skin color variation.
Exposure to the sun affects skin color, and thus the measurements are impacted by job type (outdoor work), travel habits, and sun lotion use (if using faces or arms).
Higher grade clinical measures use an actual device for measuring skin color instead, and usually measure it a place that doesn’t usually get sunlight (under the arms near the armpit). Anyway, the results look sensible enough given these limitations and crude nature of assigning yourself to a single racial group as a proxy for ancestry. The main results the author wants to talk about are these:
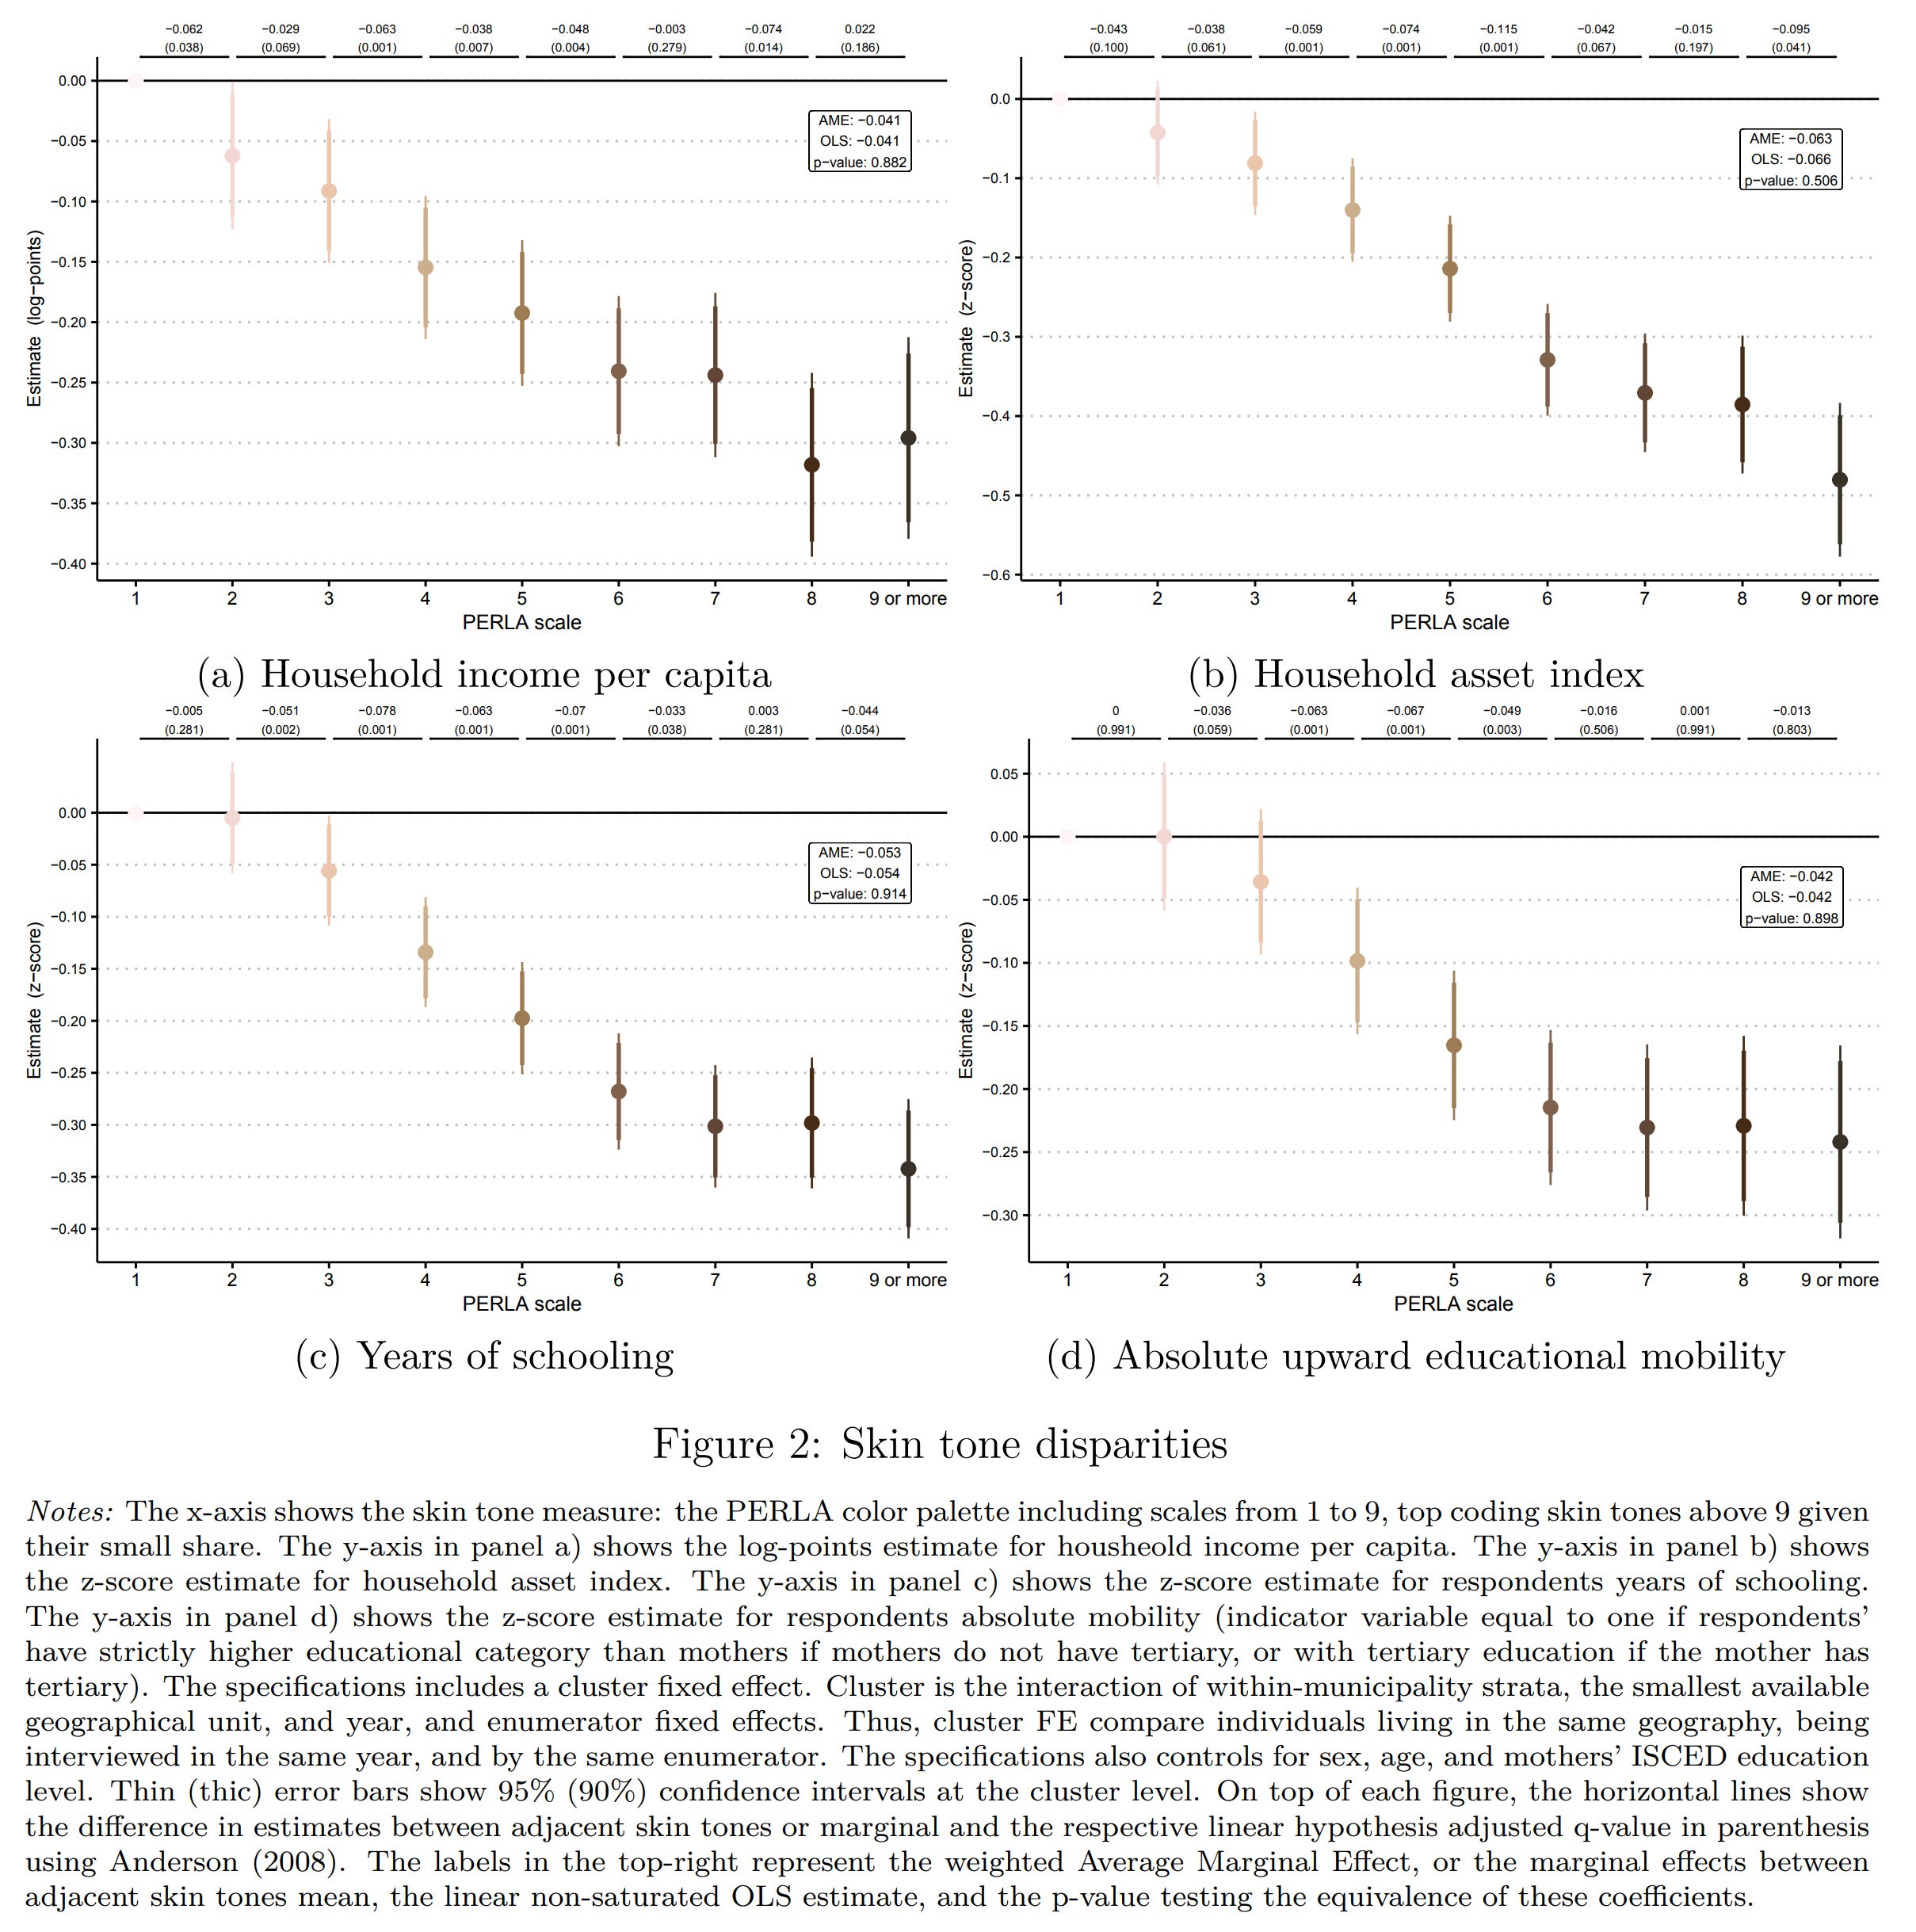
These are very linear associations, which are to some extent inconsistent with the explanatory model offered, which is that skin color discrimination (colorism):
Discrimination would in some forms work using thresholds (‘no coloreds on premises’), and thresholds result in non-linear patterns, not the linear ones observed above. Granted, given the confidence intervals, maybe some nonlinearity is not detectable with this sample size and model specification (although it is huge). Note also that the model “controls for sex, age, and mothers’ ISCED education level.” which is somewhat problematic, as on the genetic model, these differences are also genetic and caused together (sociologist fallacy).
What about country differences in this skin color hierarchy?:
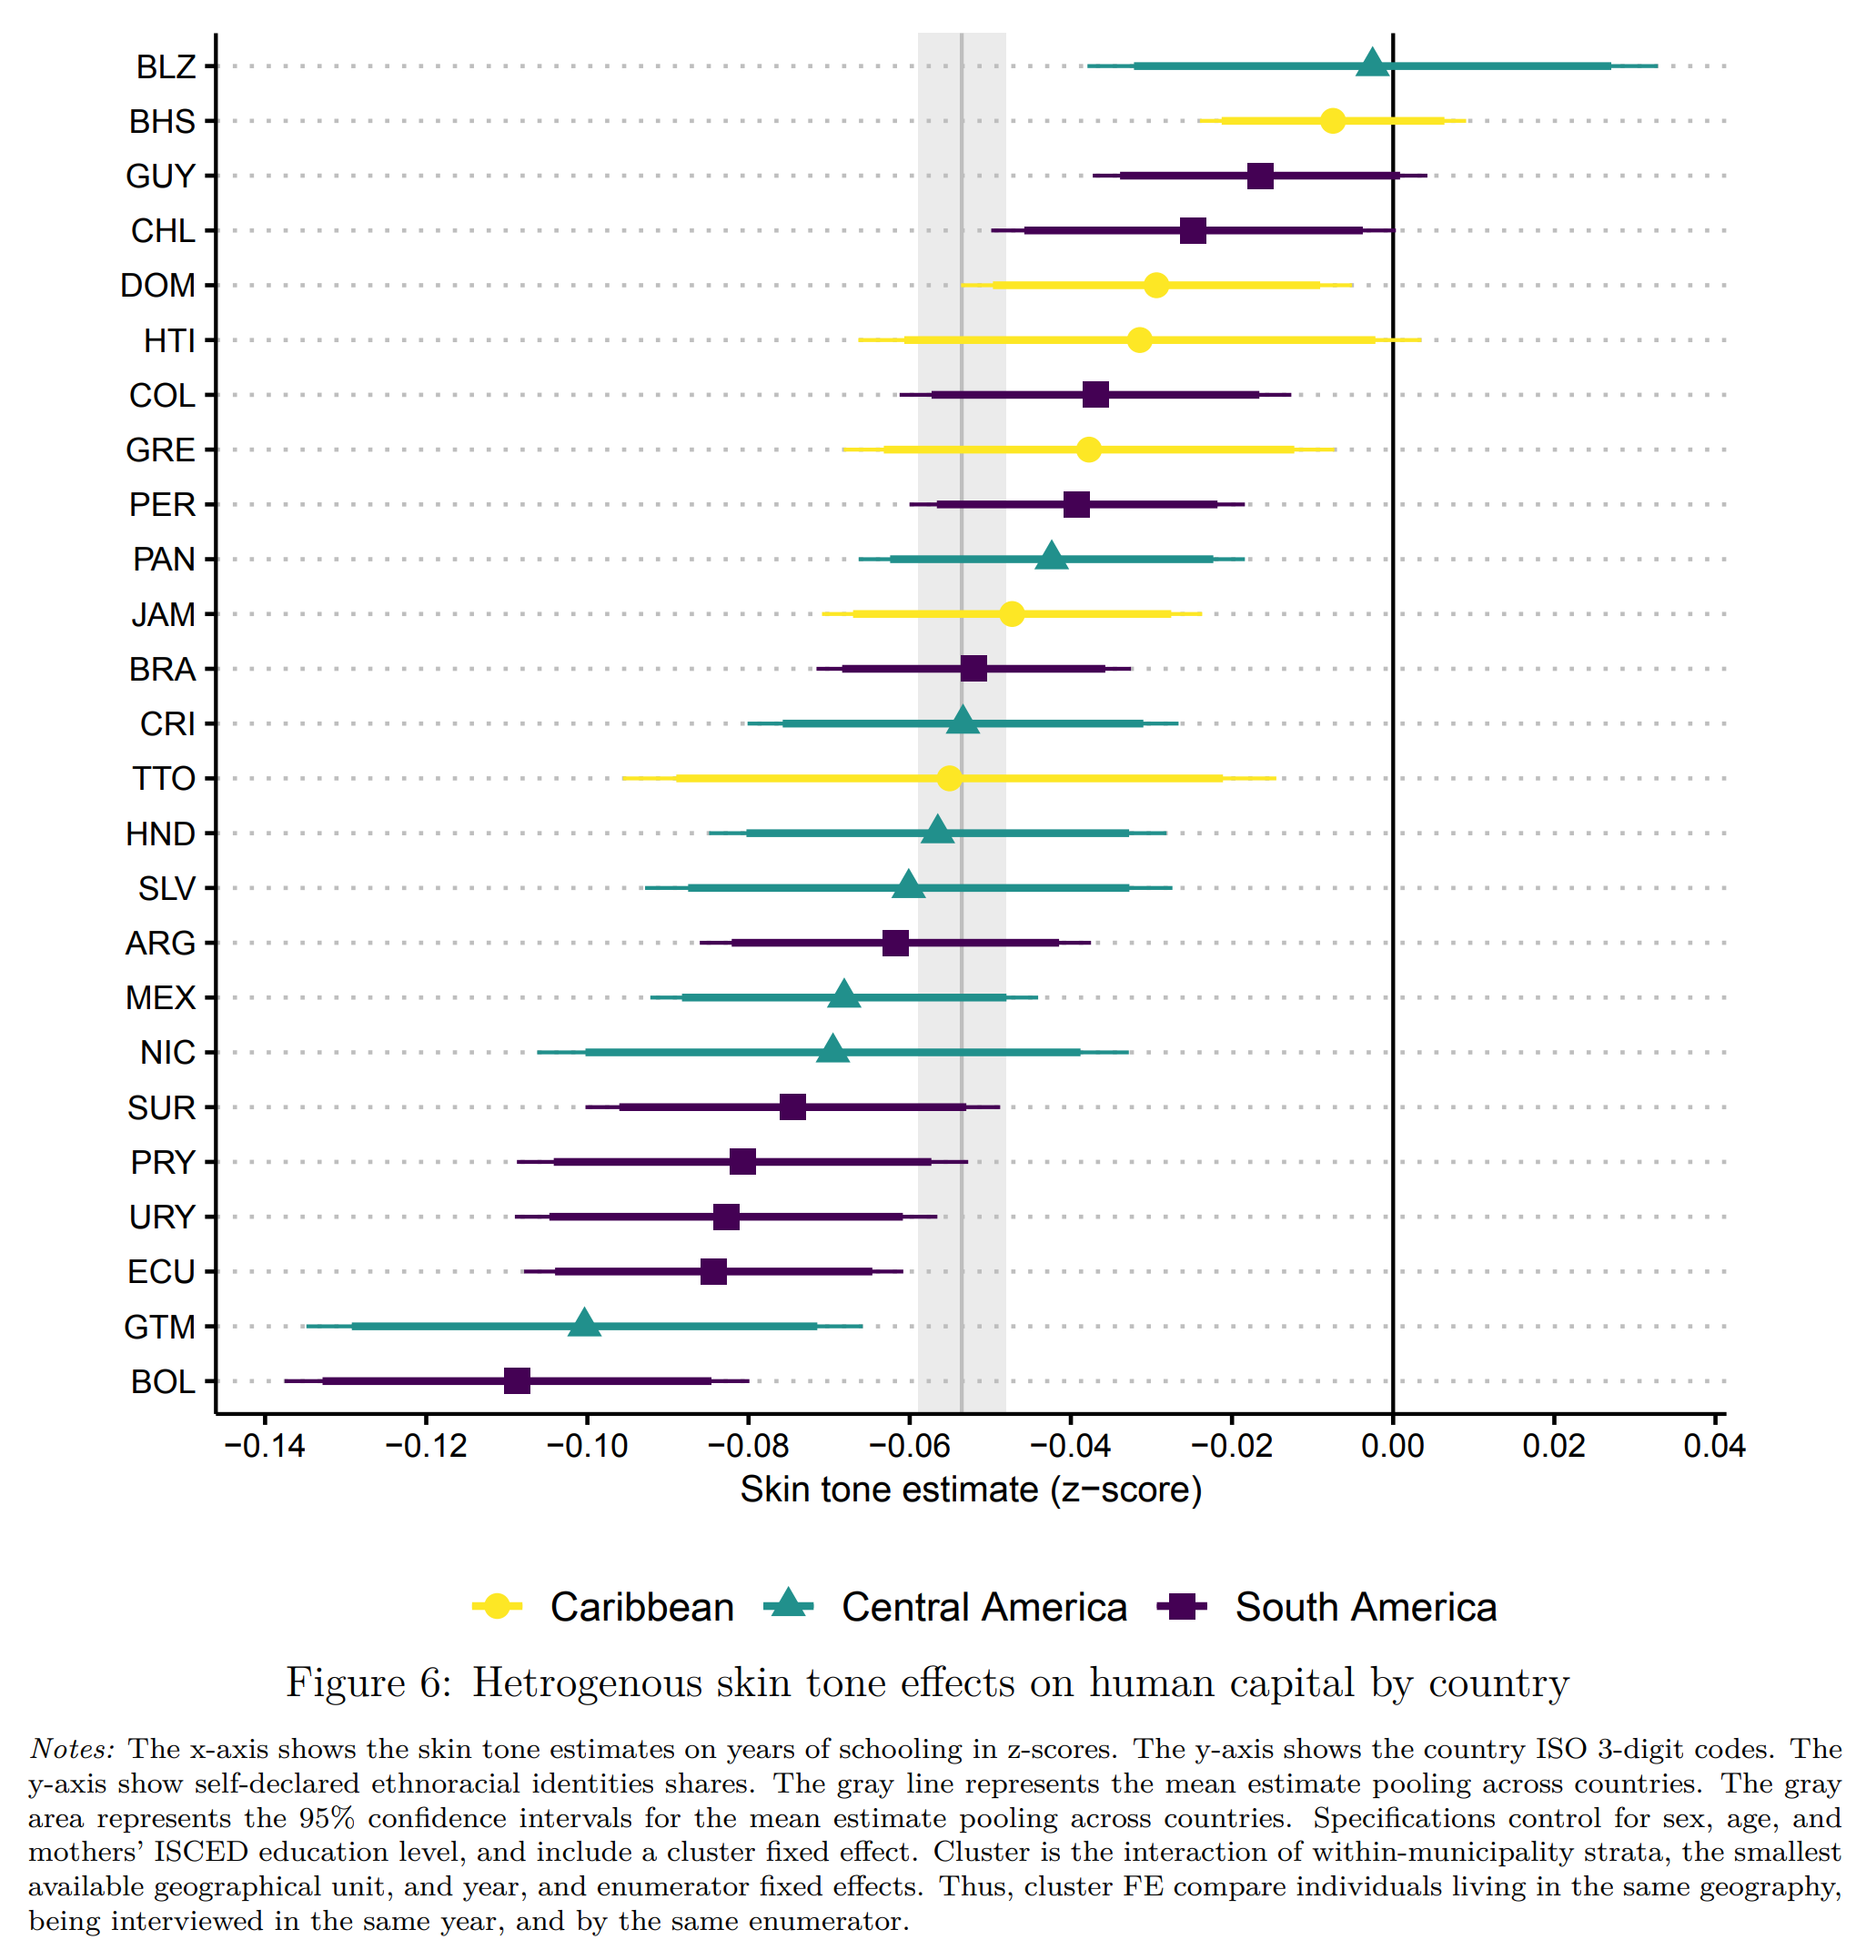
Taking their model seriously would imply that this is a kind of racism scale of the countries. Bolivia is apparently very racist and Belize is not racist. The authors single out the countries with p > 5%, which includes Haiti, a very not-racist country to be sure.
Like the other paper, there is no real attempt at causal inference here. In this paper, the words “genetic” and “ancestry” don’t even occur in the paper anywhere. This is of course quite curious given that skin color variation (especially when measured in a place not impacted by exposure) is ~100% heritable. Do we have some other evidence regarding causality? Yes. In 2019, when we published the first paper on genetic ancestry and intelligence using the PING dataset, we reviewed this literature as it existed back then:
More generally, it is not clear that colorism is actually a potent force, at least in the USA. Consider research based on sibling designs, which can distinguish between discriminatory and intergenerational effects. A number of studies in the economics literature have utilized sibling control designs in this fashion [81,82,83,84,85,86]. Unfortunately, they differ somewhat in design (e.g., raw vs. SES-controlled results for between-family regressions), and do not report standardized effect measures, so we were unable to quantitatively meta-analyze them. However, generally speaking, when family characteristics are controlled for, residual associations between racial appearance and social outcomes are small. In the words of one researcher who studied a large dataset from Brazil: “[T]he estimated coefficients are small in magnitude, implying that individual discrimination is not the primary determinant of interracial disparities. Instead, racial differences are largely explained by the family and community that one is born into” [81]. Mill and Stein [83] make statements to the same effect based on an analysis of a large dataset from the USA.
We carried out our own sibling study, also in 2019, using the NLSY 1997 dataset, which found that:
Little research has dealt with intragroup ancestry-related differences in intelligence in Black and White Americans. To help fill this gap, we examined the association between intelligence and both color and parent-reported ancestry using the NLSY97. We used a nationally-representative sample, a multidimensional measure of cognitive ability, and a sibling design. We found that African ancestry was negatively correlated with general mental ability scores among Whites (r = −0.038, N = 3603; corrected for attenuation, rc = −0.245). In contrast, the correlation between ability and parent-reported European ancestry was positive among Blacks (r = 0.137, N = 1788; rc = 0.344). Among Blacks, the correlation with darker skin color, an index of African ancestry, was negative (r = −0.112, N = 1455). These results remained with conspicuous controls. Among Blacks, both color and parent-reported European ancestry had independent effects on general cognitive ability (color: β = −0.104; ancestry: β = 0.118; N = 1445). These associations were more pronounced on g-loaded subtests, indicating a Jensen Effect for both color and ancestry (rs = 0.679 to 0.850). When we decomposed the color results for the African ancestry sample between and within families, we found an association between families, between singletons (β = −0.153; N = 814), and between full sibling pairs (β = −0.176; N = 225). However, we found no association between full siblings (β = 0.027; N = 225). Differential regression to the mean results indicated that the factors causing the mean group difference acted across the cognitive spectrum, with high-scoring African Americans no less affected than low-scoring ones. We tested for measurement invariance and found that strict factorial invariance was tenable. We then found that the weak version of Spearman’s hypothesis was tenable while the strong and contra versions were not. The results imply that the observed cognitive differences are primarily due to differences in g and that the Black-White mean difference is attributable to the same factors that cause differences within both groups. Further examination revealed comparable intraclass correlations and absolute differences for Black and White full siblings. This implied that the non-shared environmental variance components were similar in magnitude for both Blacks and Whites.
In other words, among unrelated people, skin color predicts intelligence, and has stronger effects on the more g-loaded tests. However, among full siblings, there was no such relationship. This isn’t because there is no skin color variation among siblings (African American ones in this case). This is a strong design exploiting the sparse nature of the skin color genes. Only a few genetic variations cause the main skin color differences between Europeans and Africans (and other groups). Thus, when siblings inherit DNA from their parents, they may or may not inherit the same copies at these few locations in the genome, and thus end up with a large amount of variation within the family. Ancestry, on the other hand, is omnipresent in the genome, so siblings differ very little on this. Thus, between families skin color (and their polygenic scores) are strongly correlated with ancestry (r = .45 or so inside an admixed group, and 0.90 or so with all groups together, tables 3-4), but between siblings, there is very little correlation relationship (though the slope may be the same if you had 20k+ siblings to detect it). Because of this natural experiment, sibling data can be used to test the causal predictions of colorism, as this theory predicts that skin color differences among siblings also cause various outcomes outcomes and psychological characteristics. The genetic model predicts the opposite, only a very slight relationship (in standardized terms).
Furthermore, we later tested this model again by directly comparing skin color polygenic scores and ancestry to predict intelligence (in PNC and ABCD datasets). We found that skin color polygenic scores work well alone, but they are useless when ancestry is included in the model. This is what the genetic model predicts and the opposite of what the colorism model predicts. Colorism, then, appears to be a dead-end for egalitarians. As the number of datasets with siblings keep increasing, I expect more of this kind of causally informative research to come out. Maybe in some decades the egalitarians will come to terms with reality on this matter too just as social scientists eventually did for stereotype threat, ego depletion, power posing, and other fads. This process usually takes a few decades, and no lessons are learned.
"Their causal model is a sort of conspiracy theory where the elites control the educational institutions and prevent the unprivileged from using them, thus keep social inequality going."
Some aspects of Latin America institutions are kind of a conspiracy theory in action. I once spent a couple of hours talking to the South American free market economist De Soto about property rights. The picture I took away is that a lot of land ownership in Latin America traces back to huge land grants that the King of Spain signed over in the 1500-1700s. E.g., about ten or twenty guys owned most of huge Los Angeles County in 1840. Individual land grants in Southern California might be worth a few hundred billion dollars today.
These property holdings are so large that the heirs let the servant class live on what's nominally their land so the servants can be at hand to serve them instead of having to commute over the horizon. The servant class has developed informal rights to their plots of land that everybody recognizes are transmitted to their heirs. So it's not a totally abusive system. But ... the landowning class is averse to allowing their workers to have formal legal rights to their customary land, which they could then mortgage to finance their own businesses.
In other words, the lower class might have customary rights to $100,000 worth of property, but they can't move up to the middle class by borrowing $50,000 to start a business by risking it because they don't have formal legal title to their house.
I enjoyed the 'dry' commentary.