
Odd sibling RDR results: is the problem measurement error in IBD?
Is it measurement error (again)?

You've probably seen the recent Scott Alexander discussion about heritability, with comments from key players and commentators in the field, but if not:
I want to talk about a potential problem with the sibling regression method and its results (Markel et al 2025).The method works using the fact that (full) siblings same on average 50% of their DNA from their parents, but only on average; some are more sibling than others:
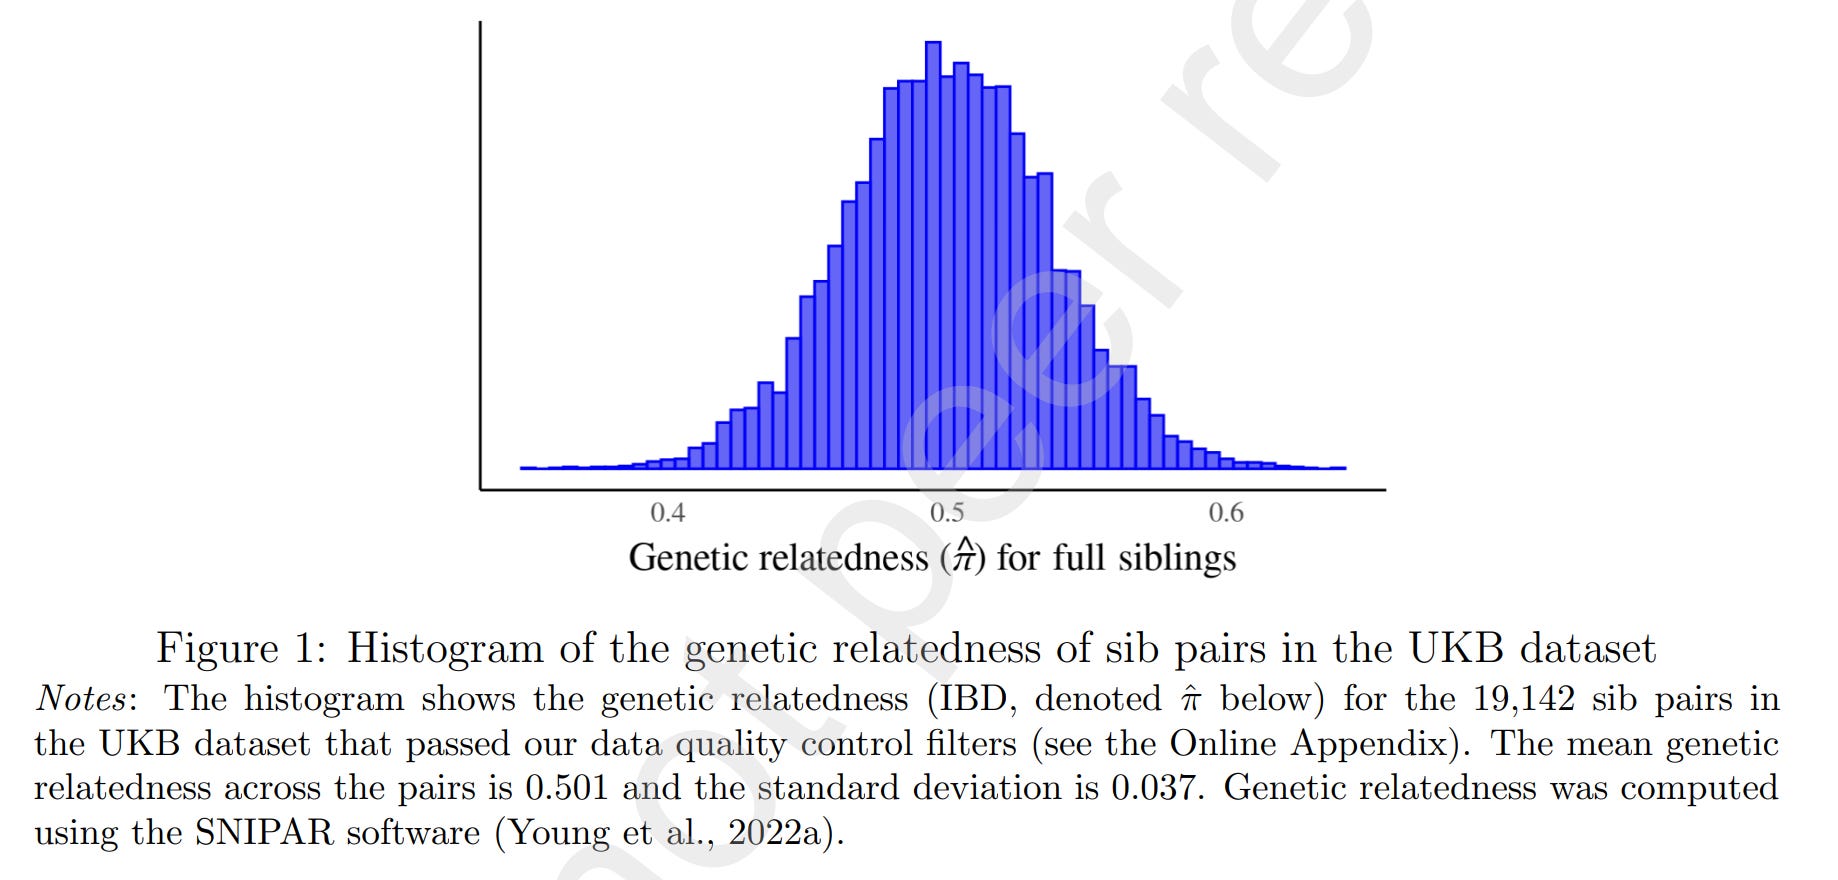
Using this natural variation in sibling relatedness, one can determine the classical twin design variance components: A = (additive) heritability = h², C = common/shared family environment, E = everything else. They show this example of the regression:

(Why did they forget to remove one half-sibling on the left side?)
The method is intuitive enough: the outcome variable is Y1*Y2, where Y's are the z-scaled phenotype of interest (for continuous variables) for each sibling. Thus, if siblings both have high values, say 2, the product will be large (4). This is also true if siblings both have low values (i.e., -2 * -2 = 4). If siblings are dissimilar, say, one is tall and one is short (relative to age and sex norms), the product will become negative (2 * -2 = -4). Siblings with relatively small differences will produce intermediate values around 0. For whatever mathematical reasons, this method of estimation is slightly better than the other specifications they tried. Here's their main results:

Or in visual format:

It is immediately apparent that despite having in some cases 80k sibling pairs, there are issues. First, the variance components cannot be negative yet several of them are estimated at negative values (they didn't constrain them). Second, symmetric standard errors are given, but the variance components cannot exit the 0-1 range, which the error bars often do. Third, the results are not internally consistent. In a funny coincidence, intelligence is the most heritable phenotype (75%), more than height (64%). Of course, given the confidence intervals, it is still possible height is more heritable estimated using this method. Still, we also see that educational attainment (EA) has a non-significant h² estimate of 8%. It is not possible for intelligence to be this heritable and EA this low because the traits are so strongly related, and genetically correlated to the point where one can use one as a proxy for the other.
The authors are aware of these worries, and the main culprit they look at is assortative mating. They found a way to adjust the results for this:

To adjust for assortative mating, one must choose an assumption about the genetic correlation between mates. This value cannot be directly observed without perfect polygenic scores (which we don't have), so it must be estimated one way or another. Curiously, a plausible value for intelligence might be 0.4, but looking at their results, this suggests the h² is from 107% to 149%. And for EA, even granting a 0.5 parental genetic correlation, the h² estimate is still only 15% and still non-significant. Very odd. Most of the other phenotypes don't have particularly strong assortative mating, so we don't have to adjust too much, but even doing so, it doesn't get better. For some phenotypes, it gets worse as the estimate was originally negative and just becomes even more negative and more wrong.
My guess for part of what is wrong is that the estimates of genetic overlap between siblings is a noisy measure. Strangely, this is not discussed by Scott Alexander or in the paper itself. The paper notes the method used but says nothing about reliability or accuracy:

So is there reason to suspect error in this variable? Well, yes. I have used these kinds of IBD estimators in various datasets with various family relations, and they often show substantial disagreement. Given that the RDR relies upon very precisely estimating tiny differences around 0.50, even a small amount of error is a big problem (e.g., getting it 2%point wrong would be very bad, while this error doesn't matter for regular uses of IBD). So I looked around for any published research comparing the methods, and I found a study by Kelmemi 2015, which shows these correlations among IBD estimators:

The methods agreed reasonable well, with a typical correlation of about 0.90 or so. In the RDR study, they used the newer snipar tool. I don't know how this correlates with other methods. The snipar paper gives some results suggesting that snipar is more accurate than King (see section "IBD inference"), but it would be nice to see a validation somehow (e.g. same samples genotyped more than once and IBD estimated across datasets). Measurement error in IBD I think given this method would tend to inflate C and reduce A, which is also what the results suggest. The results also in general have very high values for E, which is suspicious and also suggests substantial measurement error in the outcome variable. Since the outcome variable is a product, it will be doubly affected by measurement error. The paper makes no mention of this problem either.
Anyway, this is just my guess about what is wrong. This paper still made good progress. I hope the authors try to address the measurement unreliability issues. Because the method is not a typical bivariate correlation, the effect of measurement error can result in substantial biases. They should ideally do some simulations to see how their results are affected by various levels of measurement error in either or both variables.
>and genetically correlated to the point where one can use one as a proxy for the other.
even if underlying genetics is same, phenotypically they are different. We already knew even before any genomic studies that rich parents could buy education for their dull children, but not IQ. EA is IQ passed thru non-genetic filters "add noise" and "average by sliding window".
>(Why did they forget to remove one half-sibling on the left side?)
hehe