On the East Asian > White advantage on scholastic tests

It's well known that East Asians (Chinese, Japanese, Korean; CJKs) tend to outperform Europeans ('Whites') on cognitive tests. If we look at the standard IQ tests, the advantage is about 5 points, give or take. This is found both between and within countries, as summarized Richard Lynn in his Race differences in intelligence book (obligatory reading on the topic!). However, if we look at the college admission tests, the advantage is larger. For instance, on the SAT 2017:

I.e., the Asian advantage is 4 points on verbal and 59 on math. The white standard deviation is about 103 (table in this report), so Asians have an advantage of 4/103=0.04 d and 59/103=0.57 d. The overall advantage is complicated to calculate but will be a little more than the average of these values (0.31), so about 0.35 d, or 5.25 IQ equivalent points. This value includes some lower scoring Asian groups and some non-native speakers (I think), so the native English speaking CJK > White advantage is larger. One can see this in Fuerst's meta-analysis:
Fuerst, J. (2014). Ethnic/race differences in aptitude by generation in the United States: An exploratory meta-analysis. Open Differential Psychology.

I.e. CJK reaches 0.40 to 0.46, but one has to adjust this upwards a bit, so close to 0.50 d, or 7.5 IQ equivalents. A bit too large.
Test prepping
However, it is also known that Asians test prep a lot harder than Europeans. A neat study on this is:
Byun, S. Y., & Park, H. (2012). The academic success of East Asian American youth: The role of shadow education. Sociology of Education, 85(1), 40-60.
See also: Hsin, A., & Xie, Y. (2014). Explaining Asian Americans’ academic advantage over whites. Proceedings of the National Academy of Sciences, 111(23), 8416-8421.

So, Asians take a lot more prepping, and also gain more from it. At the group level, an adjustment can then be made to the scores using the values in the table. The adjustment would shrink the White-Asian gap by about 19 points out of the observed ~60 (on the 1600 scale).
Test prepping and Jensen effects
As a corollary, we can also expect this kind of test prepping to disturb the g factor's relatedness to the group differences. Is there evidence for this? Yes:
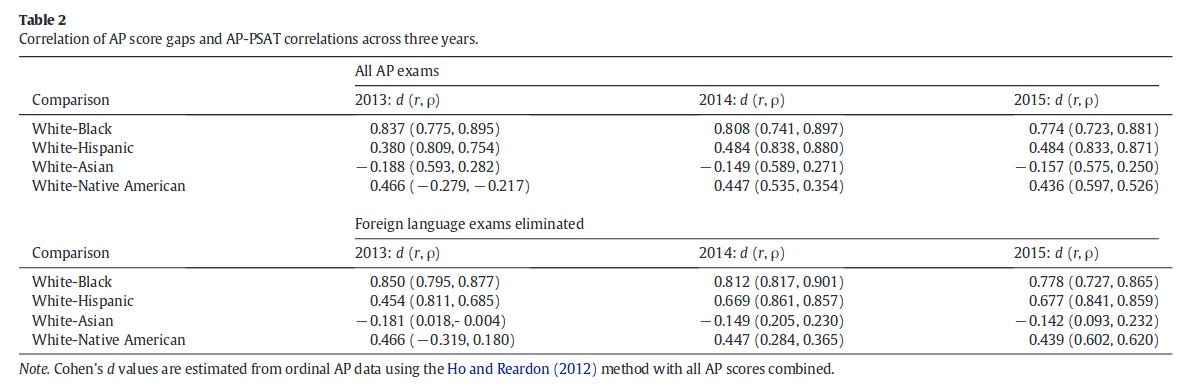
Warne, R. T. (2016). Testing Spearman's hypothesis with advanced placement examination data. Intelligence, 57, 87-95.
The nature, source, and meaning of average group score differences between demographic groups on cognitive tests has been a source of controversy for decades. One possible explanation is “Spearman's hypothesis,” which states that the magnitude of score differences across demographic groups is a direct function of how strongly the test measures g. To test this hypothesis, Jensen (1985, 1998) developed the method of correlated vectors. In this study I used the method of correlated vectors to examine the relationship between racial/ethnic group differences of Advanced Placement (AP) exam scores and the correlation between those AP exam scores and a test of general cognitive ability, the PSAT. Results are consistent with Spearman's hypothesis for White-Black and White-Hispanic comparisons, but not for White-Asian comparisons. Comparisons of White examinees and Native Americans are inconclusive. This study shows that academic achievement tests can be used to test Spearman's hypothesis. Additionally, Spearman's hypothesis is not a unique characteristic of White-Black differences in cognitive test scores, but it may not universal either.