
Penalization for small n problems: case study of Steam games
Also correction for prior post

For many kinds of ranking websites, users are naturally going to be interested in the leaderboard or top list, the best of the best. This is the same thing for movies, computer games, board games, movies, and so on. It seems every such ranking website has chosen its own approach concerning how to deal with entities with little data. The most simplest method is just to exclude any entities without a certain number of votes from the top list. This essentially discard their data. This approach is used by e.g. IMDB for their top 250 list (well, maybe, they deleted their public listing of methods). Other sites regress their entities towards some preset value. Case in point, SteamDB has Steam games, and they explained their pseudo-Bayesian method on their page here. Basically they move rankings towards the midrange value of 0.5 based on some log function of the number of votes. Actually, the average game does not have a rating of 0.5 (the scale is 0-1, recommend or not recommend), so their prior is wrong. Fortunately, the Steam API provides the entire history of ratings for a given game, so it is possible to test which method is more accurate for predicting the long term rating. To do this I (that is, Claude) scraped the complete voting history of ~2500 games, totaling ~35 M votes. The large majority of these were randomly selected from games with at least 5 k ratings. Based on my prior results, it was assumed that the rating is mostly stable at that point, so we can consider it the target value to be estimated from smaller samples of early votes.
The methods we consider here are:
Raw score: positive / total. Unbiased but noisy at small n.
SteamDB formula:
score - (score - 0.5) * 2^(-log10(n + 1)). Shrinks toward 50% with an ad hoc decay function.Wilson lower bound: Lower end of a 95% confidence interval for the proportion. Conservative — designed to answer “what’s the worst this game plausibly is?”
Laplace smoothing:
(positive + 1) / (n + 2). Bayesian posterior mean with a uniform Beta(1,1) prior. Shrinks toward 50%.Empirical Bayes:
(positive + a) / (n + a + b)where the Beta(a, b) prior is estimated from the observed distribution of game ratings via method of moments. Shrinks toward the actual mean rating (~85%) with data-calibrated strength.
Results by method and game ranking:
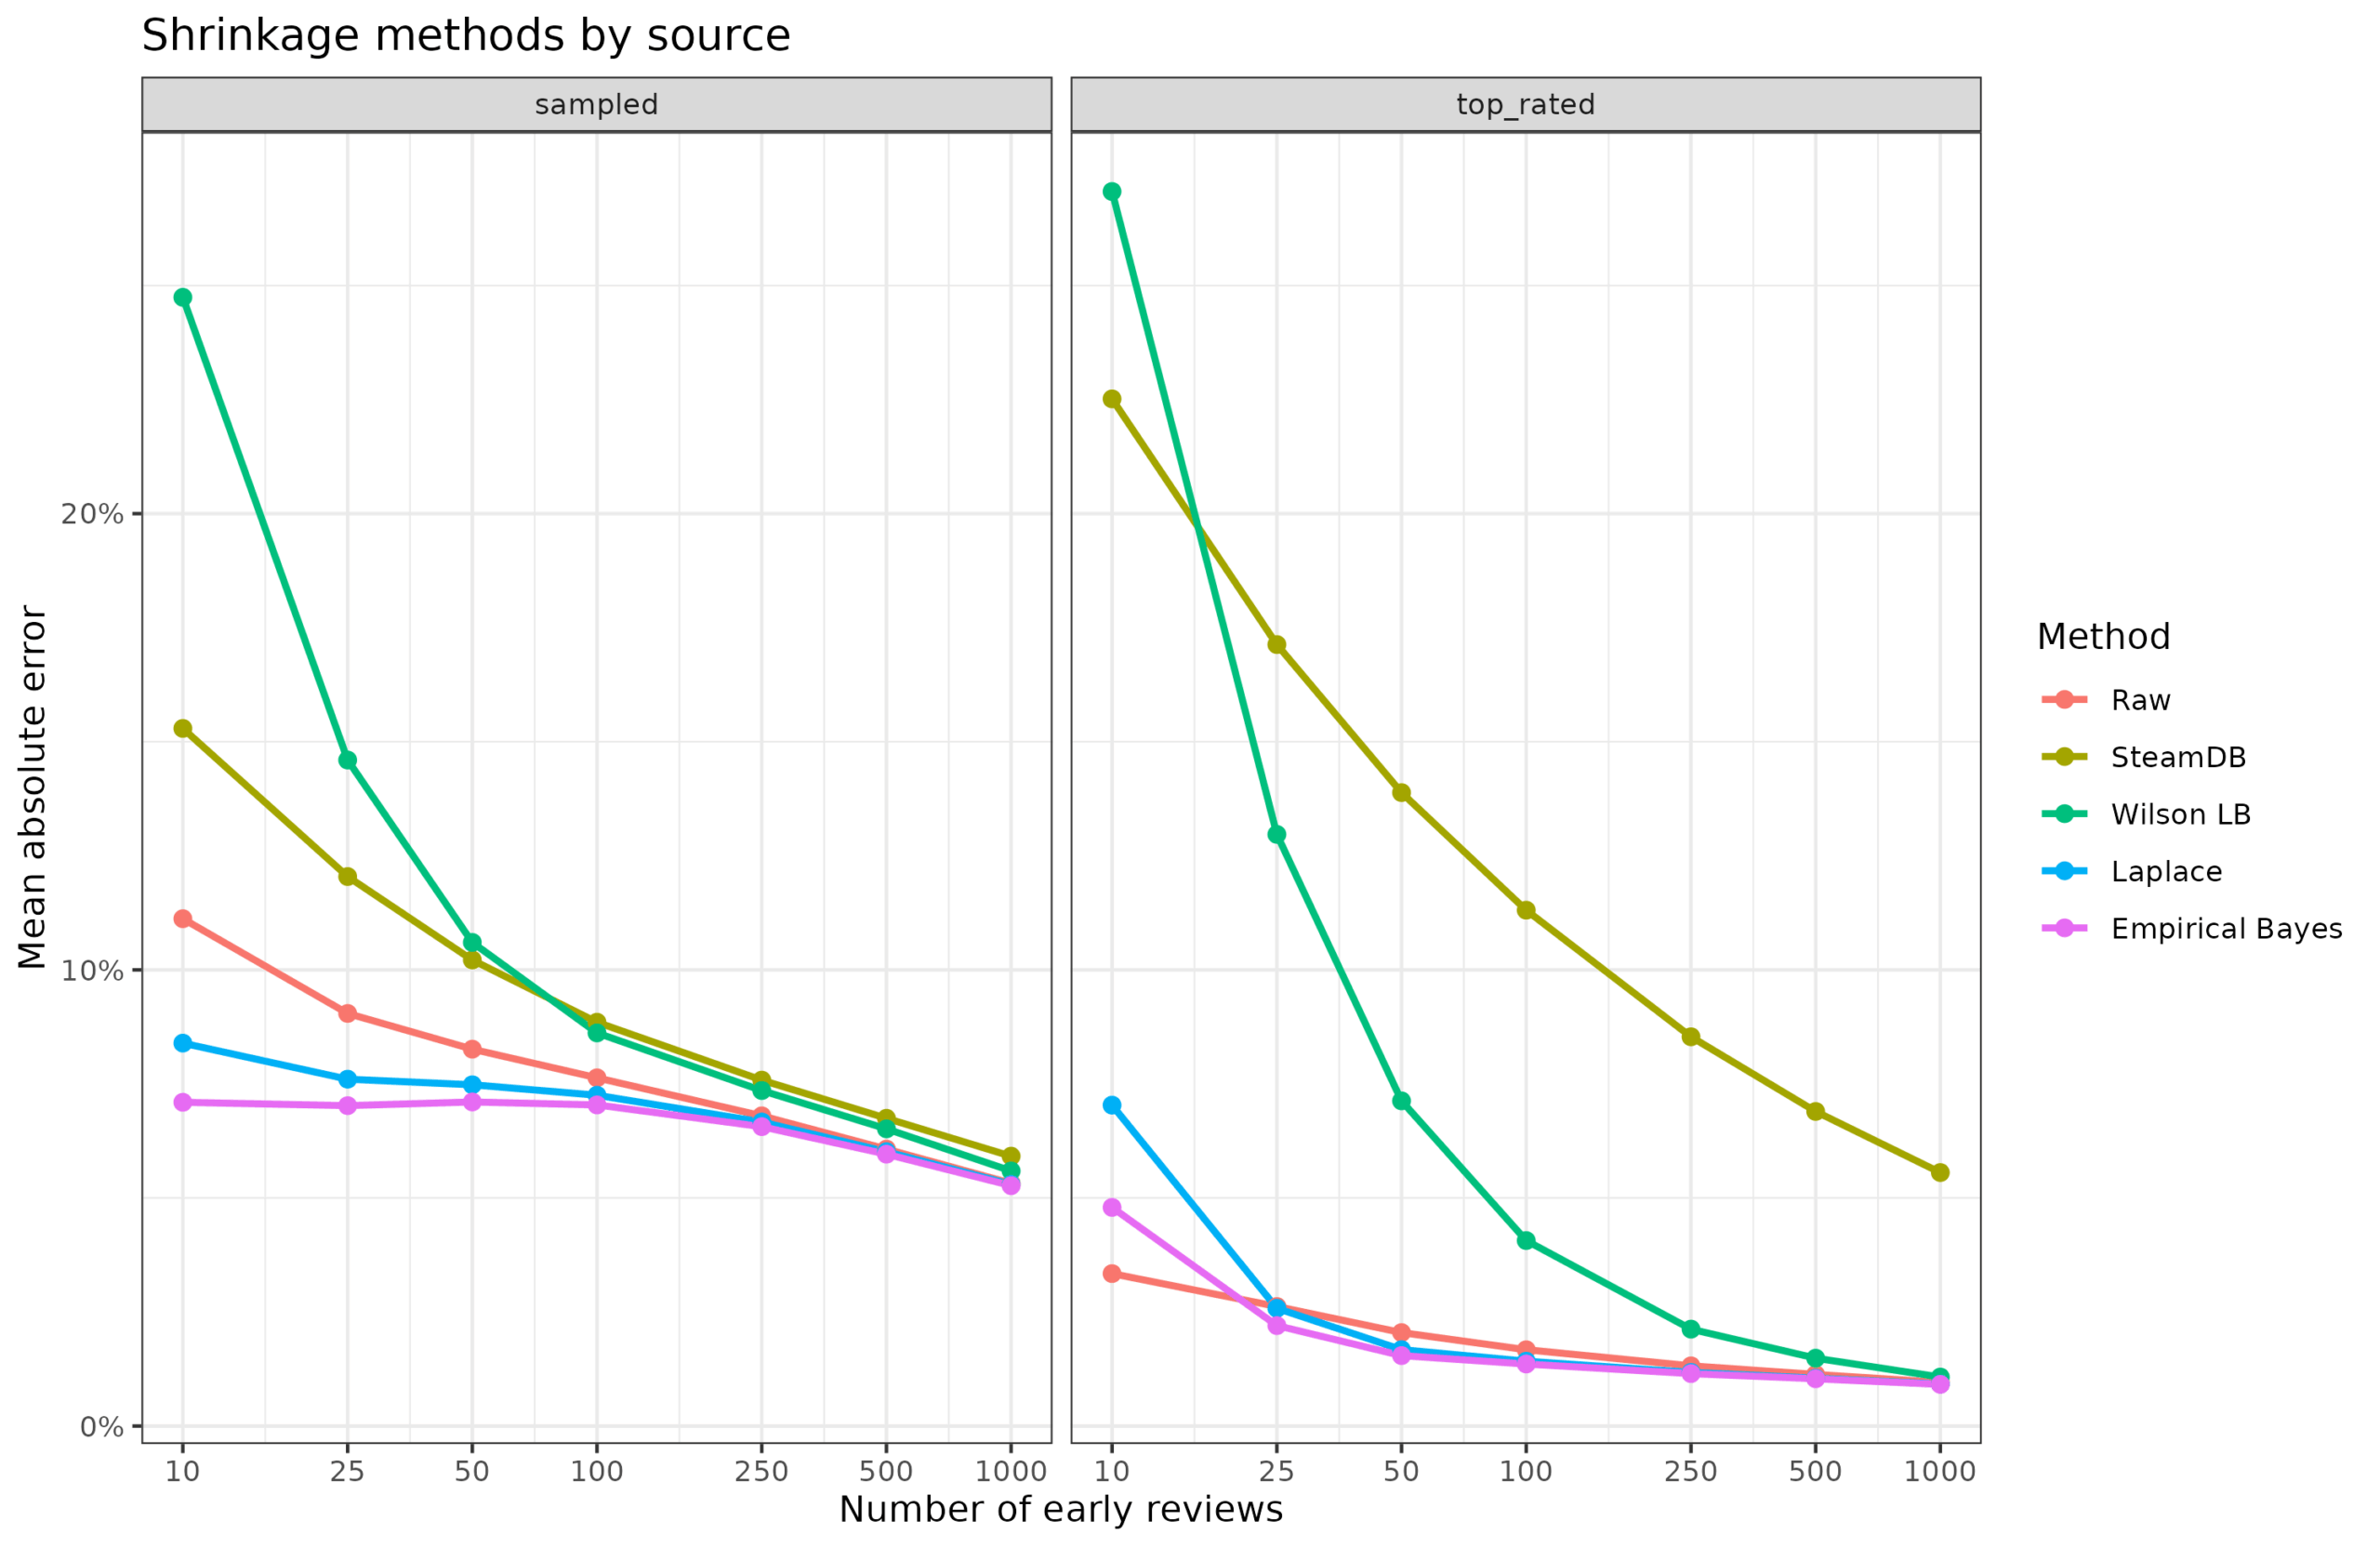
Lower error is better, so we see that for the representative sample of games (2.2k games), the theoretically superior empirical Bayes is in fact also the best method, and the worst method is using the lower confidence interval. The high error of the lower CI is not surprising because it is not actually a shrinkage estimator at all, though it can sort of be used as a penalization method. All the methods converge after about 1k reviews are in anyway. For the top ranked games, both the Bayesian methods (informative and uninformative priors) and the raw mean are about the same except for small review counts. For the top ranked games, the situation is artificially easy because they were selected for analysis because of their final high ranking, so not much shrinkage is ever needed, and the prior can be very accurate anyway.
We can also look for bias in the estimates, that is, degree to which they are systematically too positive or too negative:
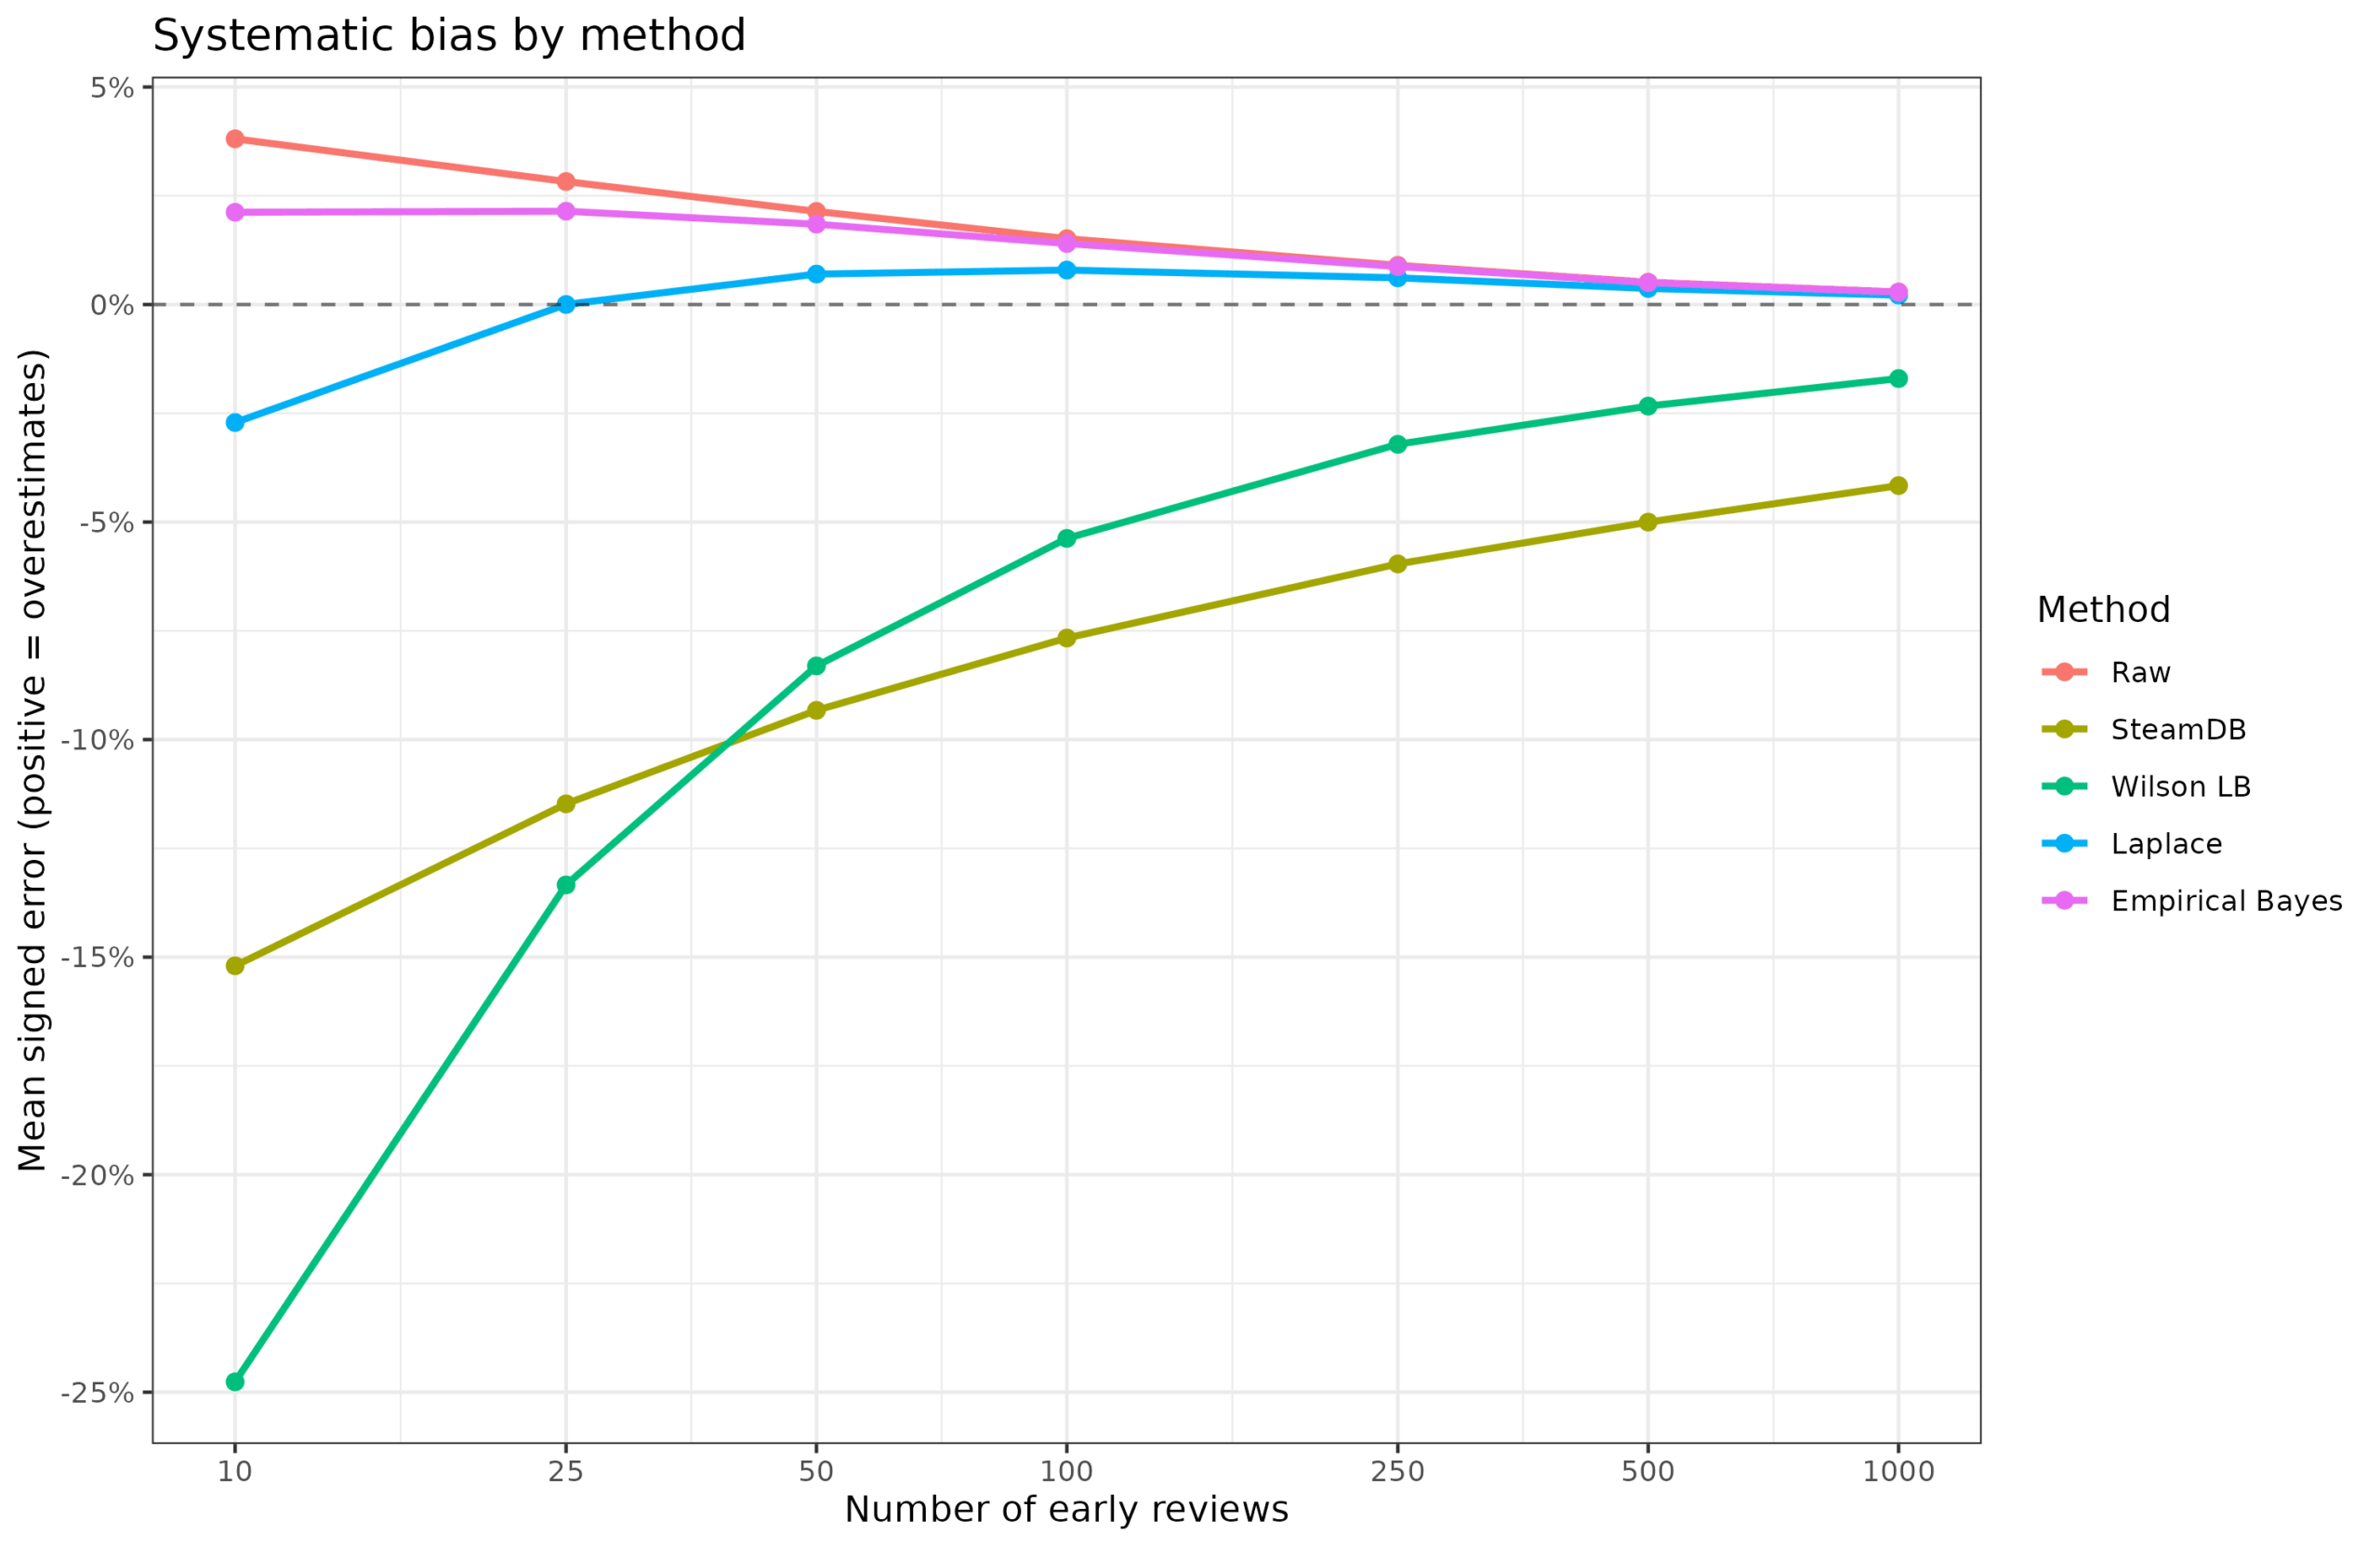
The raw mean cannot actually be biased as a method, but it appears biased because earlier votes for a game are slightly more positive than later reviews. Specifically, the first 10 ratings are 4%points more positive than the final average after at least 5k ratings, on average across the games. The two Bayesian methods show slightly smaller biases. The Laplace version has a negative bias because it uses a wrong prior (like the SteamDB formula). The two last methods are just generally bad and should not be used for this purpose. The SteamDB method is the worst because it still shows a significant negative bias even after 1000 ratings, which is to say, it penalizes smaller games. Literally doing nothing would have been better. The site might as well just limit their top list to games with at least 1000 votes and this would be better.
Some randomly chosen games for illustrative purposes:
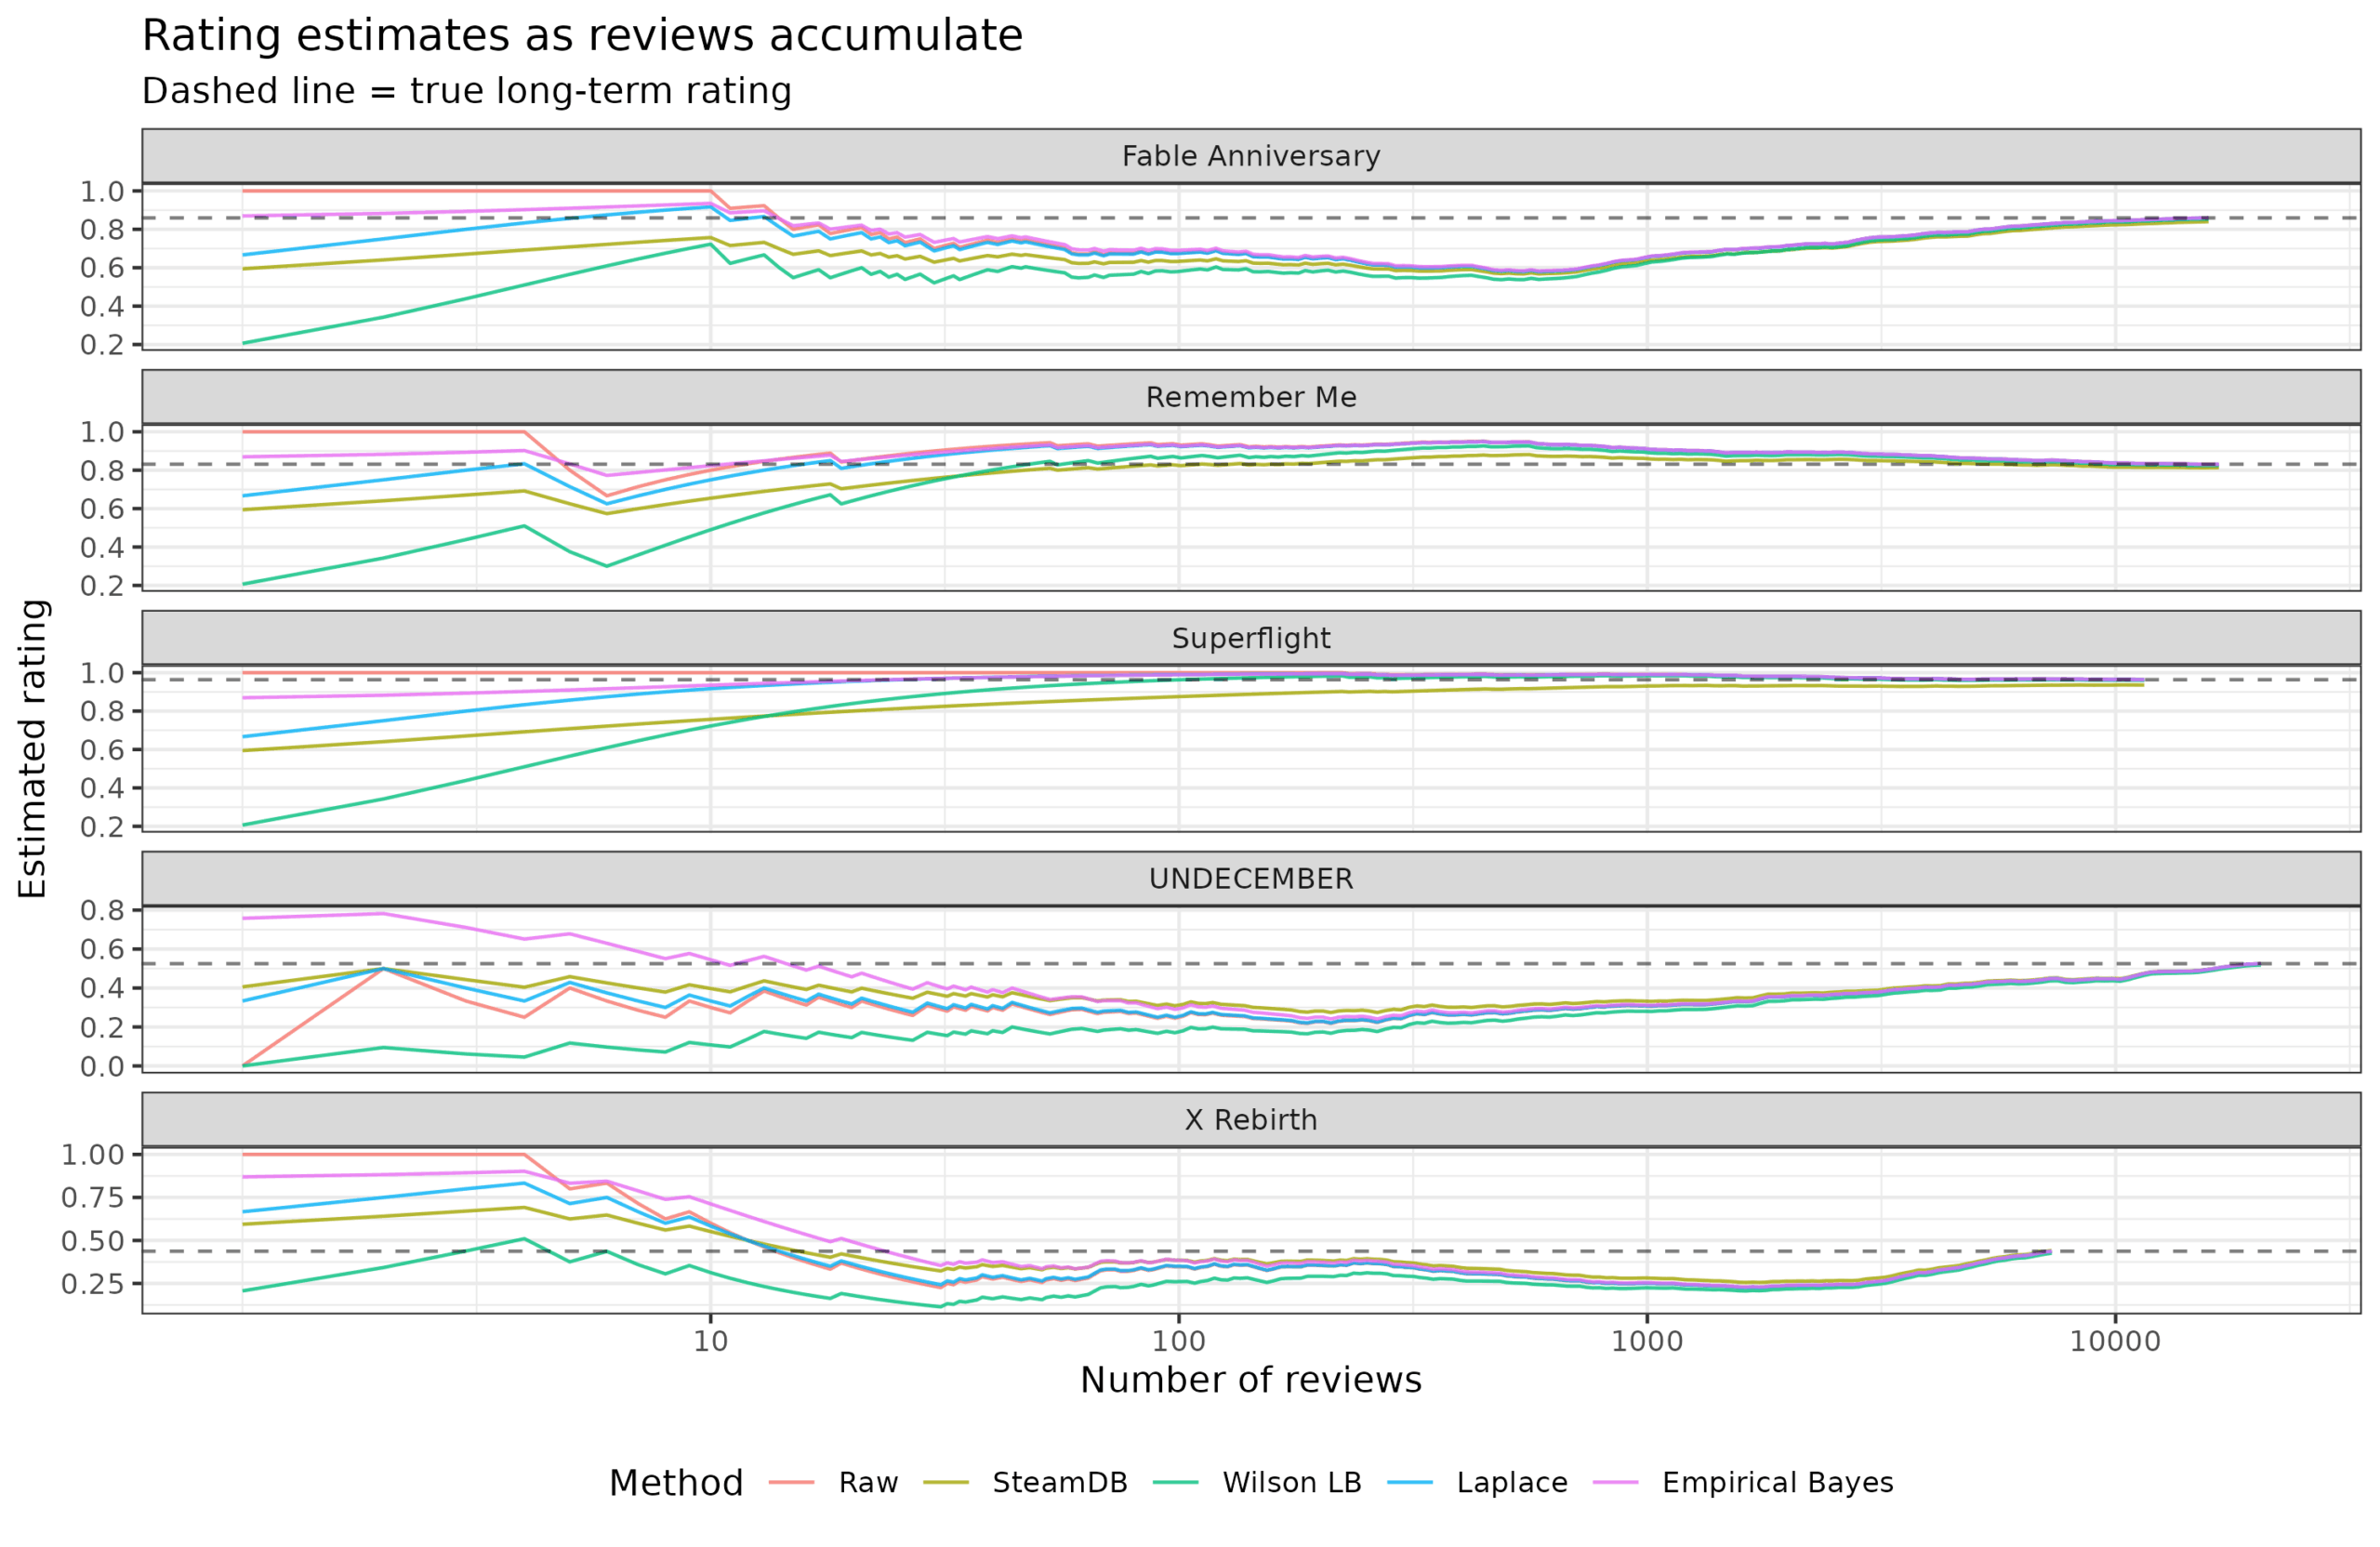
Here we can see the insider/friend voting for 3 games that have uniformly positive votes (red line being at the top) for a while until they end up with shit averages after unrelated people start rating them. We also see another issue with these data: games may simply improve over time, giving rise to an apparent reversal effect. Assuming that games have a kind of stable long term, fixed rating is not really correct, but a statistical fantasy. Nevertheless, the Bayesian method with the informative prior is the best if one wants to be nerdy about it (and I do), but these sites might as well just use a hardcoded minimum of X ratings to considered for inclusion in their top lists.
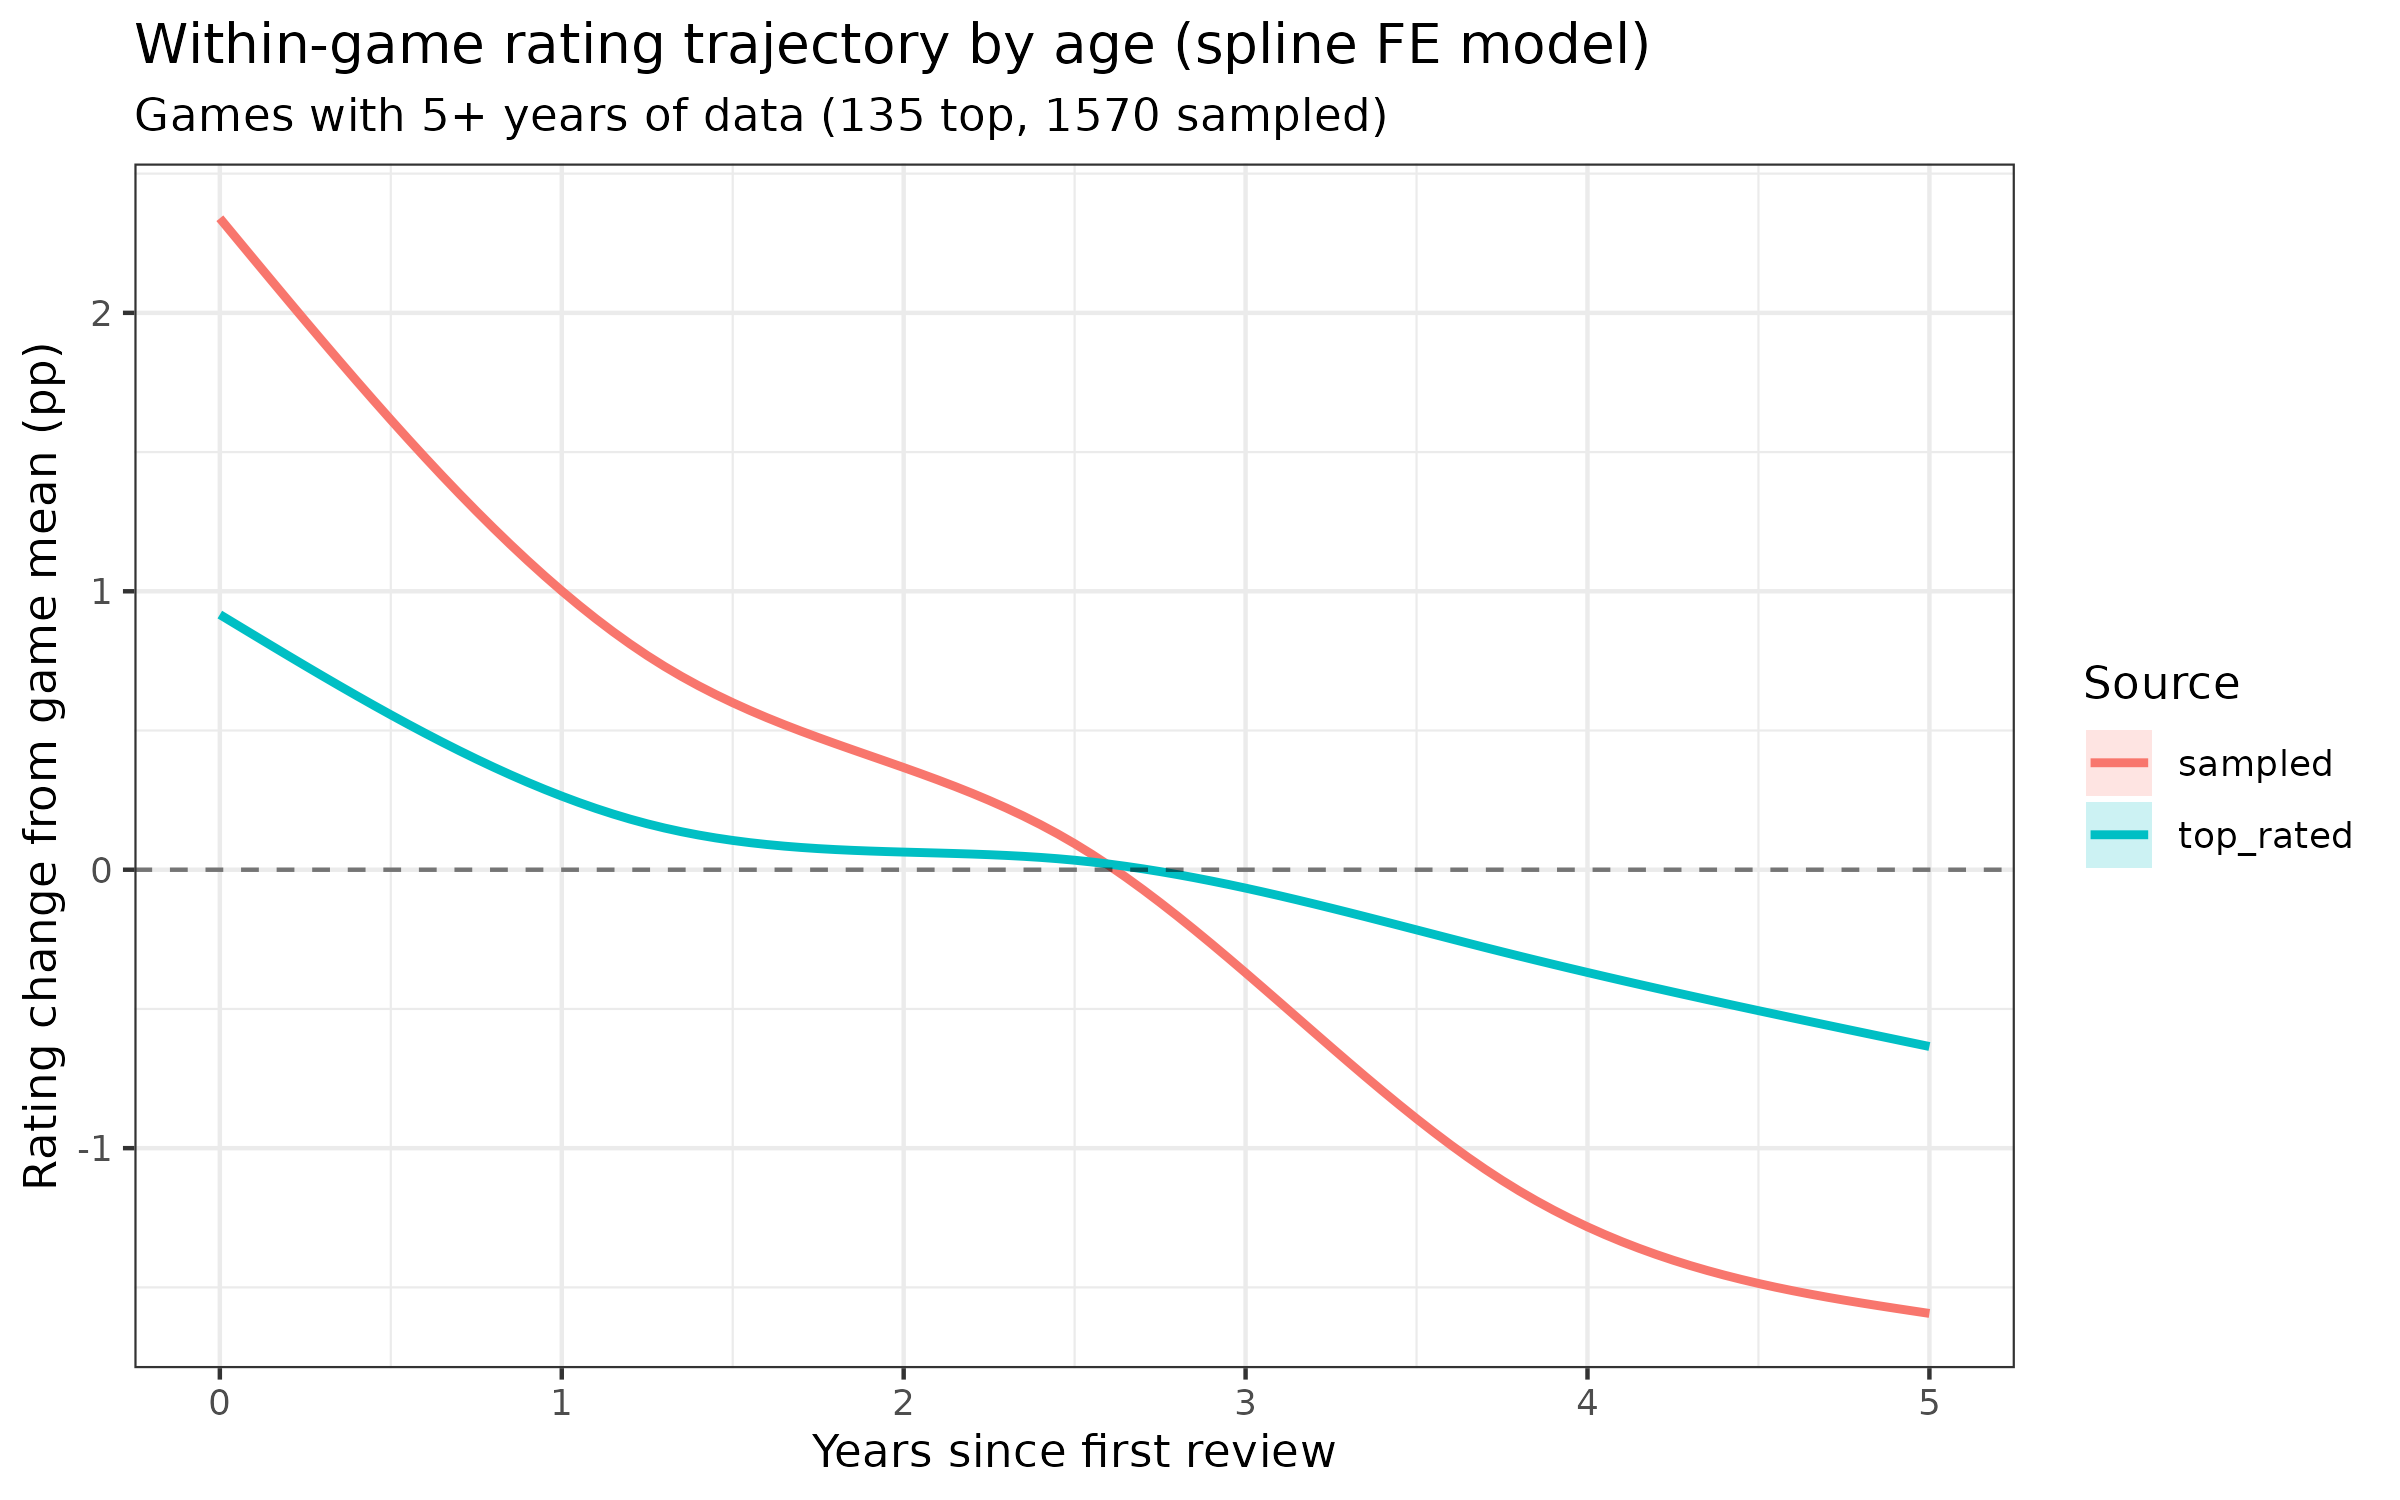
Mea culpa
Speaking of the above decline effect, a few days ago I wrote a blogpost about there being no detectable recency effect in Steam game ratings. This was wrong because of data error. The issue is that Steam’s API returns newest reviews first, and I limited games to 50k reviews, which means that I had the latest 50k. For a subset of games, these reviews did not include the first ratings because the game had more than 50k ratings, and thus the votes were being incorrectly encoded as being e.g. number 1, 2, 3, whereas really they were perhaps number 99991, 99992, 99992 etc. Numerically, though, most of the data was correct and the decline effect is relatively weak. It’s about 4%points for a typical game across 5 years:
Or comparing earlier to later ratings:
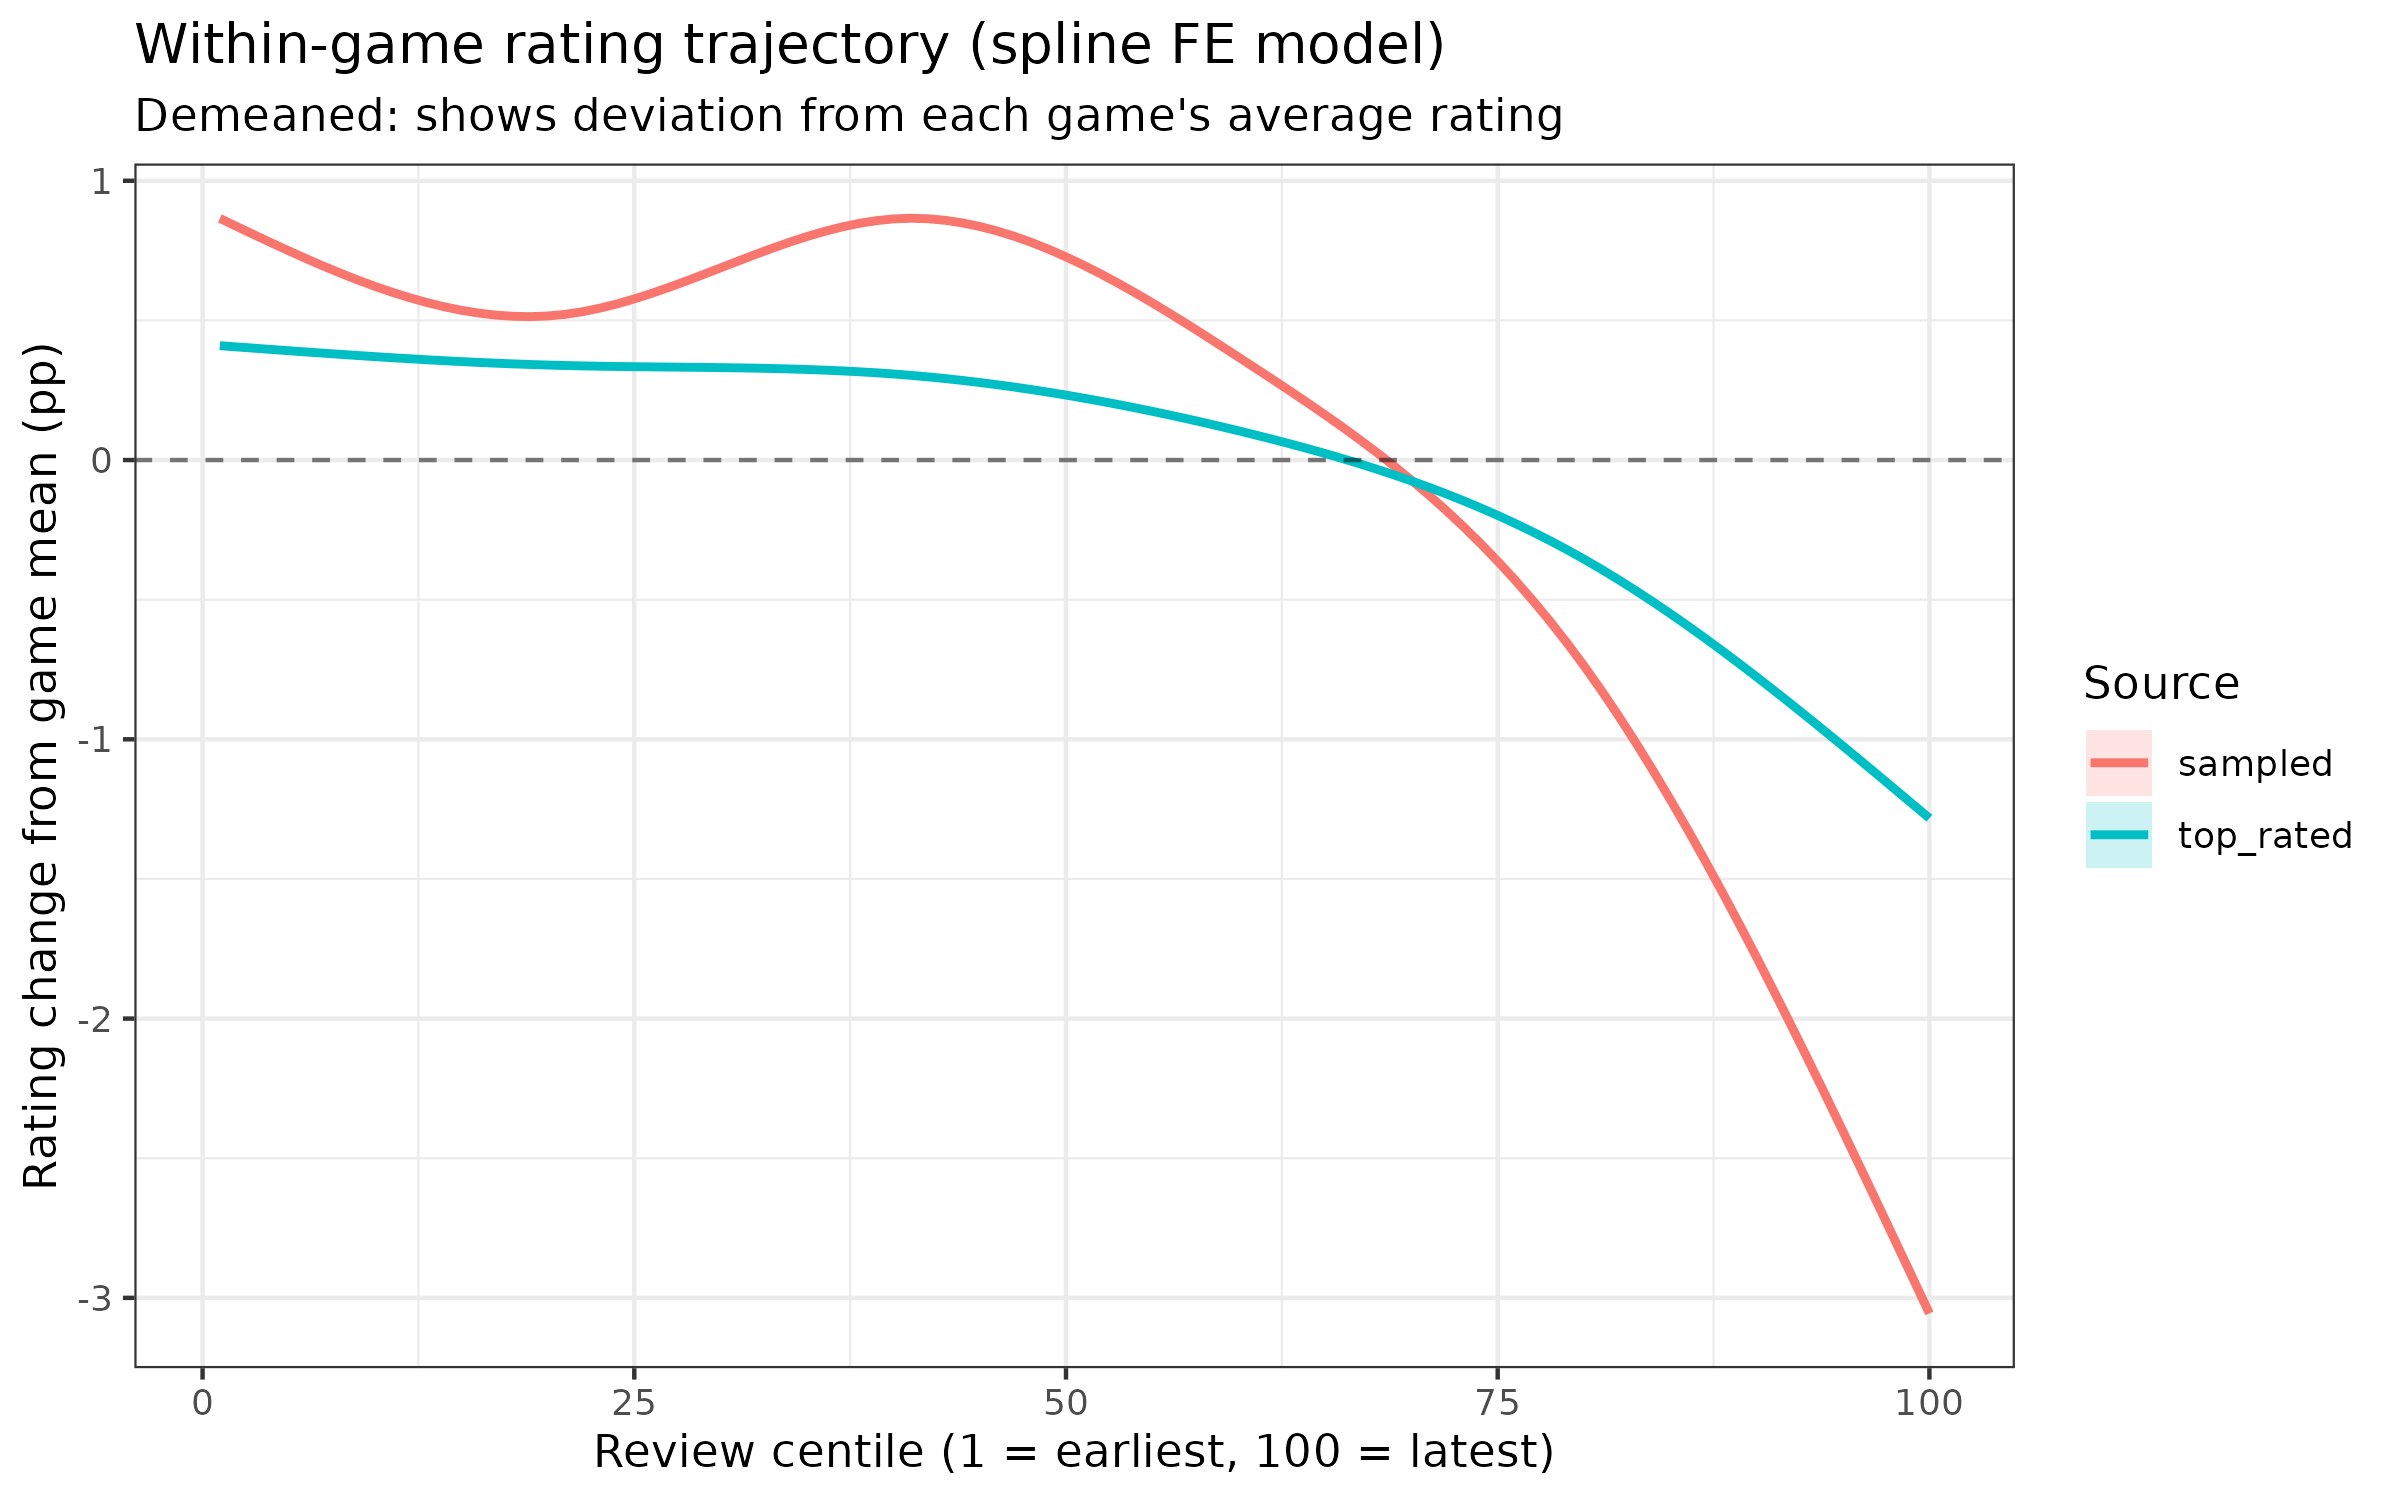
0th centile is the first rating and 100th is the last. This across the rating history, the average game declines about 4%points on a 0-100% scale, which is fairly small. Much smaller than the IMDB recency effect.