
Personal productivity in 2025 in numbers
Measuring my own 'job performance'.

Ah yes, it’s time to get back to work after the holidays. So let’s start with the yearly recaps. First off is my own productivity numbers (which is what you support by subscribing on Substack/X), and next up I will do the mini book reviews of the books I read in 2025. Prior years reviews: 2024, 2023 (forgot?), 2022, 2021, 2020.
Measuring job performance is a big and old topic in industrial and organizational psychology (called I-O Psychology). For some jobs, it is relatively easy to measure job performance. Historical cases include number of customers checked out per hour (in supermarkets), sales or revenue made (for sales roles, especially phone spammers), cases resolved (for case workers e.g. in government jobs). But even for these we see some potential issues. Perhaps some employee is making a lot of sells by lying to the customers, thus opening the company to later claims of fraud or improper behavior. This could end up outweighing the revenue from the sales. As such, one can modify the sales role metric to be net revenue/profit after subtracting any costs or lost revenues to cancellations or complaints. For case workers, one can subtract a score based on cases overturned on appeal.
For many other jobs, it is much more difficult. Take computer programmers. Sure, we have lines of code per hour as a metric of productivity. However, this can also fail if the code is poor quality, e.g. involving a lot of duplicated blocks that are hard to maintain or debug. Pascal’s famous quote comes to mind: “I would have written a shorter letter [code], but I did not have the time.”. Still, more code per hour is still probably better than nothing even if it can also be easily gamed, especially with AIs. But how does one estimate job performance for, say, clinical psychologists? It will probably have to come down to patient satisfaction, something one can also use for doctors (again, include a metric for malpractice complaints). For many roles in companies, there is no obvious metrics to use and no customer satisfactions either (cog in the machine). In these cases, the traditional choice was to have the manager rate their underlings performance. This is a quite flawed metric, both low ‘reliability’ (agreement with other supervisors) and potentially high bias. Nevertheless, it is better than nothing. Maybe.
So for someone with ‘my job’ which involves doing research and writing about research, how do we measure productivity? The most obvious is just to count the number of research publications, blogposts and so on. However, these metrics are easily gamed with posting low quality material. For this reason, I usually ask my readers what they think about the quality of the writing, and the satisfaction level is usually fairly high (phew!). In academic evaluations, often different citation metrics are tried, with most people liking the H index. It balances the number of publications with their apparent usefulness to science by looking at whether the work is cited or not. It is thus harder to game than just the mere number of publications, or the total citation count. The latter is particularly problematic in the current environment of large-scale collaborations that publish papers with 100+ authors. Some have thus produced that we use fractional citations, that is, if there are 5 authors on a paper, and it gets 100 citations, then you get 100/5=20 citations.
Anyway, with that said about the caveats of measuring job performance using any particular metric (Goodhart’s law: “When a measure becomes a target, it ceases to be a good measure”), let’s look at the year in review:
Blogposts
Blog readership and subscribers
Scientific publications and citations
Books read (not productivity in itself, but it supplies the knowledge and inspiration needed to write)
X/Twitter followers
Blogposts
Substack doesn’t seem to provide post counts per year or month. However, it is possible to count them using the archive (or easier with the Substack API). It looks like this:
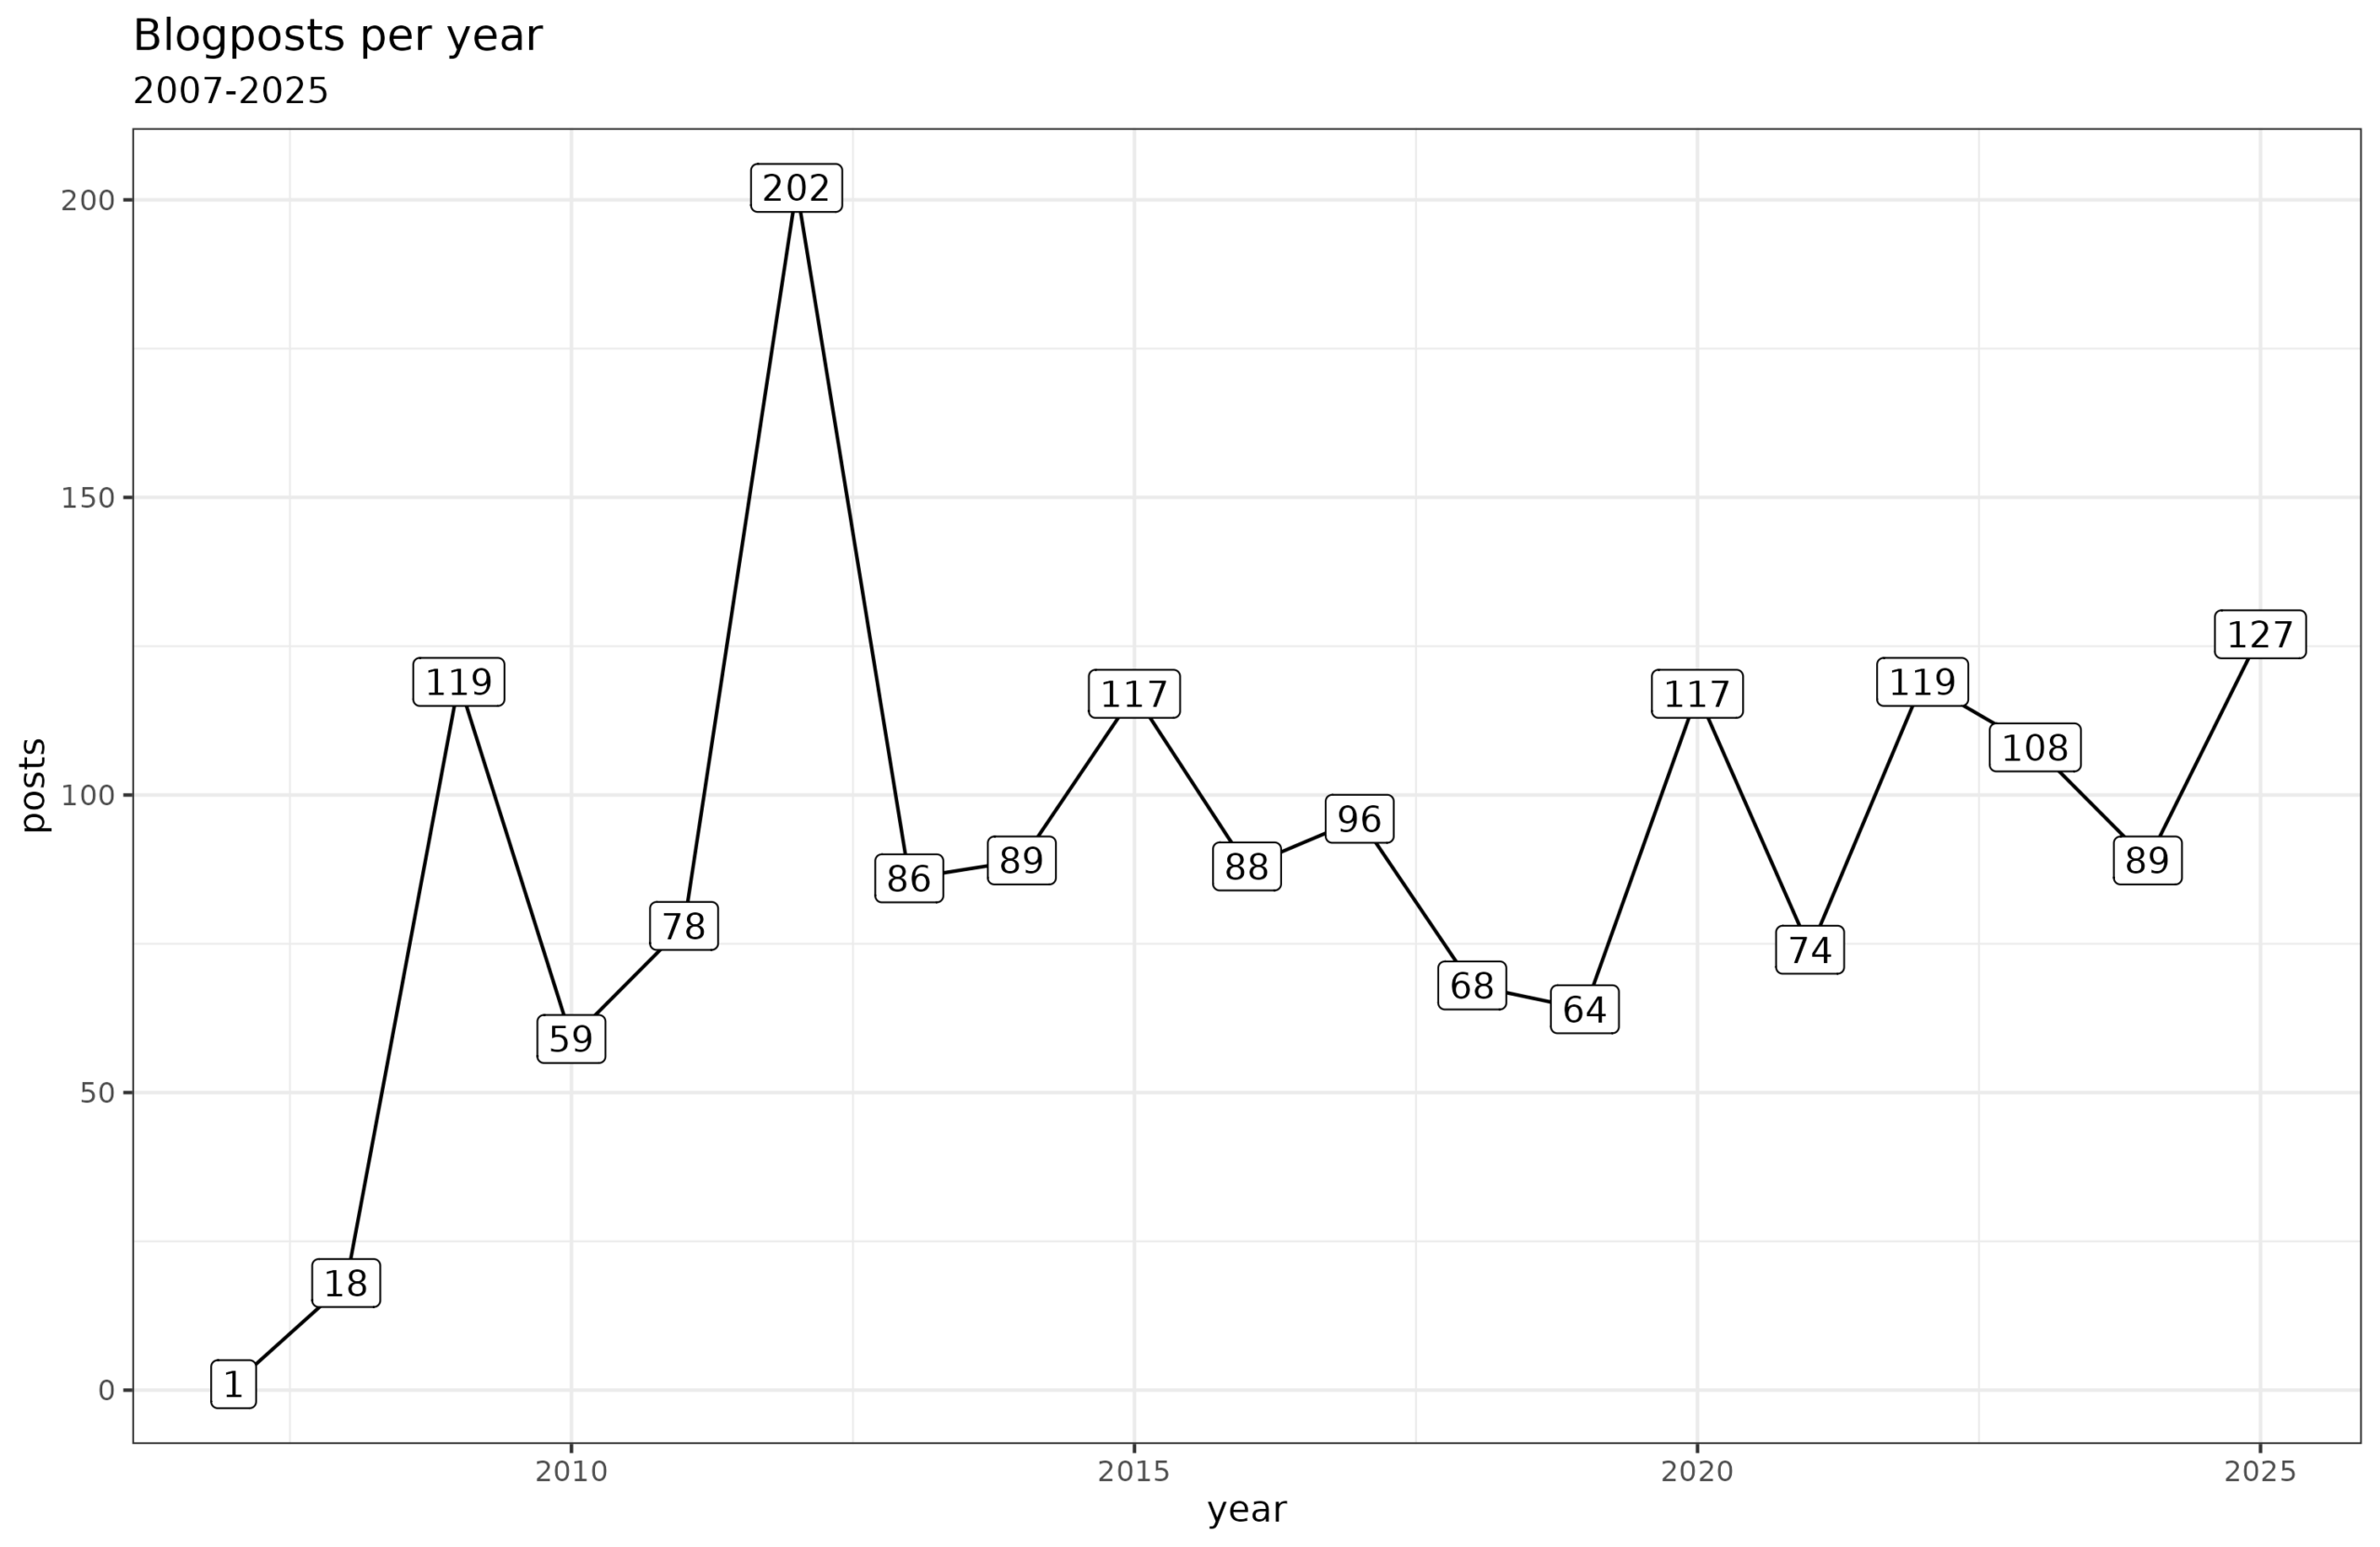
2025 turns out to have been the most blogging year since 2014. I don’t feel like I tried writing more than the usual amount, and in fact, since becoming a father in August, time has been more constrained, and yet productivity rose. Maybe we can attribute this to the general pattern of fathers/married men being more productive (various papers on this). Or maybe it’s the growing desire to satisfy my readers and subscribers.
Blog readership and subscribers
Substack provides a fairly decent subscriber growth chart:
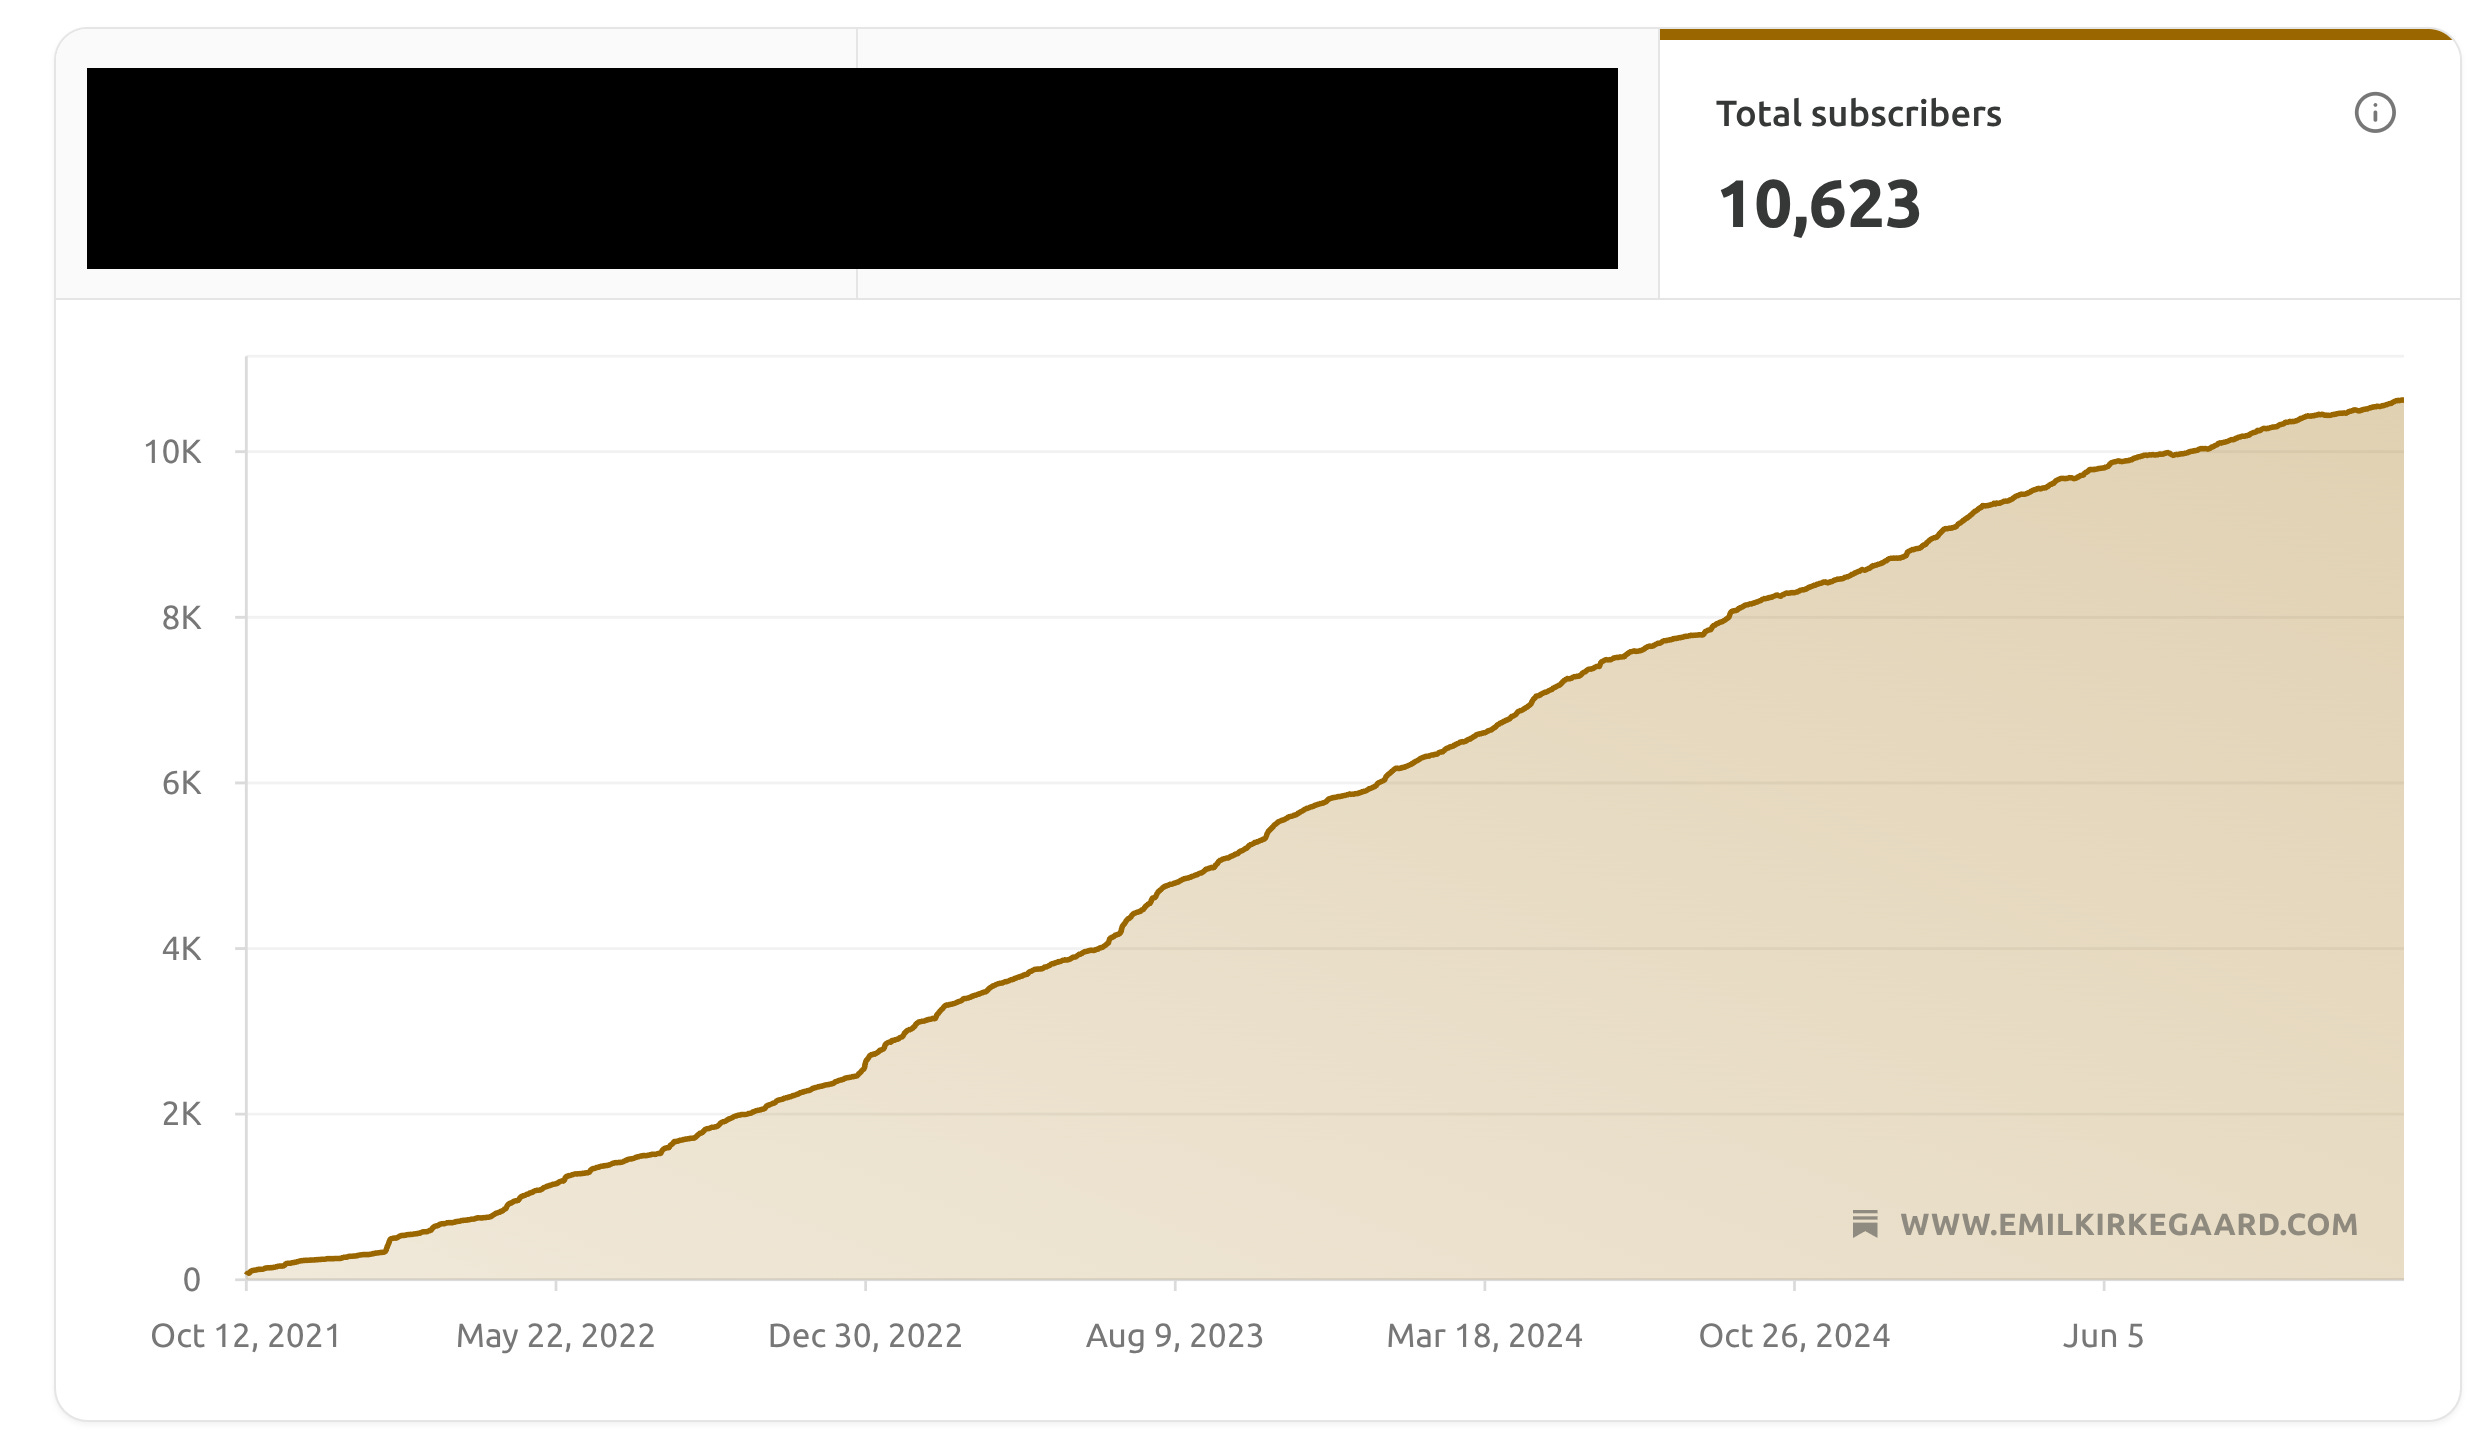
It’s mostly a story of linear line go up, though there are some slight nonlinearities if one looks closer:
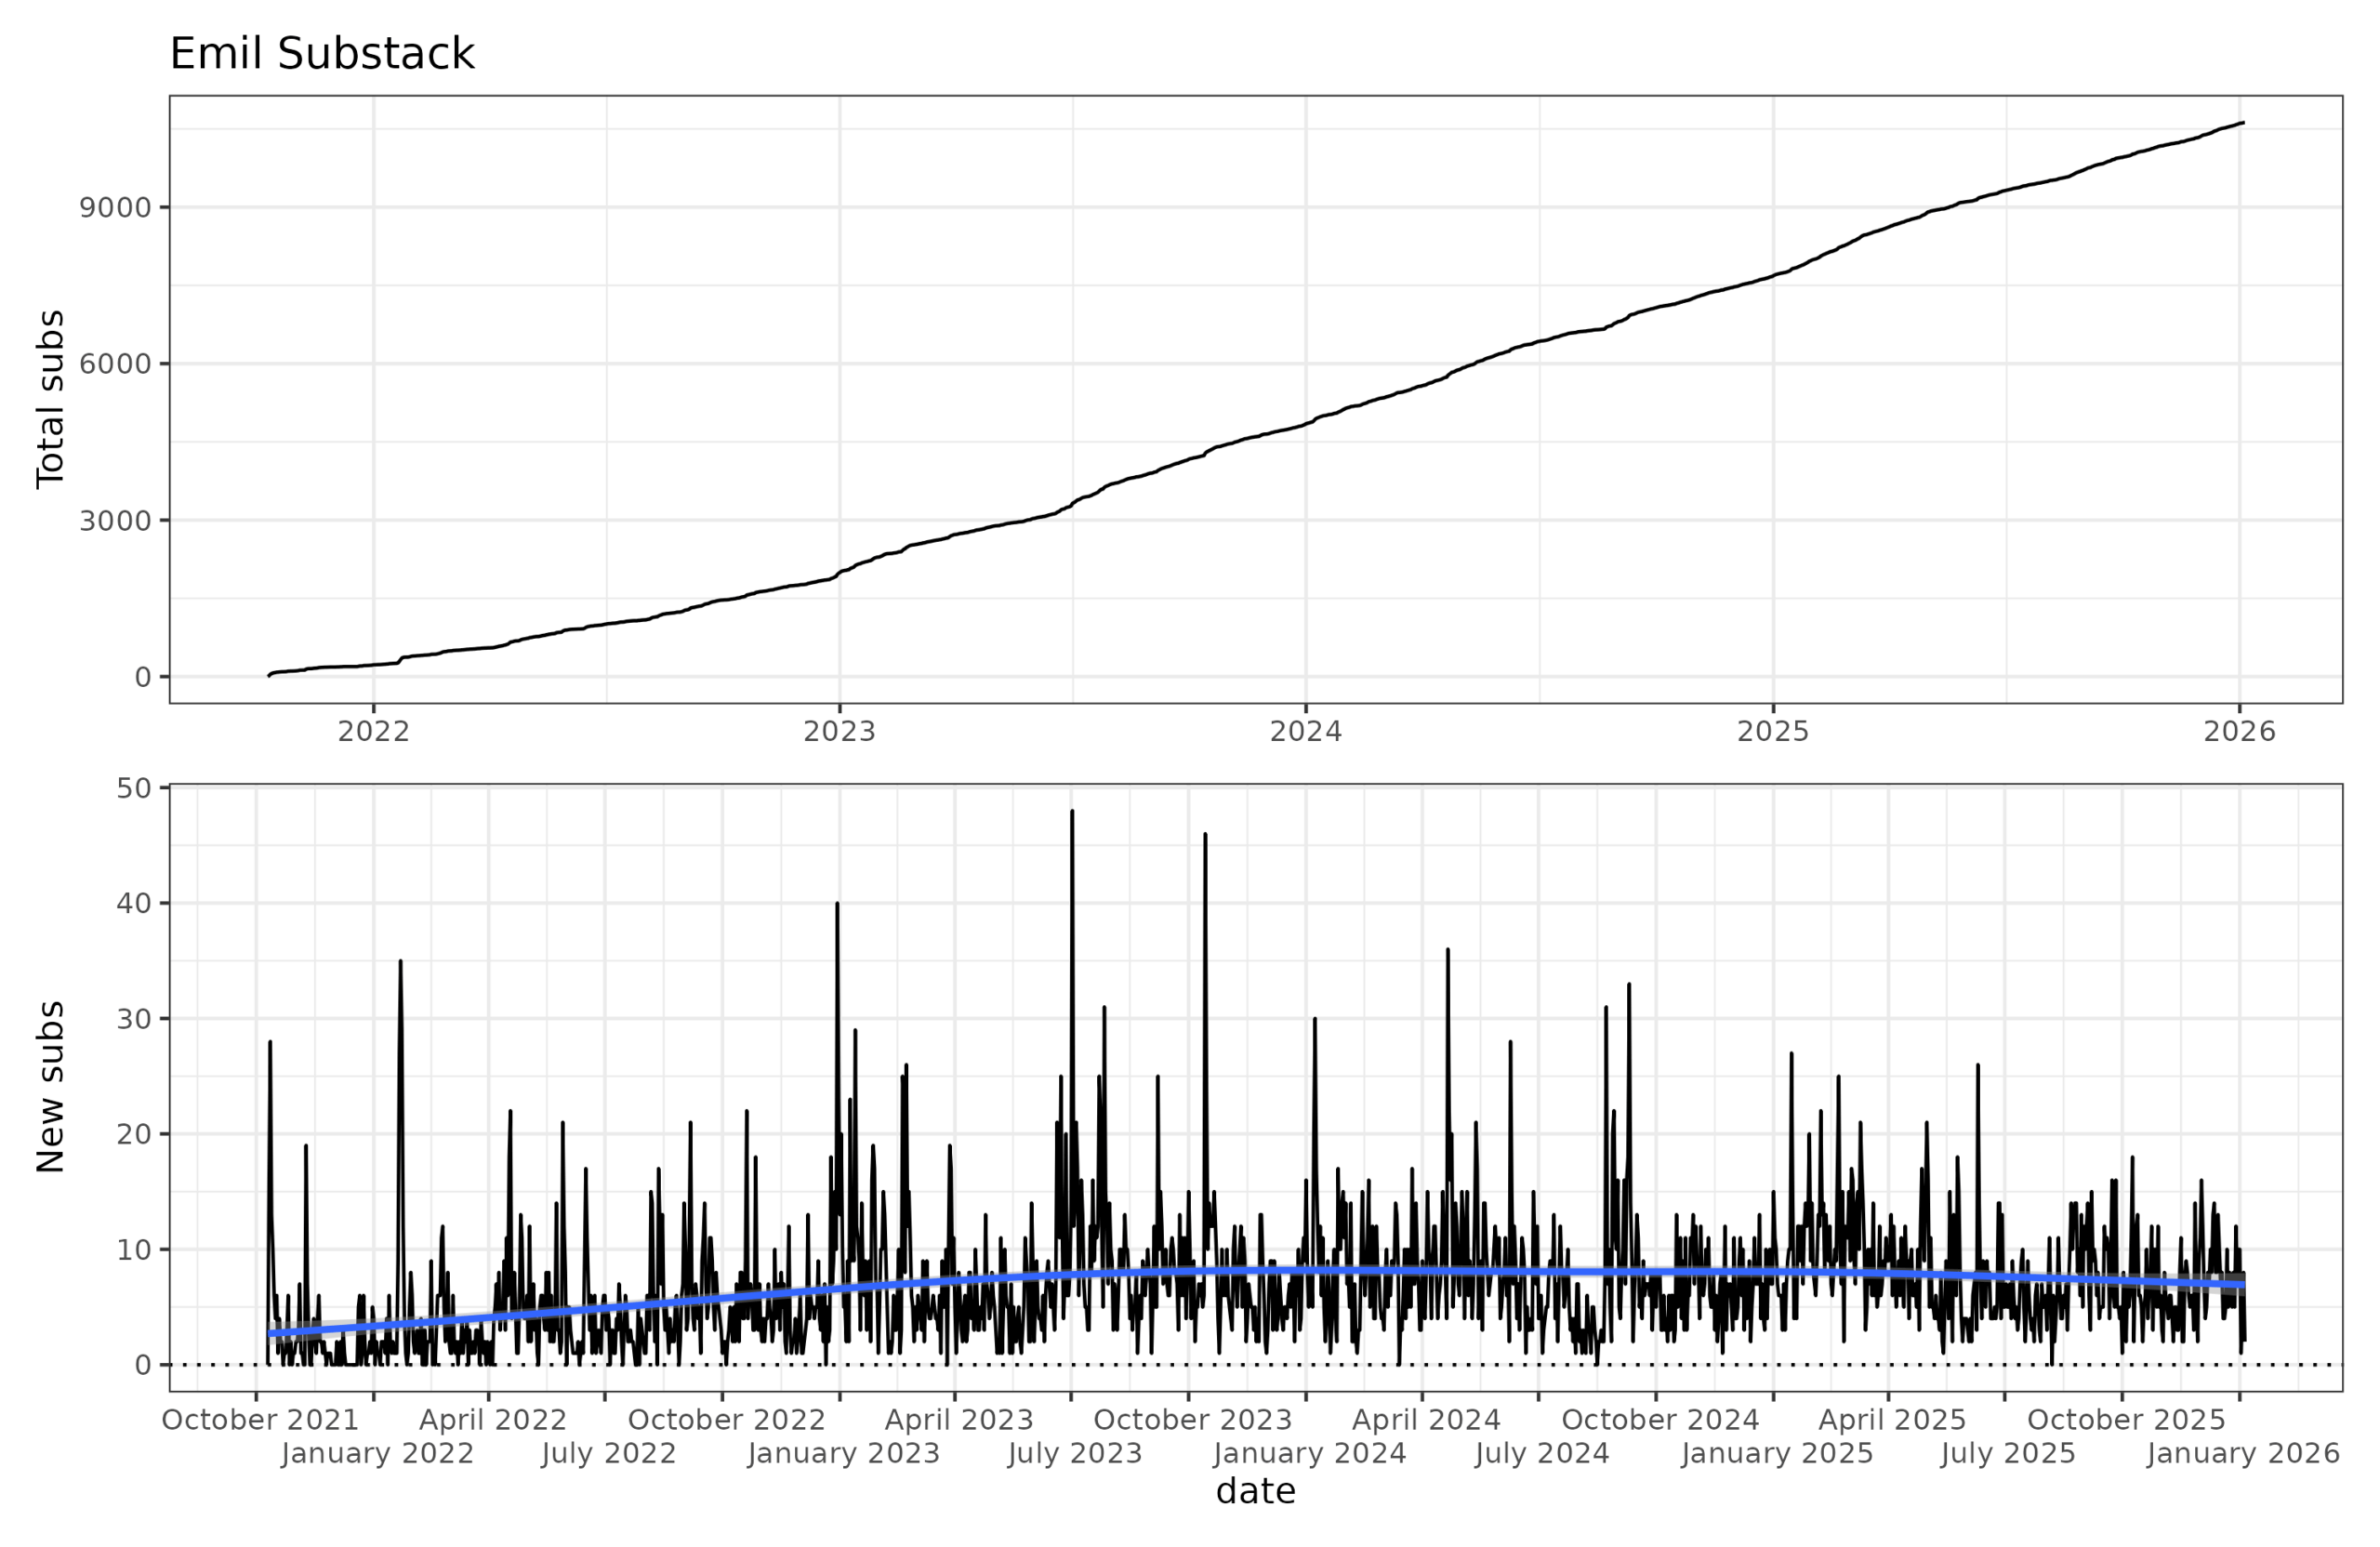
The blow line shows the average new subs per day as measured by date of sign-up. I think however these values are slightly off since they may not include past-subscribers. The moving average shows the daily growth is about 7 people, down from about 8 about 2 years ago. This may reflect market saturation or increased competition. There’s a lot more good Substacks these days than there used to be. I’ve heard many people talk about reading saturation, getting 20 new post emails per day. I try only to post at most once at day, and every day if I feel I have something interesting to say.
In terms of readership, we can also look at the pure traffic stats. Substack provides a plot with these, and one can extract the monthly totals:
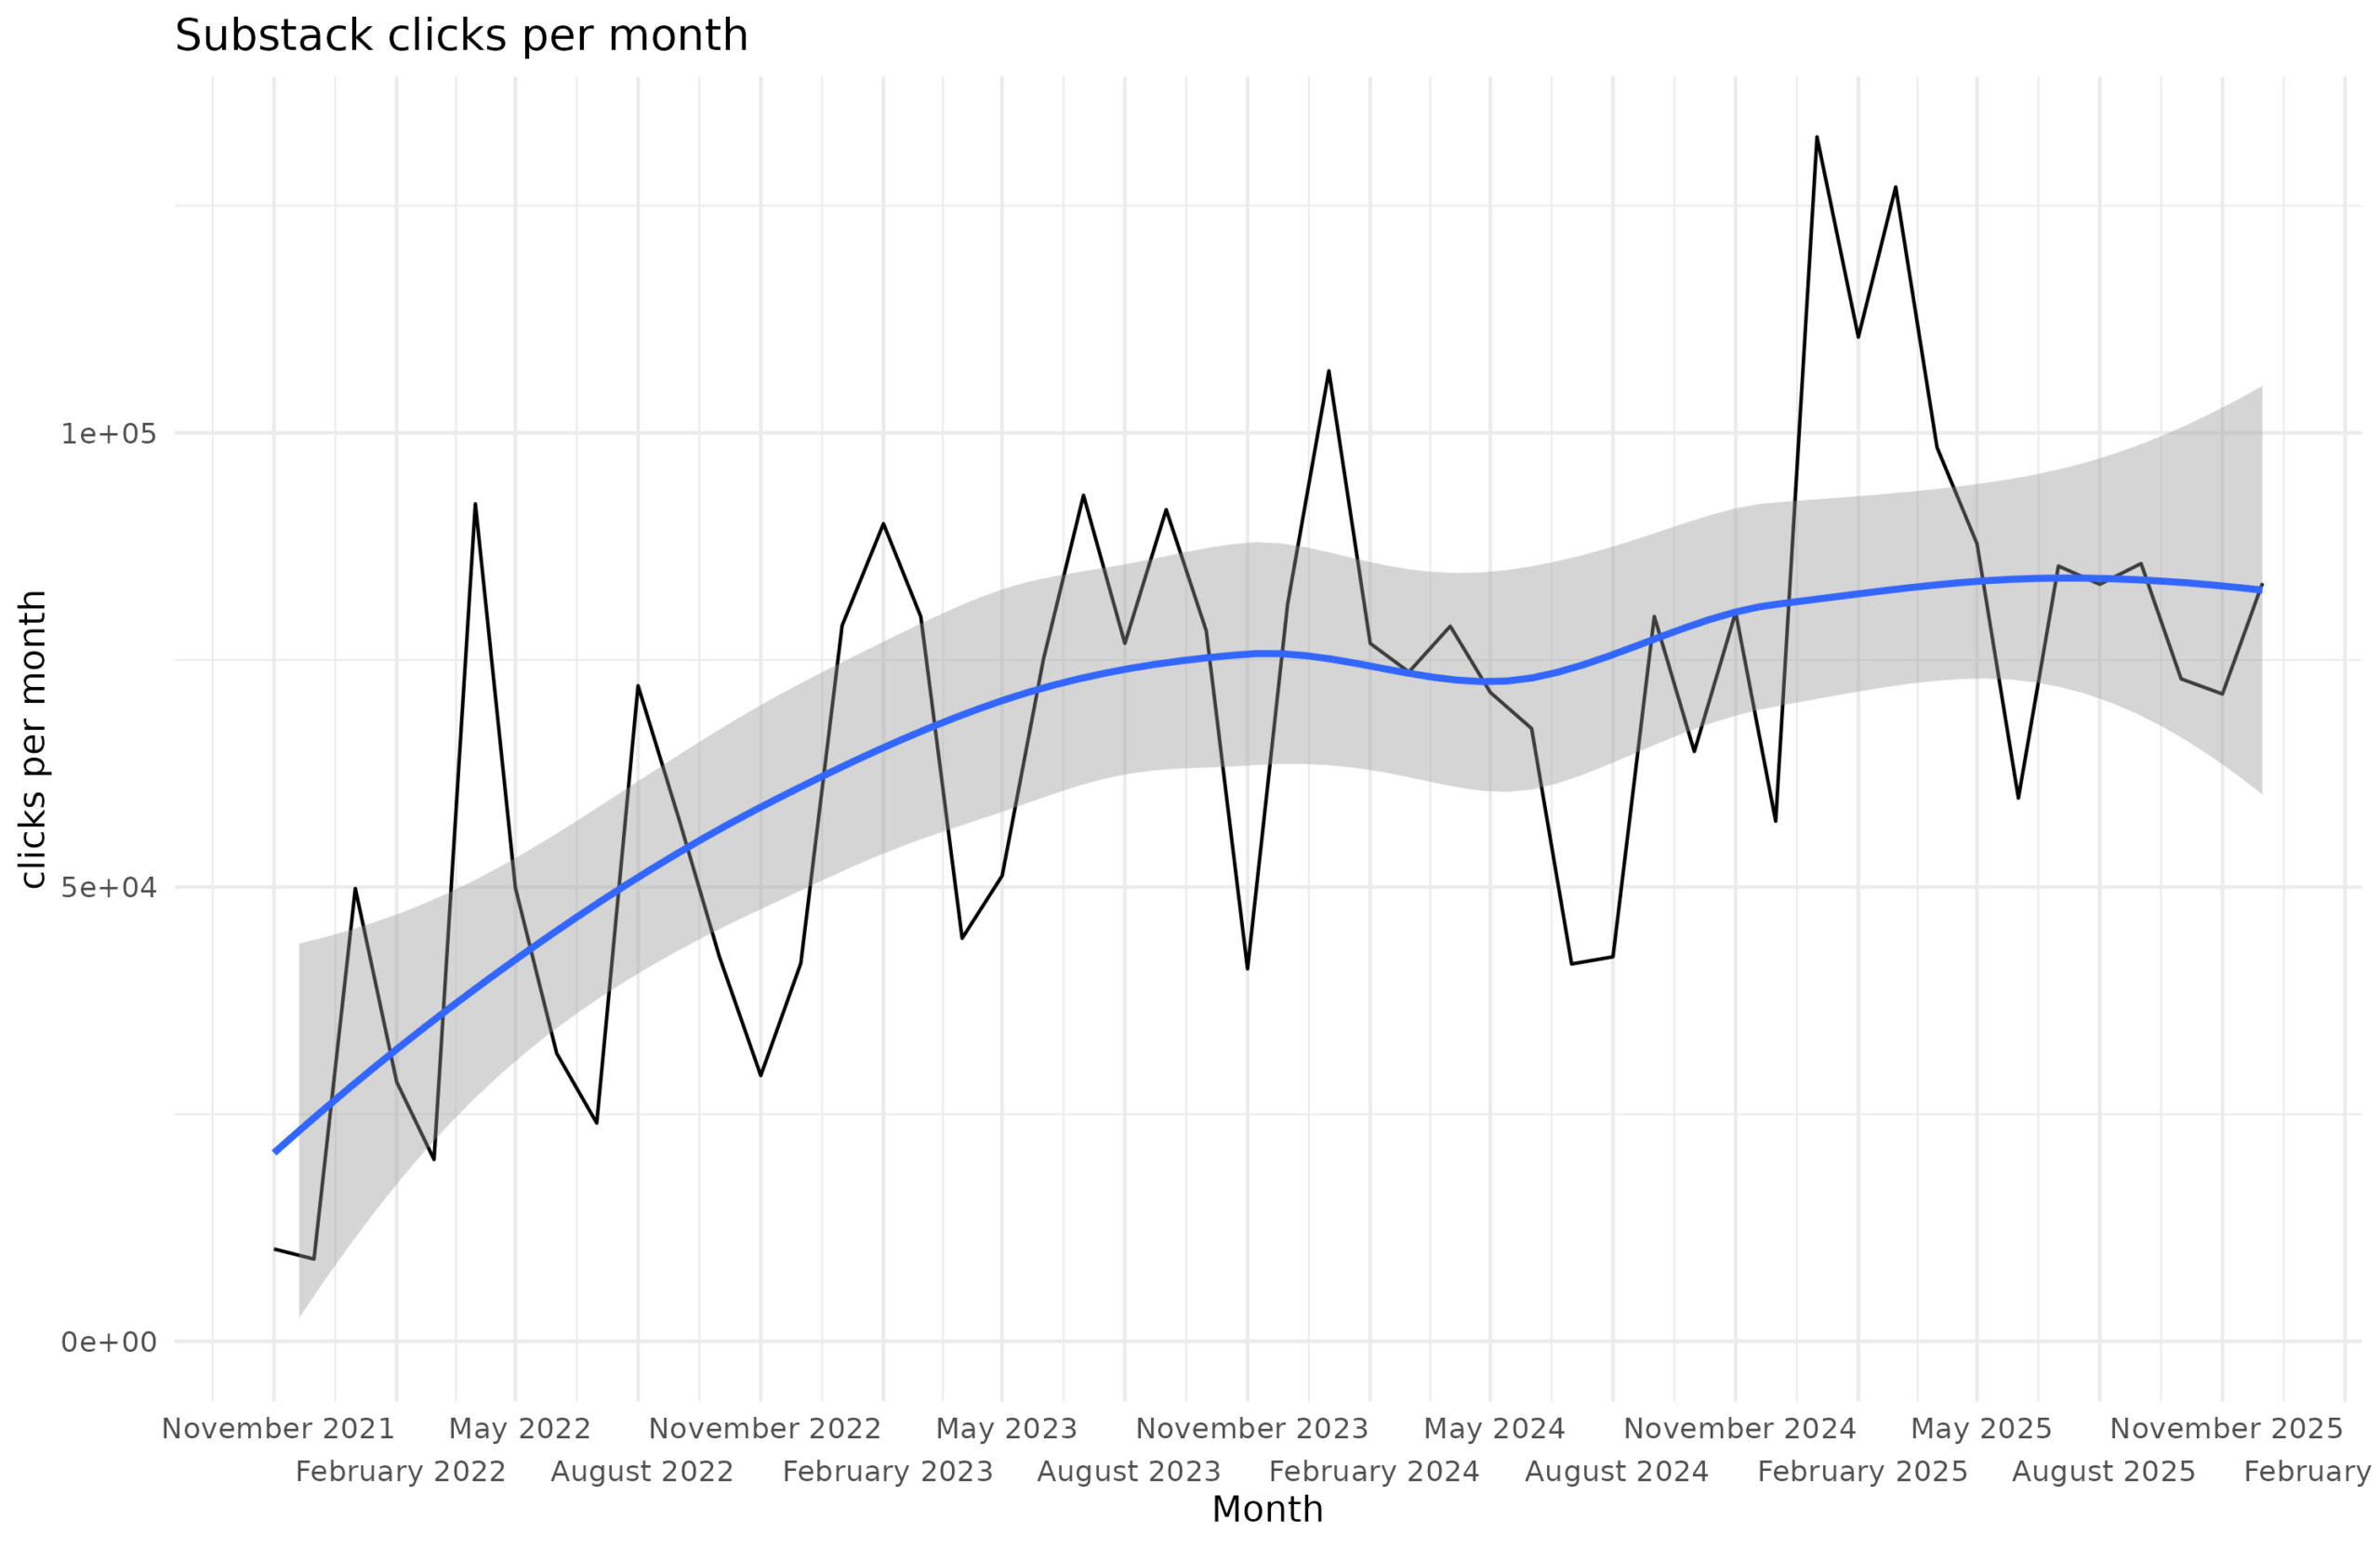
The moving average is about 85k clicks per month, with recent spikes in early 2025 and a low in the summer due to traveling. As for the exact metric, Substack just says “How many times your Substack was viewed over the selected period, including emails.”, which I think is total clicks including those detected by opening emails with embedded Javascript. The total reads for 2025 was 1,098,063. In comparison, both 2024 and 2023 were about 850k, and the total Substack reads is 3,378,298. That’s a lot of reads!
Scientific publications and citations
My front page has a list of publications, as does ResearchGate. The counts per year are:
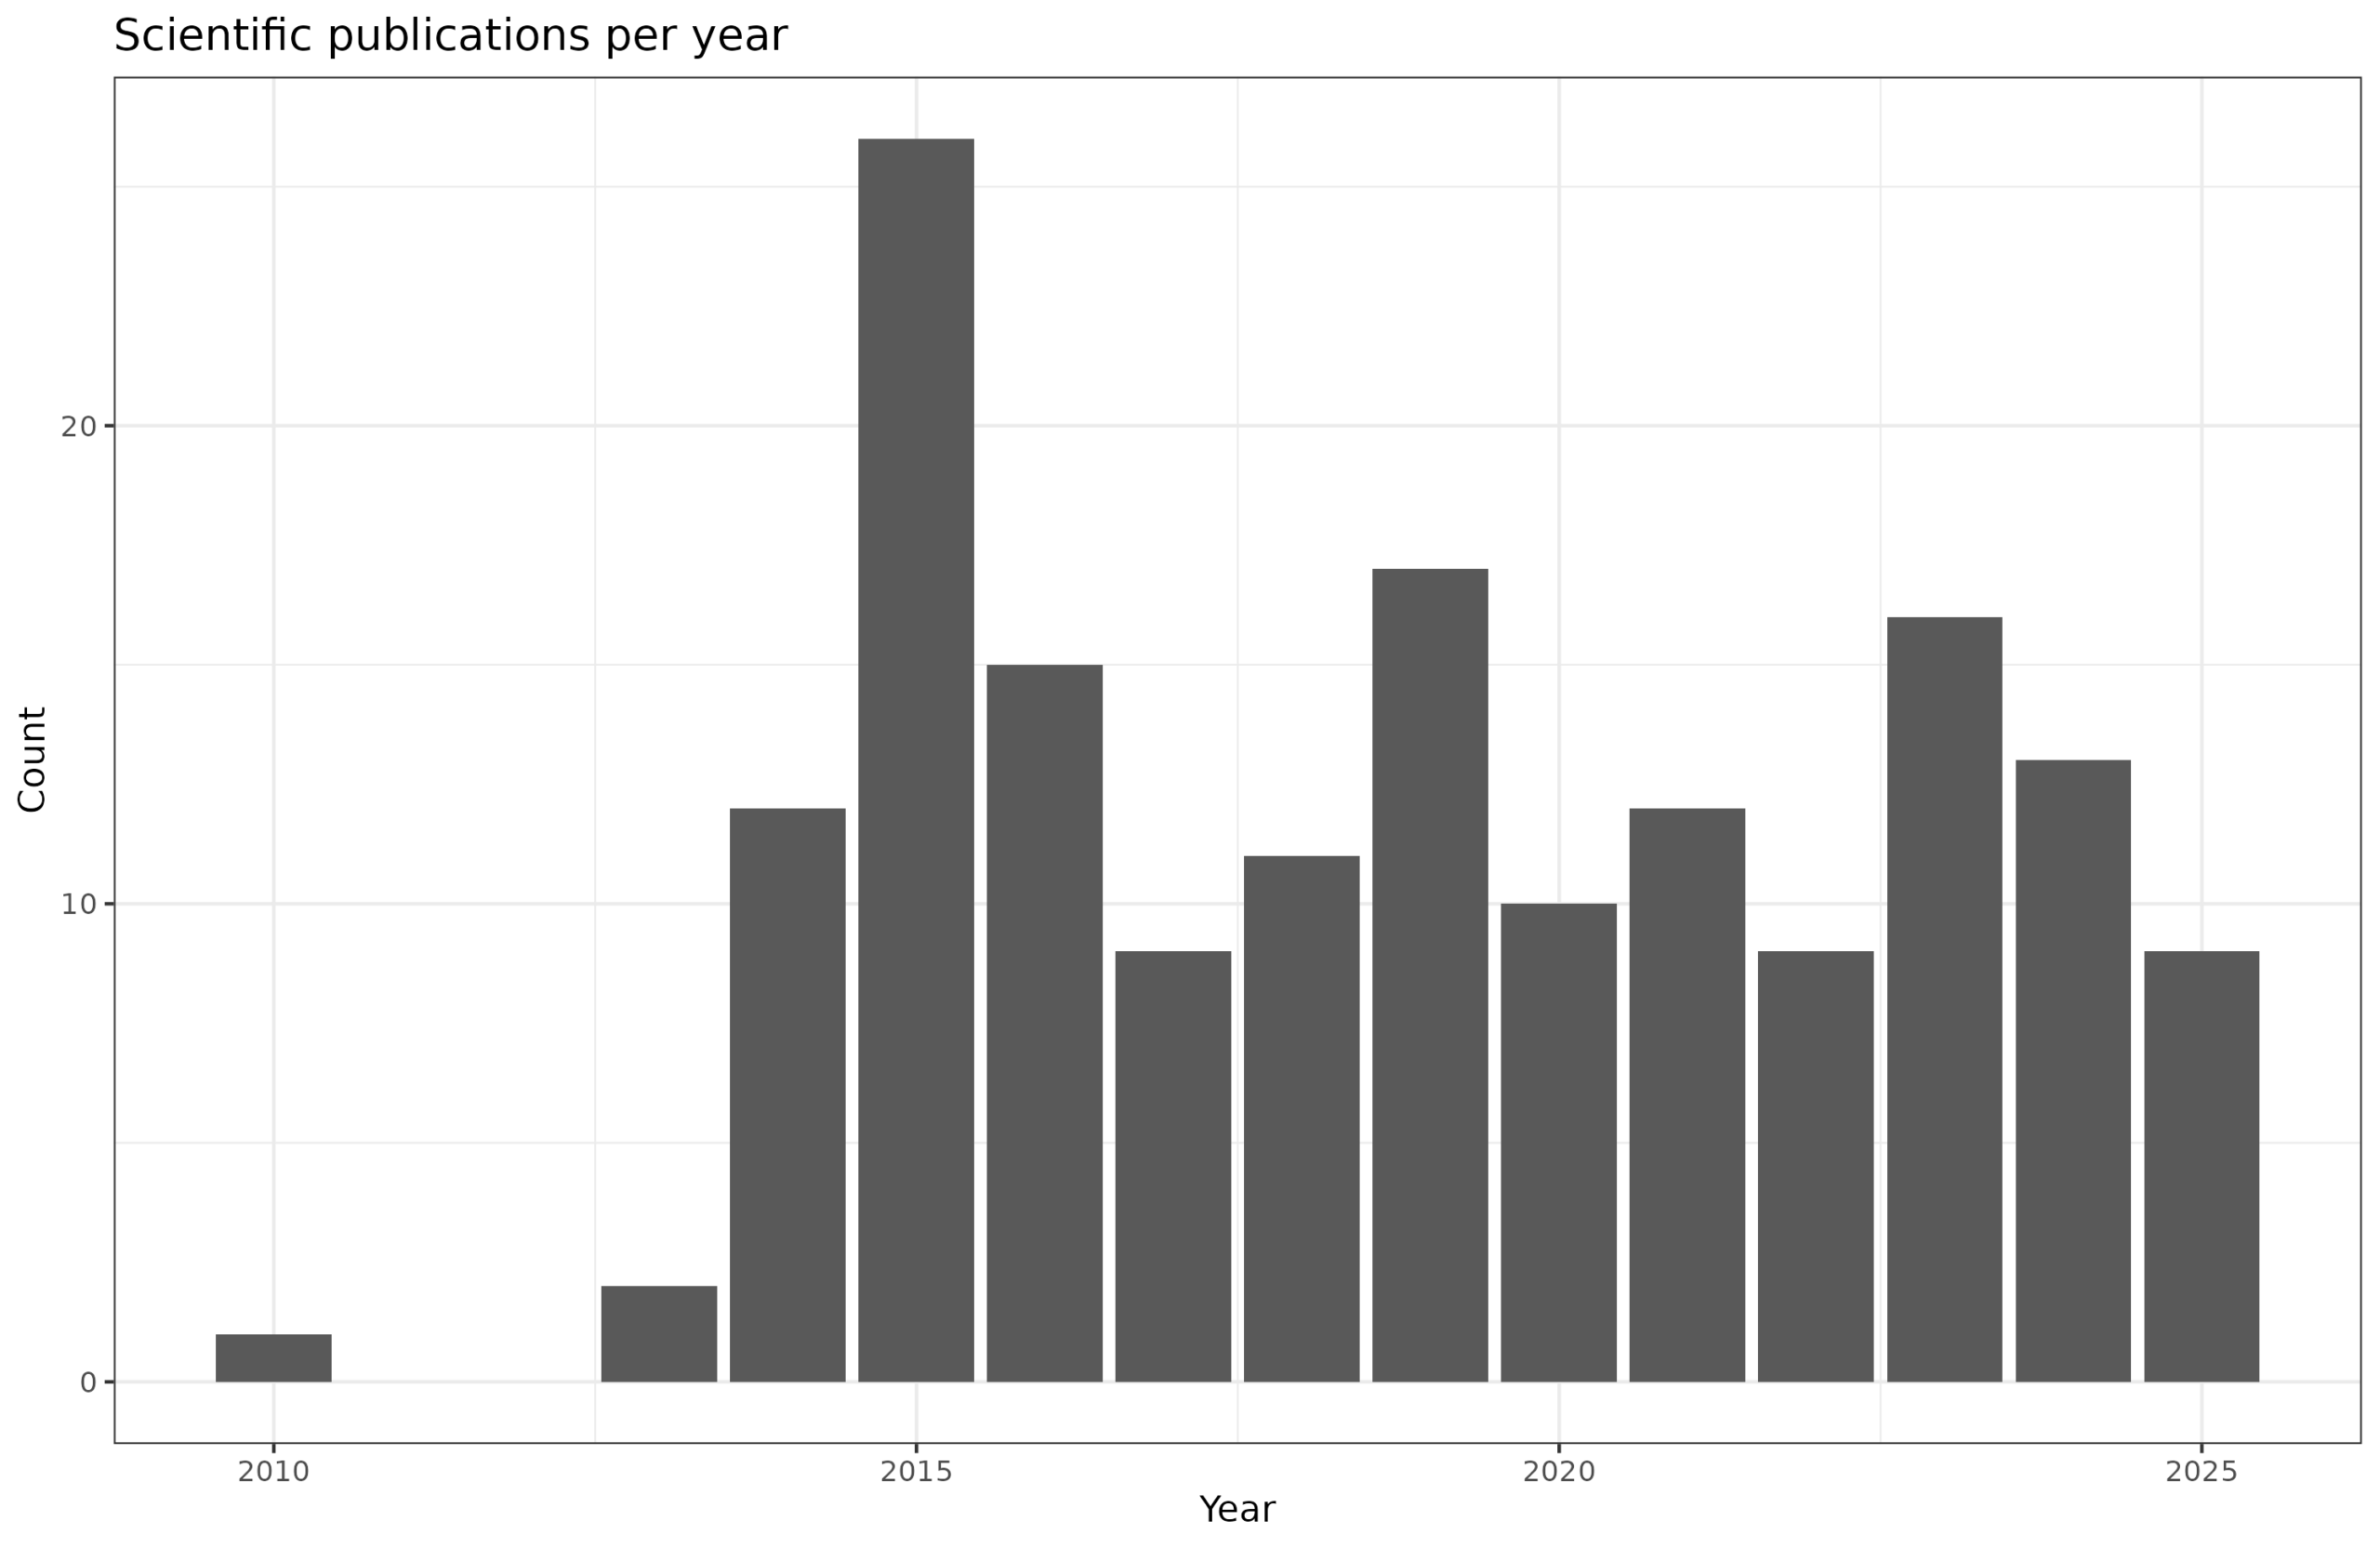
Here we can probably also see where the extra blogposts were coming from. I published a bit fewer papers this year. So maybe some of the effort was directed towards blogposting rather than the more time-consuming academic writing. On the other hand, I also spend an increasing amount of time supervising research by others, as well as being involved in a number of other projects.
We can also look at citations, using Google Scholar:
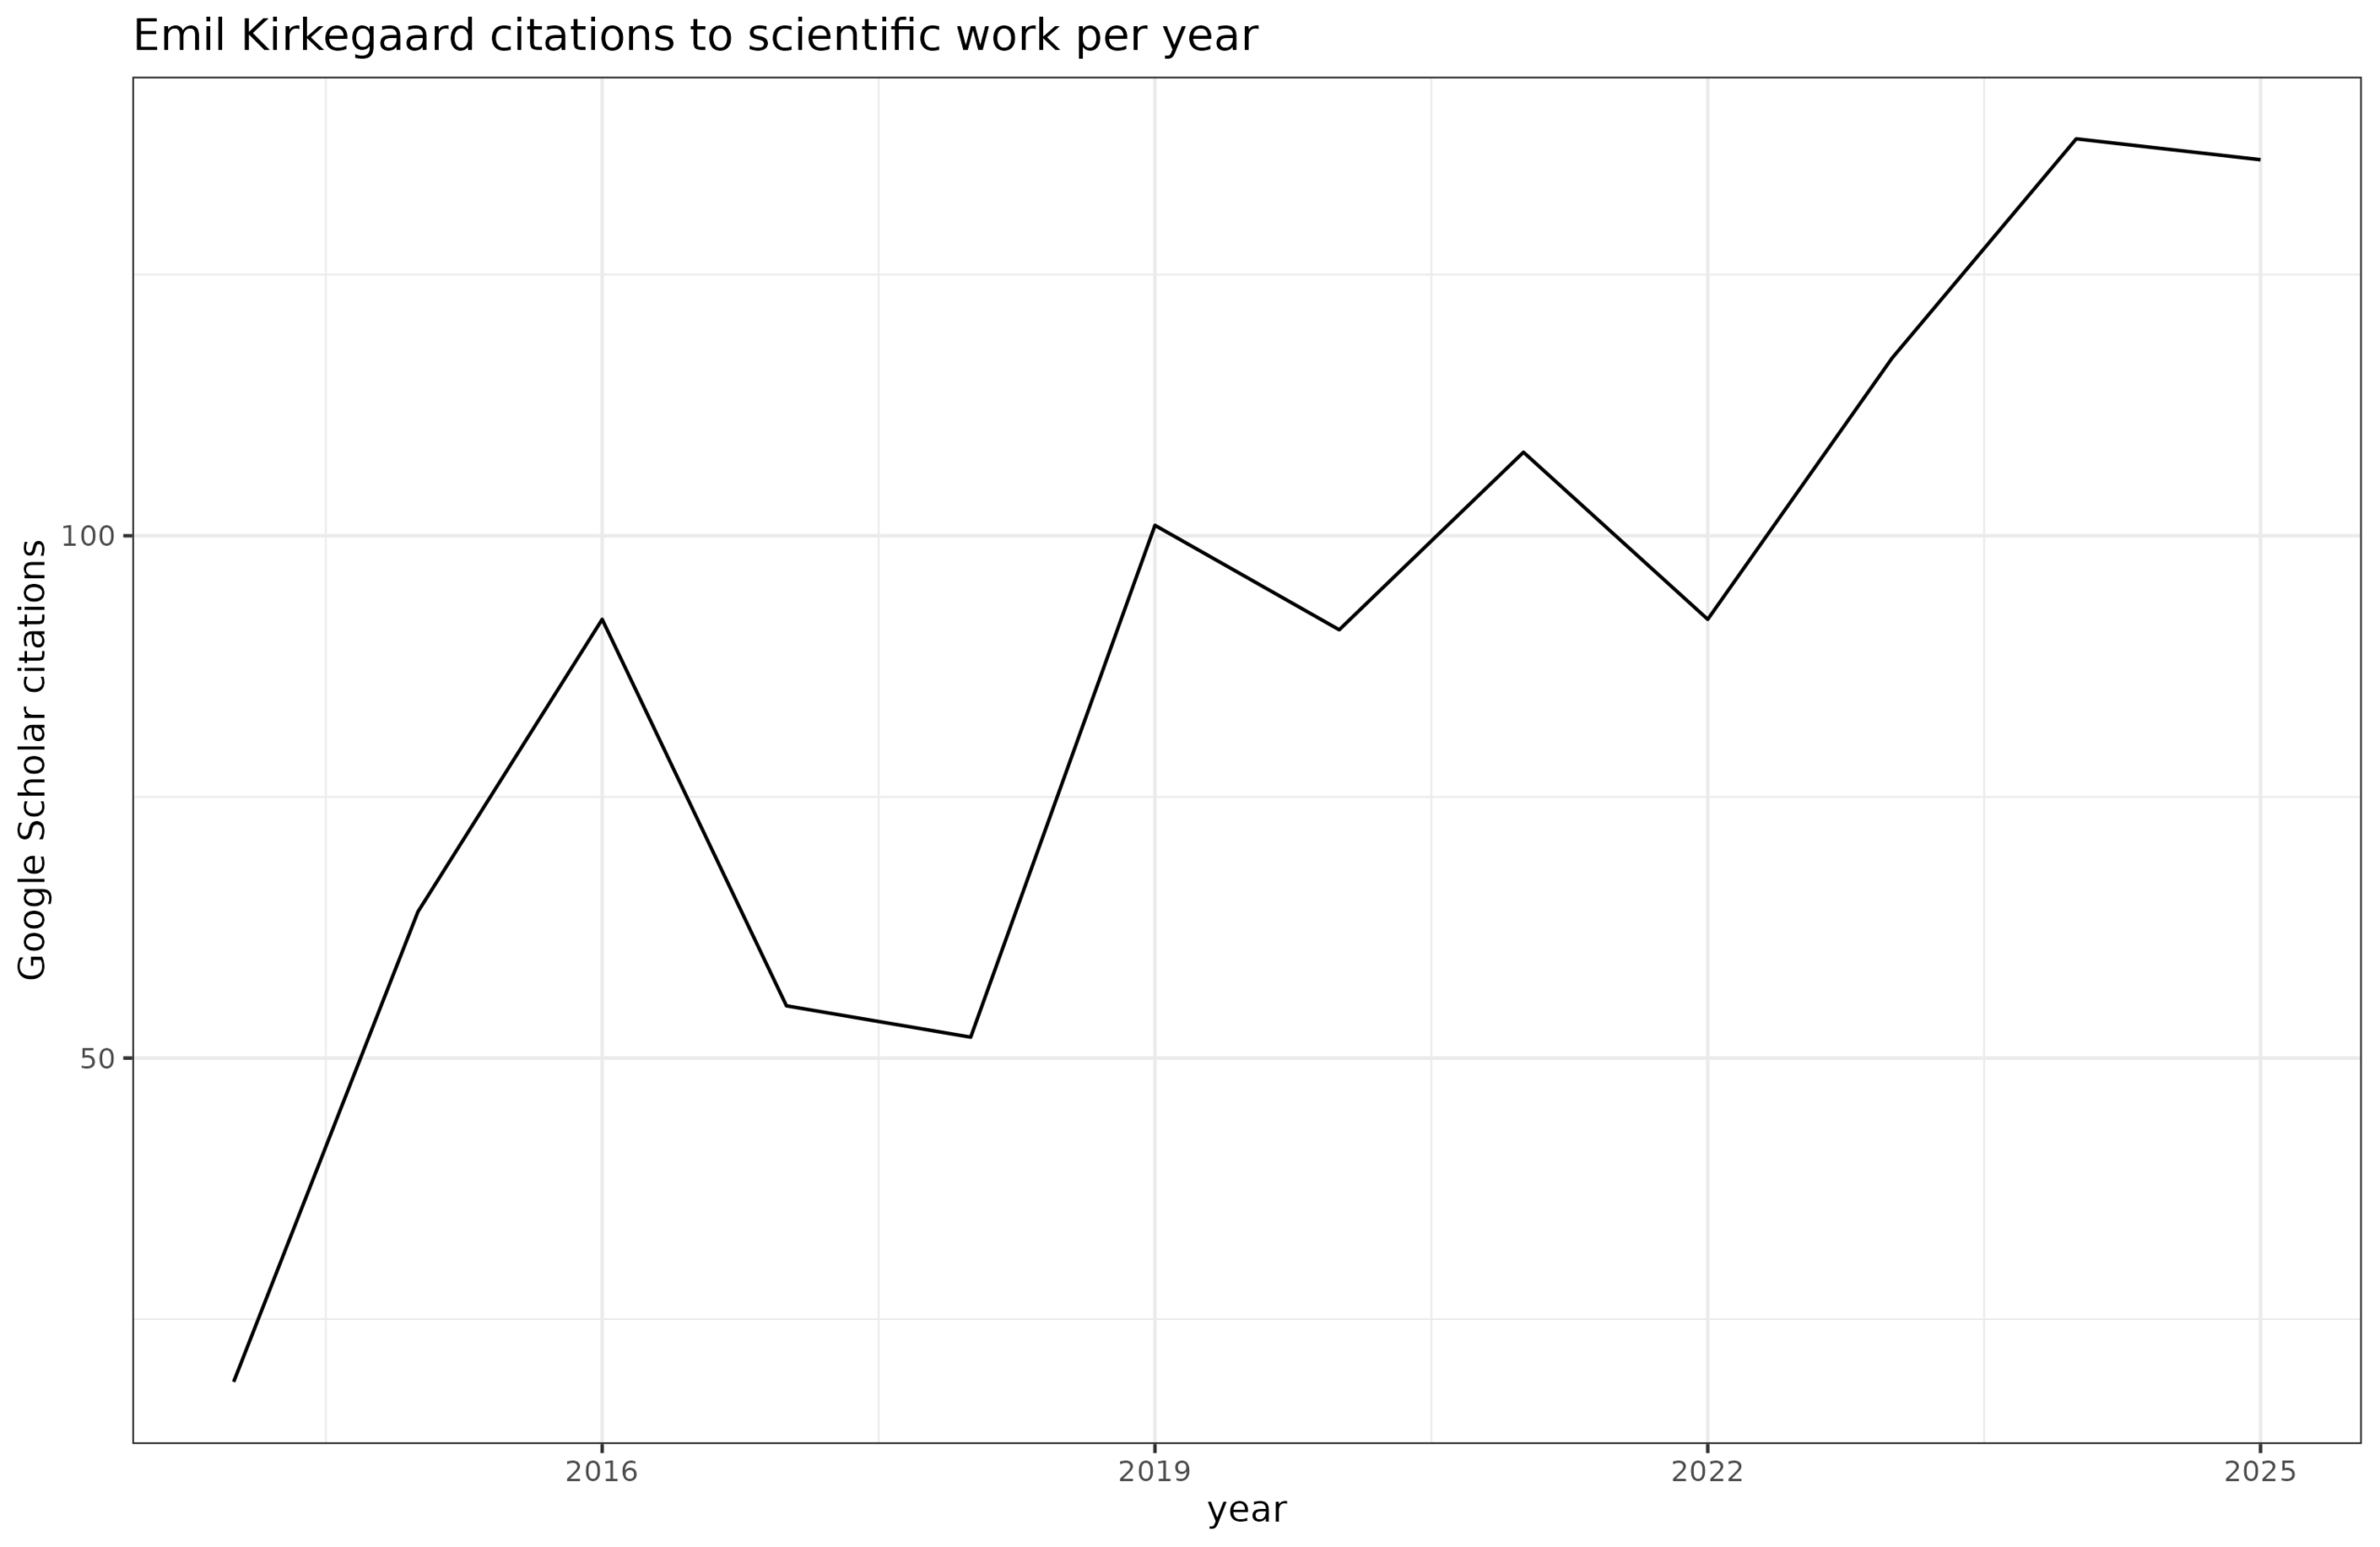
This chart shows a nice growing trend. Some of this reflect simple advantage of time. The longer you have been publishing stuff, the more older publications you have that someone will find and cite. As such, a growth is expected even if you almost stop publishing. Still, with the total number of citations being 1,090, I don’t think I will be winning any academic awards anytime soon. Farming academic citations is a matter of publishing surprising findings in the most famous journals. As such, the best thing to do for this purpose is to follow the current fashion and publish many publications about stereotype threat, emotional intelligence, social priming and so on. These are not likely to be good scientific contributions but they will be very helpful on the CV. Fortunately, since I don’t work in academia, I don’t have to tilt my publications towards fashionable nonsense.
Books read
The Goodreads stats:
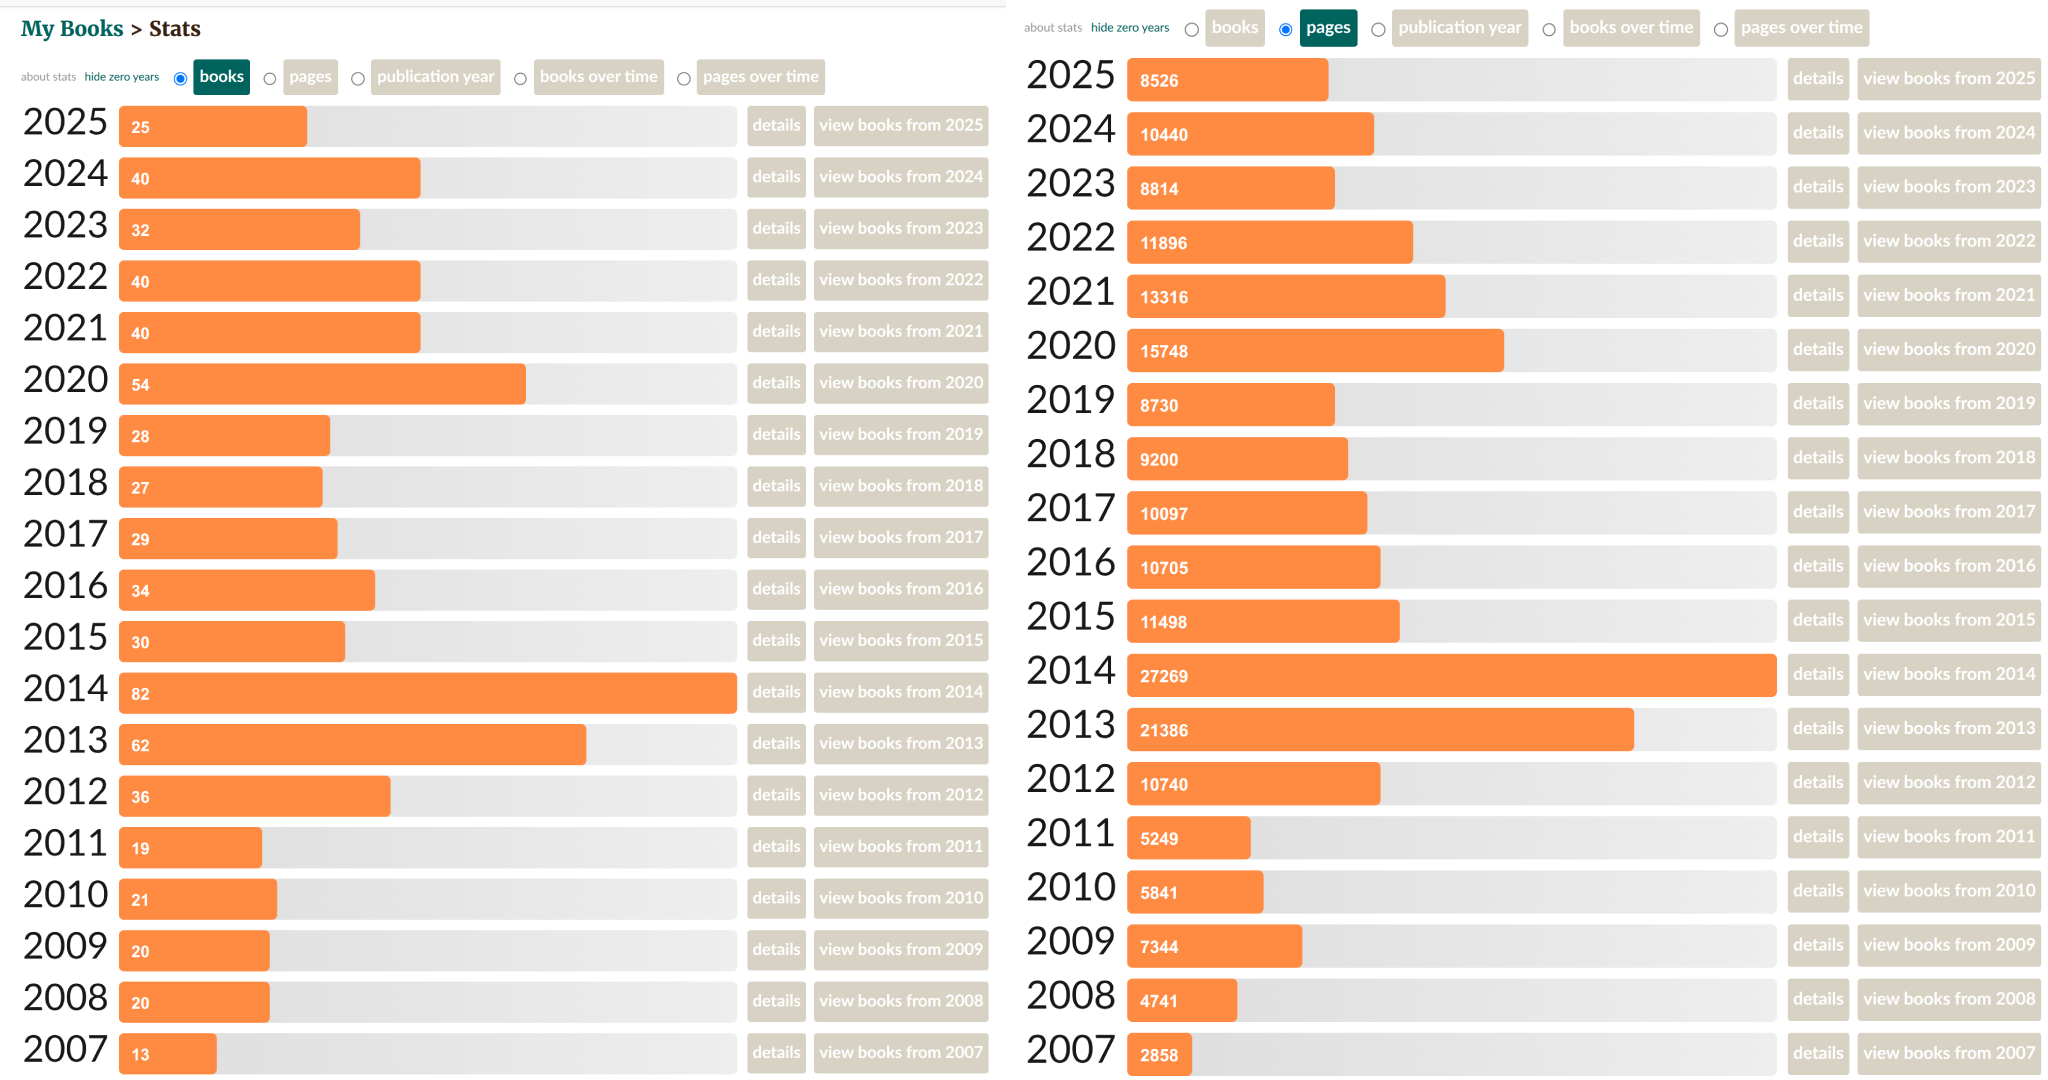
I had a yearly goal of 30 books but only read 25. Overall, I have been trying to put more effort into producing things myself instead of absorbing more information. There is a diminishing returns on the information one can get from reading but it’s difficult to say where the optimum lies. If we look at the time since 2020 (COVID onset), I was reading 15.7k pages, and last year only 8.5k, or about half. However, of course I probably substituted this by reading more blogs instead. Hopefully, it wasn’t all useless scrolling. On that note, I recommend not using the “for you” algorithm, which will feed you additive nonsense (and frequently inaccurate ragebait and fake AI stuff). Better to only use the “people you follow”. It will quickly run out of stuff you haven’t seen and that’s a good thing, which means you can move on to doing something better with your time.
At the end of the year, one can try to game the system by reading many small books. This will cause a decline in the correlation between number of books read and the total number of pages. I looked at whether I had been doing this enough:
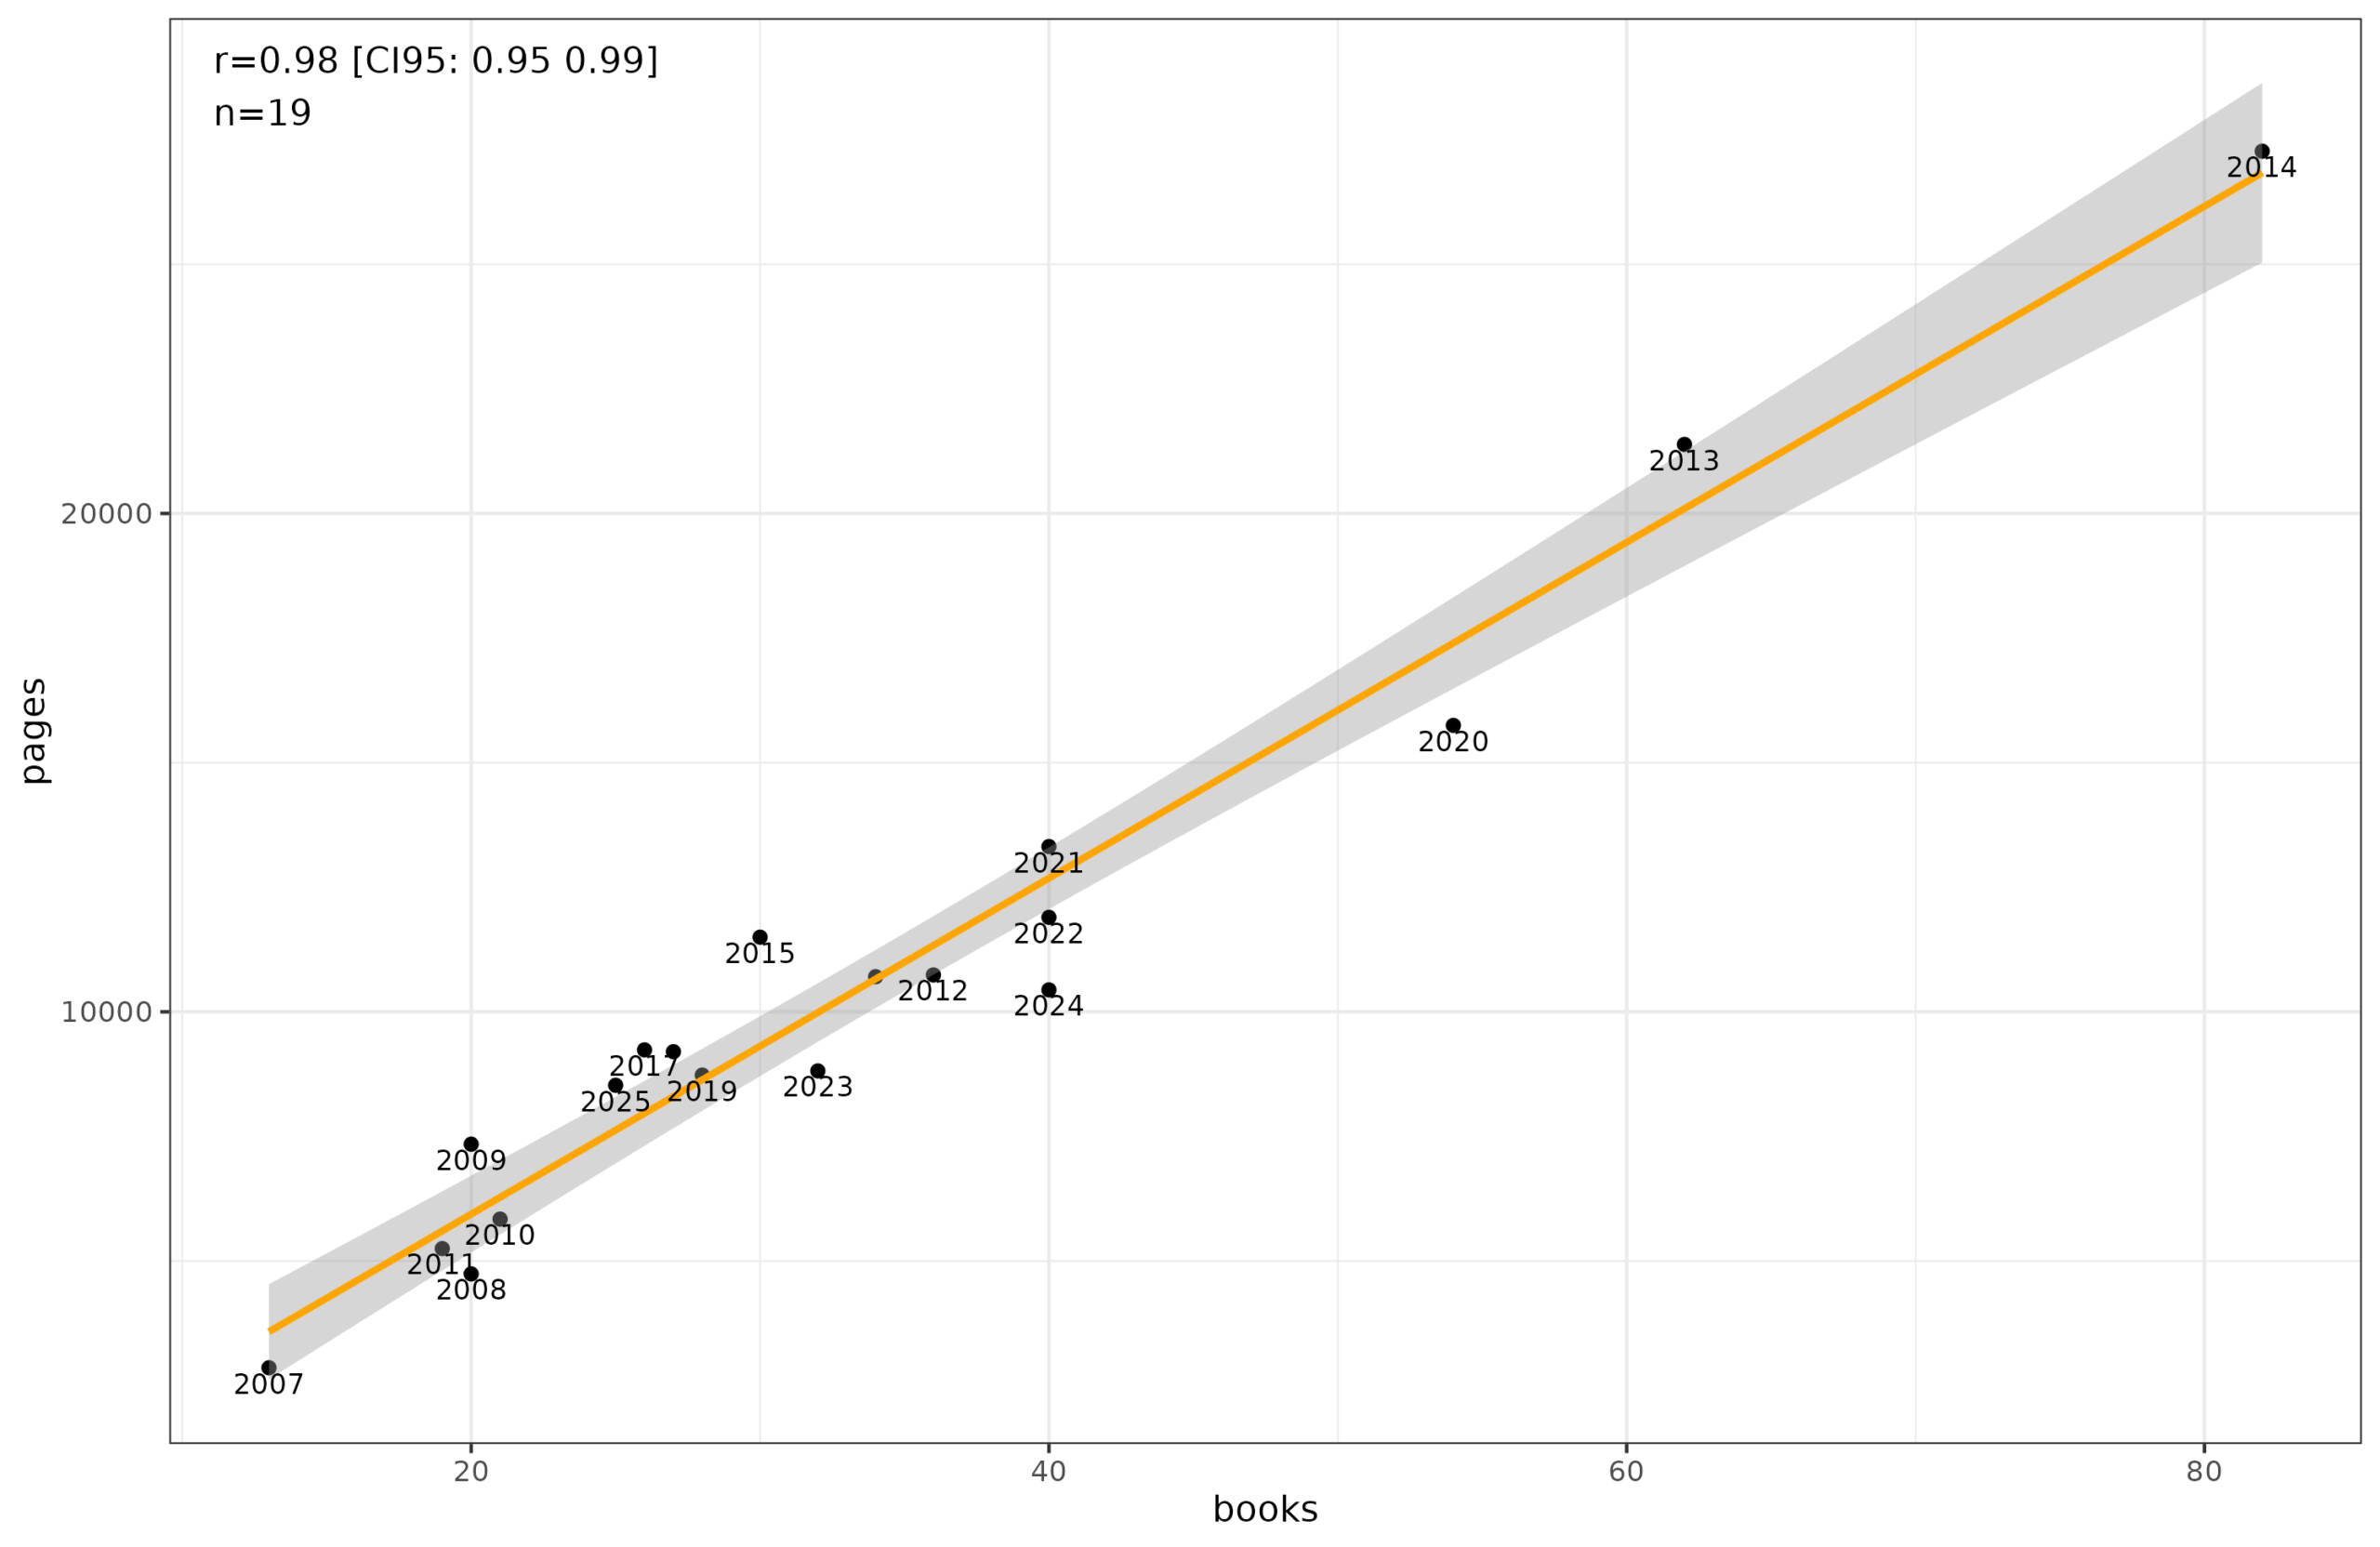
But the correlation is 0.98, so whatever strategy was used to try to achieve yearly goals, it was too small to cause much disturbance to the general pattern that reading more books is reading more pages.
X/Twitter
This one is rather obnoxious since X doesn’t have any historical data. There are a variety of websites for tracking this, which all suck. So I’ve resorted to manually getting the follower counts by using the Internet Archive to look back in time. This gives somewhat sporadic coverage (since writing a scraper for IA is very annoying and slow, so I only handpicked the earliest data for each year), but overall we get this result:
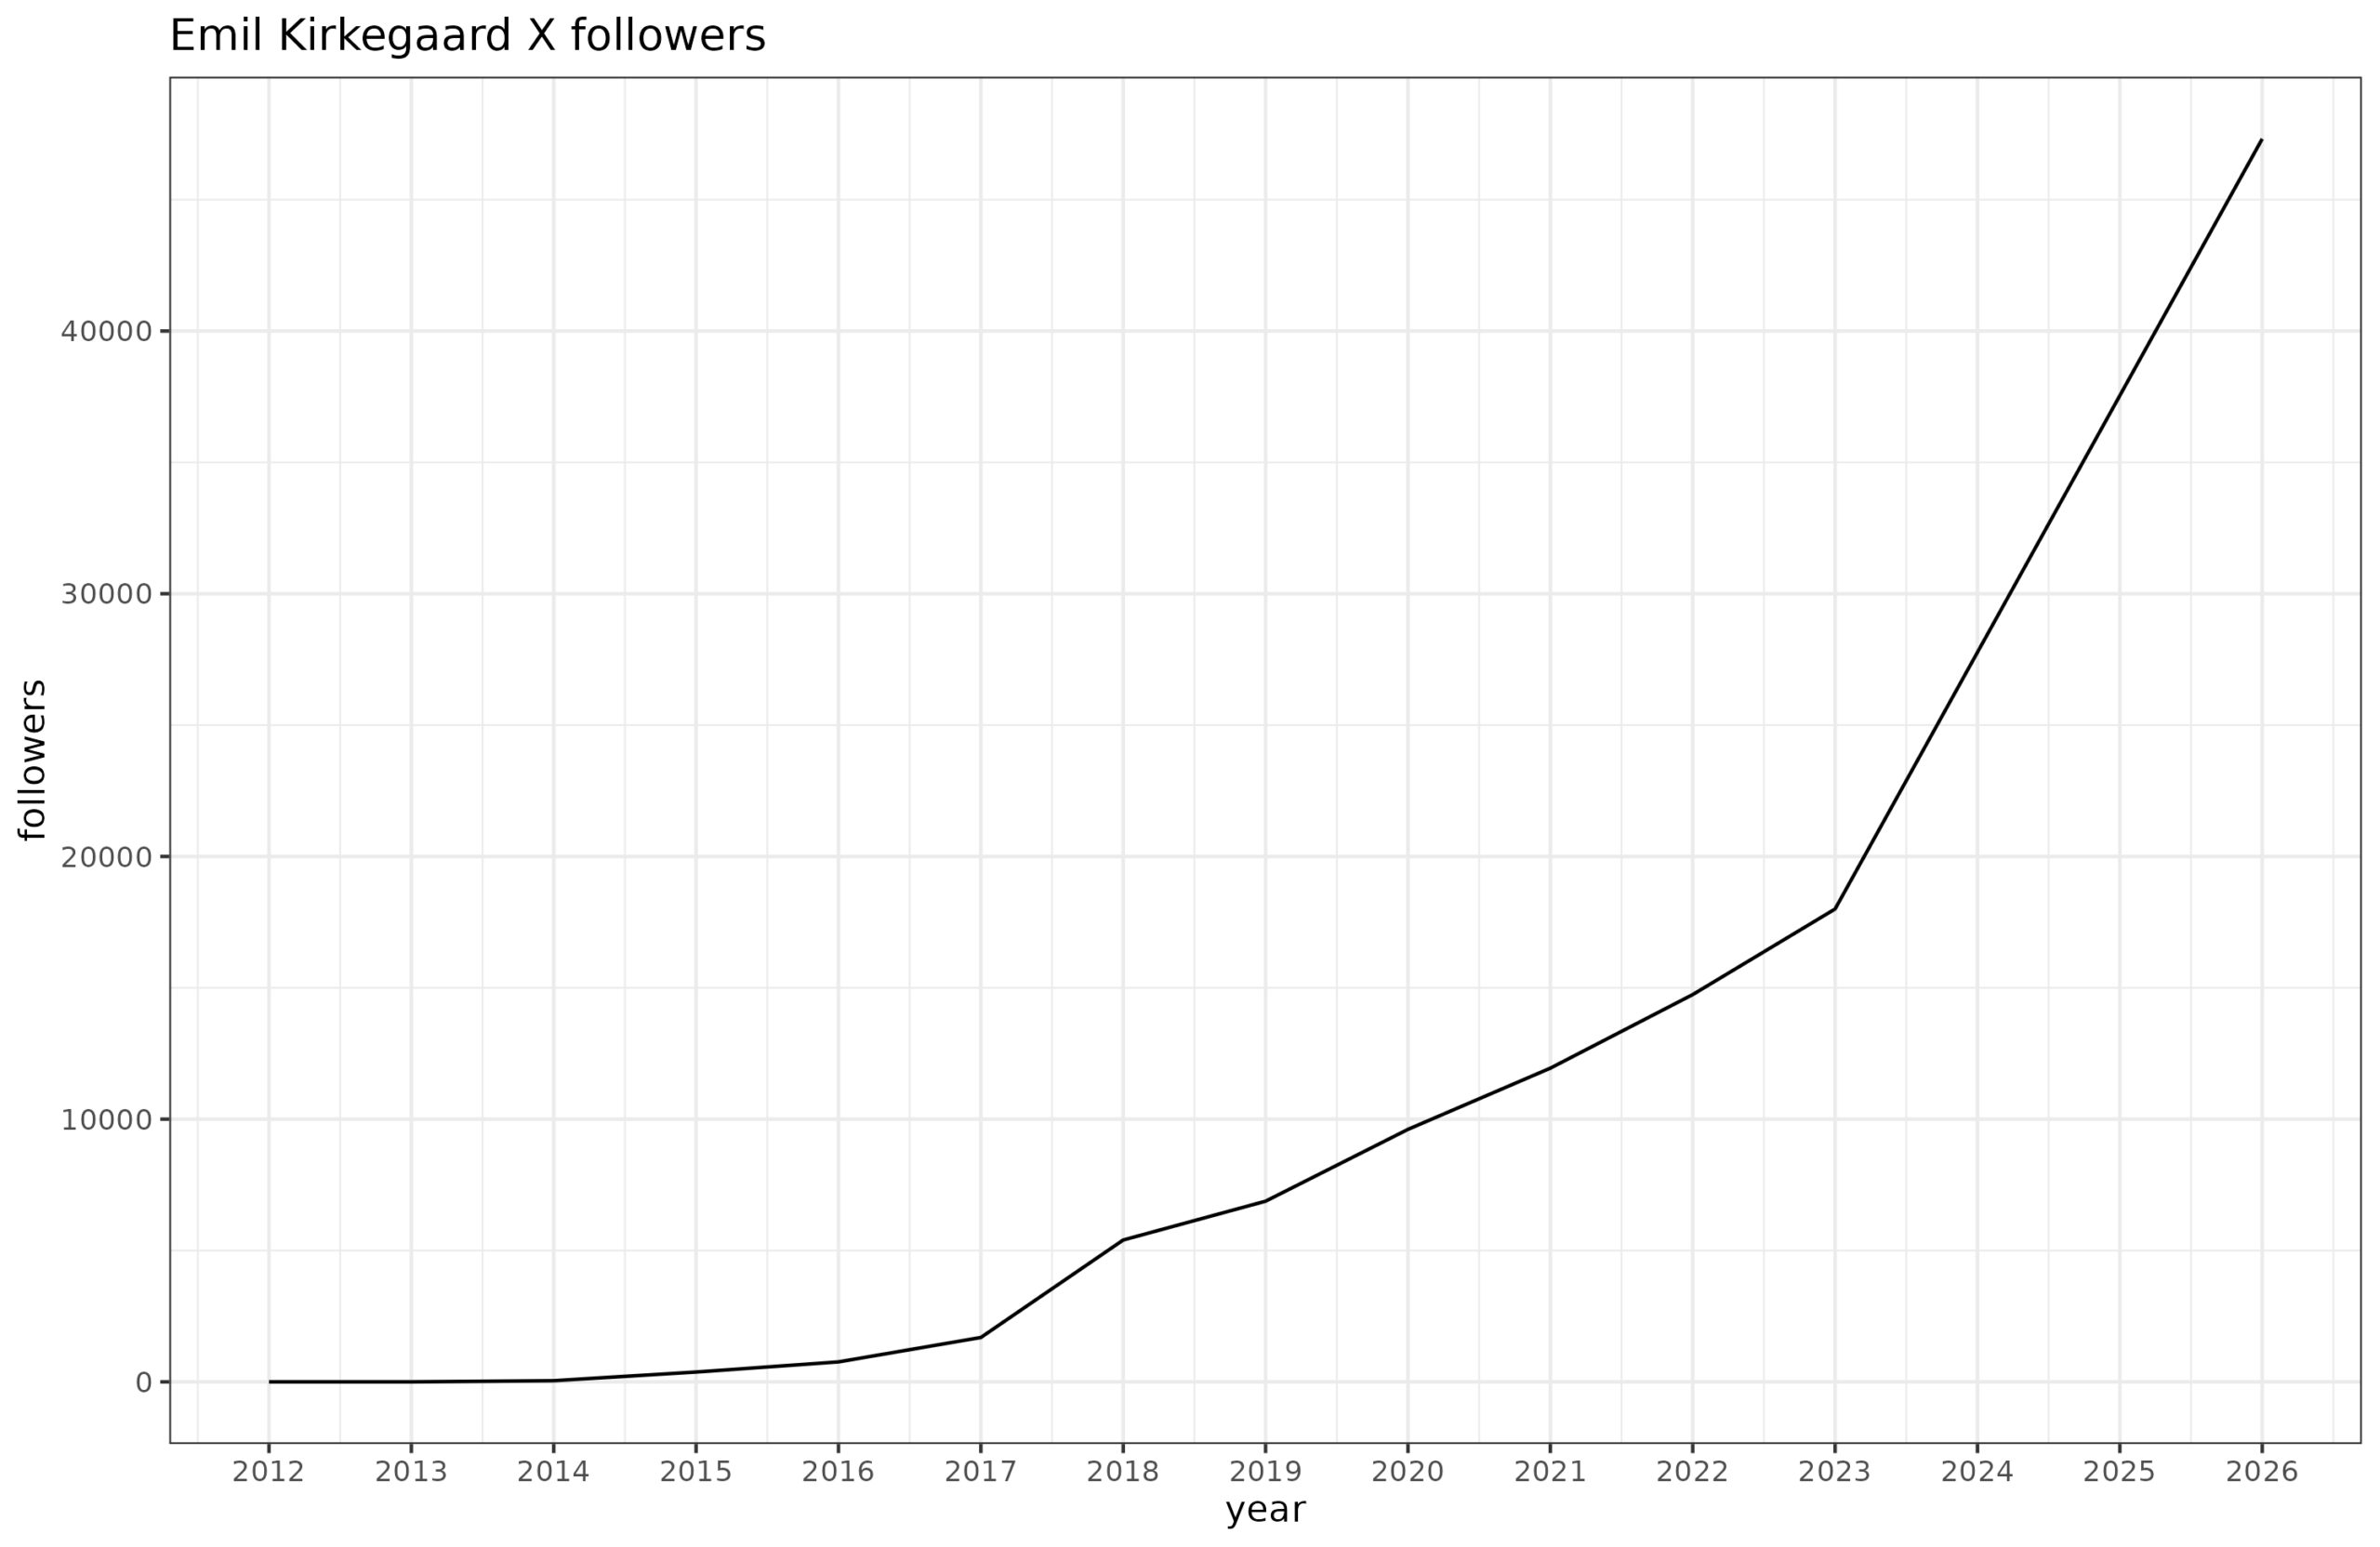
Elon I guess has changed the anti-scraping policy because even IA lacks data for 2024-2025, so sadly I can’t see more details about the explosion. But basically from the last observed value in March 2023 to now, I went from 18k to 47k followers. That’s a big growth. I don’t imagine this has a lot to do with more impressive tweeting, but rather due to the growing public interest in the kind of thing I am doing. This of course reflects in part that Musk bought Twitter and removed a lot of the explicit and implicit censorship that was happening. Similar accounts to mine have also seen tremendous growth. Most impressive is Cremieux’s rise to soon 300k. Let’s hope 2026 continues this fast growth! Without censorship, there is no way to prevent the public from seeing the kinds of results that we post.
SLOC is a terrible metric for programming. A Master Coder proved this in the late 70s (iirc).
The company he worked for demanded a weekly report of how many lines of code each programmer had created. The Master had rewritten a submodule to be far more efficient, and eliminated a huge amount of unnecessary code in the process. He turned in his weekly report as "-2000 lines".
They quit demanding those reports. ^_^
Thank you for the productivity summary. It's very interesting and leaves me awestruck at the volume of high-quality work you produce. Very happy to be a sub.