
Power laws and human society
Harnessing their potential, reducing their costs

Granted, it is a bit of a strange name, a power law. Is that a particularly powerful piece of legislation? Not at all. It is a kind of statistical distribution, where the more famous 80-20 Pareto is a special case (example from here):

Many things follow a normal distribution, or something close to it. Case in point of human height above (in red). The distribution of height is not entirely normal because some rare disorders cause extreme tails to appear (respectively, dwarfism and gigantism), but it's close enough. CNN provides this illustrative example:

The general biological model for why normal distributions appear is that a given phenotype is controlled by a large number of small genetic variations each of which cause only a small deviation from the mean (infinitesimal AKA polygenic model). Adding them up, even if we relax the assumptions, results in a normal distribution (Gaussian, cf. central limit theorem).
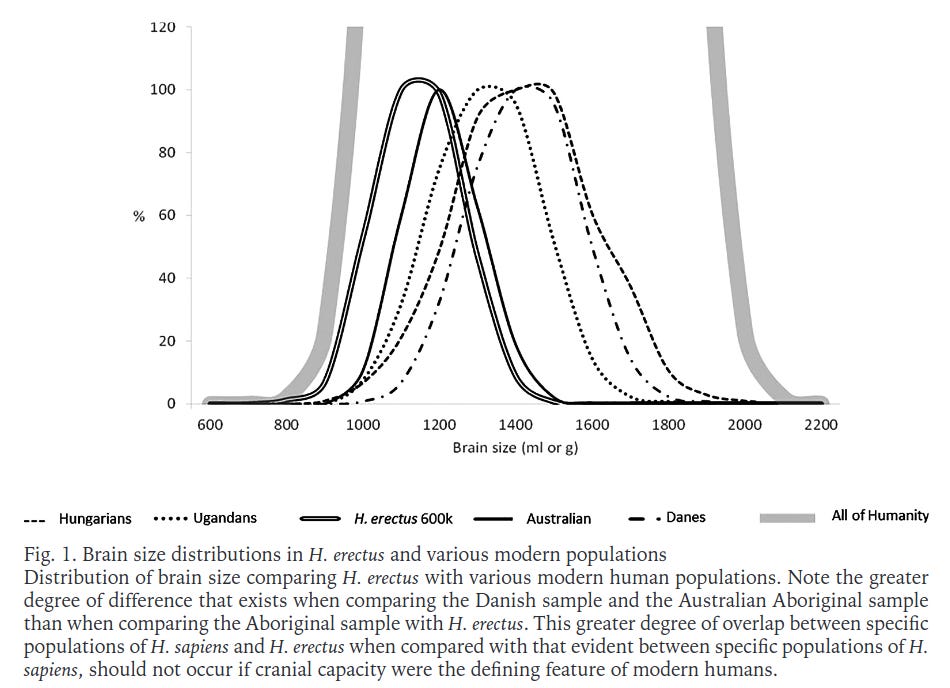
Other size metrics like whole brain volume also follow a normal distribution:
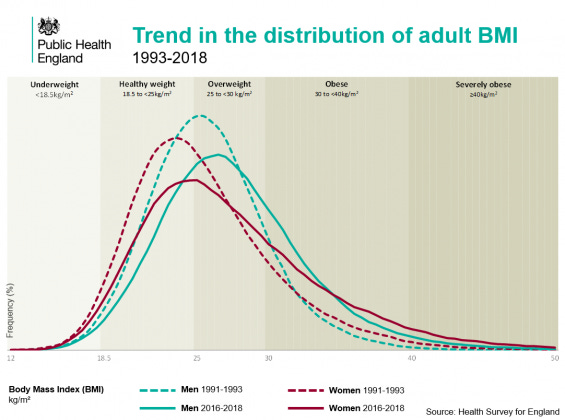
Intelligence famously follows an approximately normal distribution as well, with a fat left tail but not right tail (there are no genetic disorders that make you extremely smart, but many that make you extremely dull). However, not everything that is strongly polygenic follows a normal distribution so closely. Of particular interest is the BMI distribution and its historical changes:
Body Mass Index (BMI) is a bit of a weird metric. It's a quick and dirty approximation of body fat %, based on height and weight and an assumed scaling factor (BMI = weight[kg] / height[m]²). It fails to be invariant across age and races, but it works decently well as a first approximation. It correlates 0.77 with fat % across sex and age. In other words, it's akin to measuring general intelligence using only vocabulary (g-loading about 0.80). The BMI distribution has a long tail. Is this an artifact of the BMI metric or a real finding? I'll blog my full results tomorrow, but the answer is that it's a real thing. The takeaway from this is merely that not all distributions that are caused mainly by polygenic variation ends up as a normal distribution in the end. The reason why is important. Power law distributions can result from multiplicative functions. Francis Galton famously posited a 3-part model for eminence (genius):
The particular meaning in which I employ the word ability, does not restrict my argument from a wider application; for, if I succeed in showing—as I undoubtedly shall do—that the concrete triple event, of ability combined with zeal and with capacity for hard labour, is inherited, much more will there be justification for believing that any one of its three elements, whether it be ability, or zeal, or capacity for labour, is similarly a gift of inheritance.
In this model, if you do no work, you end up with zero production, which is likewise true if you have zero skill. The more the variables are correlated, the more of power law their multiplication will yield. They can end up correlated if incentives are in place. If you are good at programming, people will pay you to program for them, which makes you a better programmer, and also makes you program more. This leads to a positive feedback loop that will end up producing a power law distribution. I generated some toy data to illustrate the point:
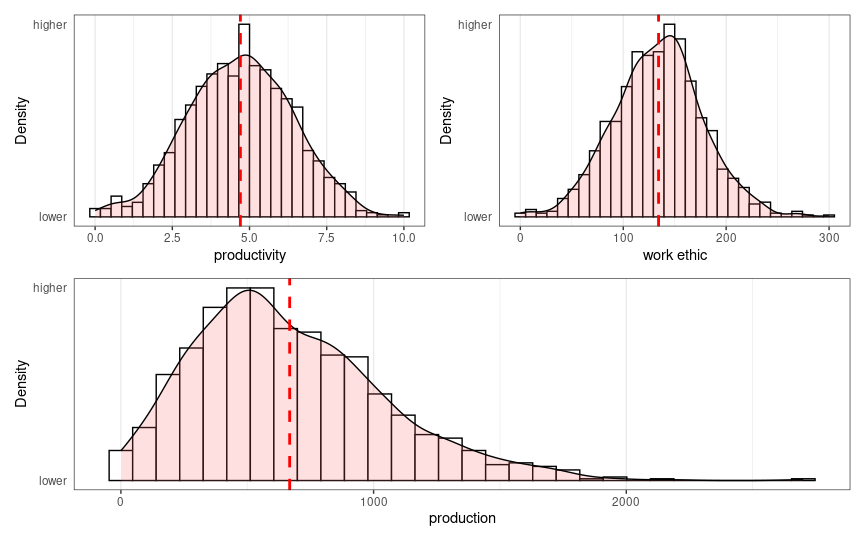
In this situation, productivity (production per hour) has a normal distribution with a mean of 5 units (of whatever). Work hours (work ethic) similar, but with a mean of around 140 (close to 4 weeks of 40 hours). They correlate at 0.50 and their product is the distribution below. You can see the beginning of the long tail. The top 10% workers produced 22% of the total production. The real world, as we will see, is far more extreme than this.
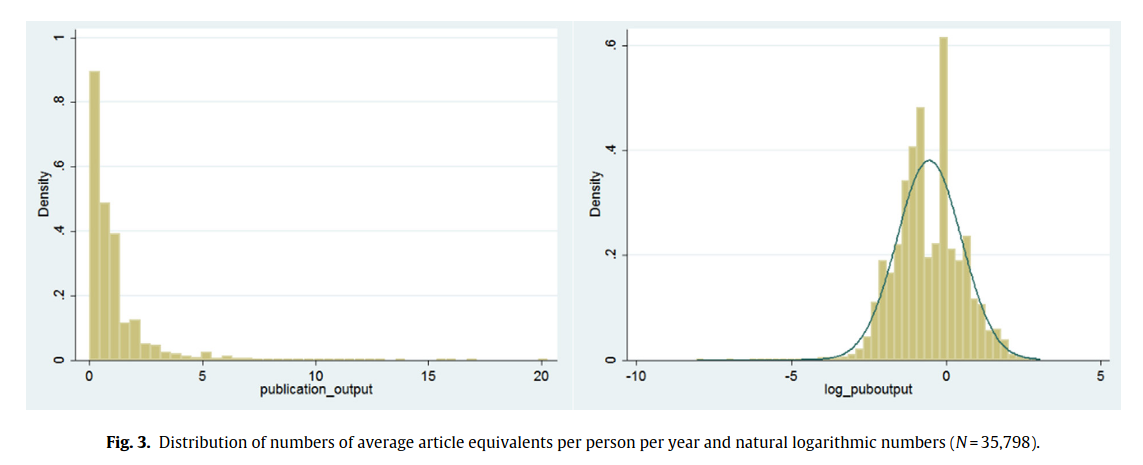
Let's talk science, specifically scientific publications per researcher. Only 1% of known scientists published a paper every year in one 2014 study, but this 1% subset were involved with 41% of all papers. The extremely skewed nature of scientific productivity, whether lifetime or per year, has been noted as far back as 1926 (from this study):
It is well known that there are large differences in the publication output between scientists: a relatively small proportion of scientists contribute to the majority of the publications. In 1926 Lotka formulated the famous inverse square law of productivity, which states that the number of authors producing n papers is approximately 1/n2 of those producing one (Lotka, 1926). This means, for example, that of all authors in a given field, 60 per cent will have produced just one publication. A large number of later studies have confirmed that there exists a highly skewed productivity pattern in scientific publishing (e.g. Allison and Stewart, 1974, Price, 1986, Reskin, 1977). However, it has also been shown that the differences in scientific publication rate at the level of individuals are fewer than indicated by Lotka, and that Lotka's law overestimates the number of papers produced by the most prolific scientists (Kyvik, 1991, Potter, 1981).
Even if we subset to a relatively homogeneous set of Norwegian academics (12k), it looks like this:
In terms of personnel, it would seem one could cut 50% of the staff and not see much of a decline in the publications. Arguably, this is not because the non-publishing people help out the others, because if they did, their names would be on the papers too. Rather, most staff produced nothing at all in some years, while others produced 10+. This is true even if one tries to explain the variation among researchers using common researcher characteristics:
This study investigates how scientific performance in terms of publication rate is influenced by the gender, age and academic position of the researchers. Previous studies have shown that these factors are important variables when analysing scientific productivity at the individual level. What is new with our approach is that we have been able to identify the relative importance of the different factors based on regression analyses (OLS) of each major academic field. The study, involving almost 12,400 Norwegian university researchers, shows that academic position is more important than age and gender. In the fields analysed, the regression model can explain 13.5–19 per cent of the variance in the publication output at the levels of individuals. This also means that most of the variance in publication rate is due to other factors.
In other words, at most 20% of the variance could be explained by the observed characteristics, meaning that there were massive individual differences left unexplained. Furthermore, controlling for academic position underestimates the contribution of individual differences, since the more productive researchers are more likely to get promoted to senior positions. The 10x researcher is real.
How common are such power law distributions in the world of work? Pretty common according to an influential review from 2014.
Aguinis, H., & O'Boyle Jr, E. (2014). Star performers in twenty‐first century organizations. Personnel Psychology, 67(2), 313-350.
We argue that changes in the nature of work in 21st-century organizations have led to the emergence of star performers—a few individuals who contribute a disproportionate amount of output. We describe how stars negate the long-held belief that the distribution of individual performance is normal and, instead, suggest an underlying power law distribution. In addition, we offer 9 propositions to guide future empirical research on star performers and an underlying power law distribution of individual performance. We describe how the presence of stars is likely to affect all individual-, team-, and firm-level management theories addressing individual performance directly or indirectly, but focus on specific implications for those addressing human capital, turnover, compensation, downsizing, leadership, teamwork, corporate entrepreneurship, and microfoundations of strategy. In addition, we discuss methodological considerations necessary to carry out our proposed research agenda. Finally, we discuss how a consideration of star performers has important implications for management practice.
(For criticism of this paper, see Beck et al 2014.)
Job performance in many sectors is hard to measure objectively, but sports provides a good case:
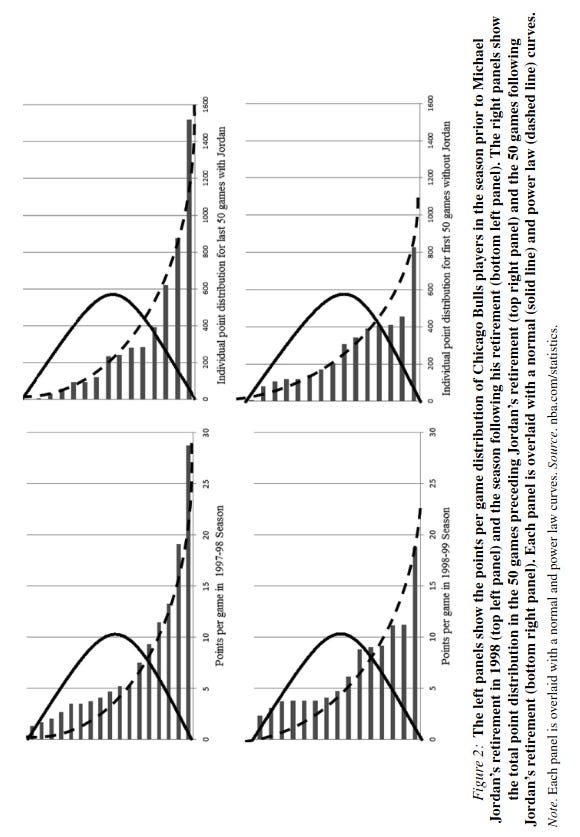
Most points are scored by a small minority of star players. They note that similar findings are found across many other areas, e.g. the military:
Even in industries where one might expect a normal distribution such as the military, given their emphasis on uniformity, hierarchy, and regimented activity, stars still emerge when performance is operationalized based on outcomes such as the number of downed aircraft (Toliver & Constable, 1998).
The same debate exists in programming where there are endless debates about the 10x programmer (mostly about how it's a myth). It's both easy and hard to quantify programming productivity. Everybody can scrape Github or internal code bases and see who commits how often or how much. This is easy to quantify, but does it measure productivity? Sometimes, a small but difficult piece of code can be hugely impactful if it speeds up a critical part of the software ecosystem. This would not be captured in a crude index measuring lines of code. A nicer approach is to have teams compete at completing the same tasks and see the differences:
Tom DeMarco and Tim Lister have, since 1977, conducted the “Coding War Games”. This is a public productivity survey in which teams of software implementors from different organizations compete to complete a series of benchmarks in minimal time with minimal defects. They’ve had over 600 developers participate.
Granted, this data is very old, but they did find that:
They did find that there were huge differences between the organizations. The best organization worked 11.1 times faster than the worst. In addition, those that worked fastest developed code that passed the acceptance test. Case closed?
Overall, I would say that my personal experience fits with this. Some people (and teams of people) are just much faster at everything and produce better code. Experience cannot explain most of this variation, aside from the fact that new coders are worse.
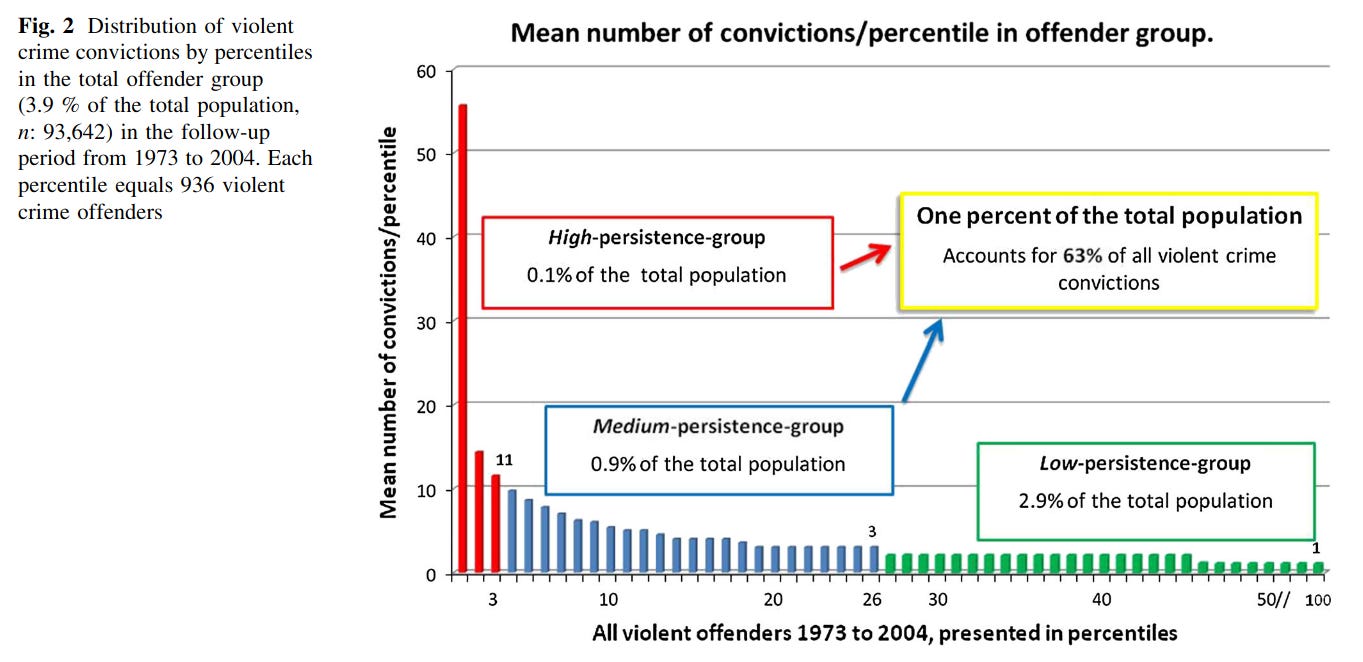
What about something else again, crime? It's not what most of us consider work, but for some people it functions as work. We find the same thing. That one Swedish study famously found that 1% of criminals had 61% of convictions for violent crime:
This kind of finding is not limited to humans. I managed to find a study of dairy cows, which noted that "There was considerable variation between cows, with the highest average milk yield among the cows being 23 L/d and the lowest being 1 L/d, with an average of 8 L/d.". This would mean the best and worst cow had a 23x difference in milk yield. They didn't plot the distribution, however, so we can't say what it looks like.
Implications of power laws
Why care about the distribution of job performance broadly speaking? I think it has far reaching consequences. First, if most productivity among developers is concentrated in a few people, it means that getting hiring right is even more important. There's also the possibility of net negative workers, who create such bad code that they effectively contribute a negative amount of work as more time and money is wasted dealing with their mistakes. Based on this idea, it should be possible to fire large proportions of staff at a company and retain most of the productivity. Is this possible? Yes. Elon Musk fired 80% of the staff at Twitter/X. Many predicted it would immediately collapse, which it didn't. Granted, many of these workers were not developers (there was apparently a human rights team??), and I don't have the numbers for developers only. It would also mean that one could fire large numbers of employees in the public sector and not see much decline, but still save a lot of money and reduce taxes. A friend of mine who works in the federal government tells me that most workers in his office perform poorly by objective metrics (case filings, overturned cases), yet are not fired due to diversity hiring/promotion and generally government regulations preventing firings. Musk's DOGE plan to save money in the public sector thus should have a good chance of success.
Second, incomes also follow a power law-like distribution. This is true for society overall and within a given sector. Sectors vary in their degree of skewedness with some, like writing and acting, having extreme distributions. Many people complain that CEOs and high ranking staff make too much money. But if job performance follows a power law distribution, then this makes a lot of sense. If company leadership makes decisions concerning 100s of millions of dollars, it makes a lot of sense to pay very high salaries. If a small mistake could cost 10 million, then hiring the best possible CEO for an annual salary in excess of 1 million is economically sensible.
Third, and on the same note, let's talk taxes. Most developed countries have a progressive taxation system, meaning that the more you make, the larger proportion of your marginal income you have to pay. This disincentivizes the most productive people from working as much as they could or would otherwise want to. One can do some modeling on this, but I think that if this system causes right tail highly productive people to be e.g. 10% less productive, this has quite large effects on the total productivity of a country.
Fourth, in terms of scaling up science and technology to achieve faster progress, power law distributions of performance mean that extra hiring has very strong diminishing returns. No matter what the distribution of productivity is, hiring more people will lead to diminishing returns, as the marginal hire is will be less competent on average (given imperfection identification of talent). However, the more the fraction of total productivity is clustered on the right tail, the more skewed the distribution is, the stronger the diminishing returns will be. There are sometimes debates about this where this point is missed. Never have so many people worked in science as currently, but innovation rates per capita are falling.
Fifth, and most generally. One of the most important things a society can do is ensure that we get the most out of the most productive people, and in the same vein, suffer the least damage from the most destructive people ('negatively productive'). This should be given more attention. Speaking of the destructive people, career criminals are extremely costly to society. It would be eminently sensible to scale the length of sentences by the number of prior convictions, or use something like a 3-strikes law. In the Swedish case, 61% of violent crime was due to 1% of the population. If this relatively small group of 100k people were effectively prevented from causing problems by means of confinement or strict monitoring, violent crime in Sweden would decrease by over 50%. In general, a large proportion of the criminal justice system's time is spent dealing with the same repeat offenders because we fail to deal effectively with the power law distribution of crime. On the positive side, if most innovation is driven by a relatively small number of people, society would be very wise not to get in their way, whether by means of taxation or social pressure against eccentrics. Norway provides a great example of what not to do.
What I want to know is why this is so hard to predict? I agree with the conclusion, I've seen power law differences in performance in athletics, in work, and in other domains many times.
I've interviewed and hired a lot of people in my day, and it's an enduring source of frustration to me that discerning who is going to be vastly better than who is a genuinely hard problem that you can't necessarily predict in an interview.
I've read Cowen's Talent, and he definitely has some good ideas in there, and I do try to use more orthogonal interview questions and evaluate the drive for self improvement in their lives, but signal to noise is still *high.*
Internships are about the best you can do. Anyone else have any tips / ideas?
Thanks for the analysis of distribution statistics.