
Reader survey 2022 results
Fun results!

So let's see those survey results from the 2022 reader survey. Some of them are funny. There were a total of 318 takers, of which 125 were complete (answered every question). Since I set up some questions to be skippable, this doesn't really mean that much.
Overall, I am happy to report that 100% of takers consented to the survey.
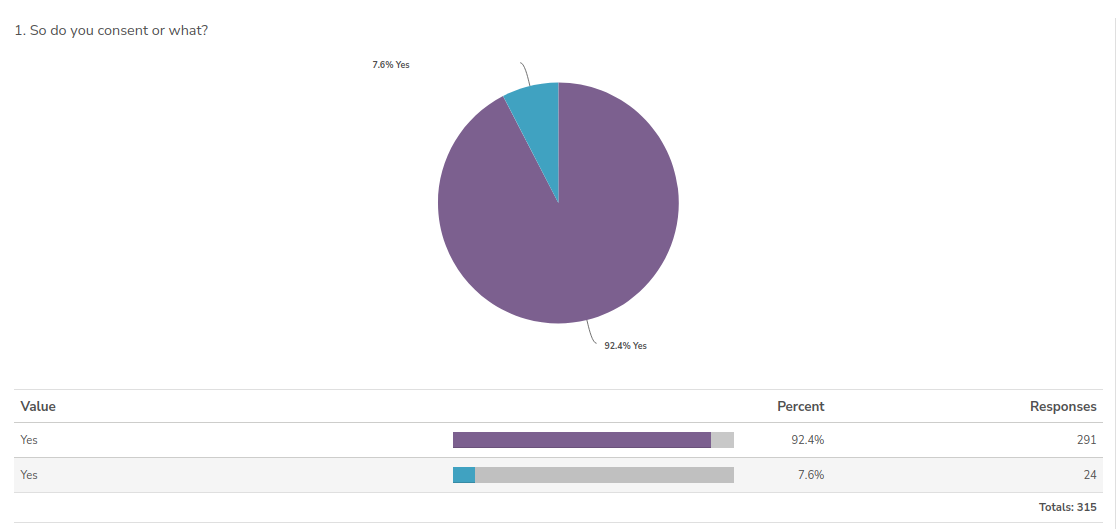
We also learned that about 92% of people click "yes" and OK without reading the second option, maybe.
It appears I theoretically guilted 15 people into signing up for the paid subscription:

Before posting this I had 2116 subscribers and 38 paid, so that makes 1.8%. Paid subscribers were 4.6% of the survey takers, which is still kinda low, but 2.6x the ratio. As you would expect, paid readers are more interested in the content and more likely to take a survey about it. Also, after this survey, I gained only 3 paid subscribers, so those theoretical 15 before turned out to be 3, or about 20%. These could have arisen without intervention, so I guess guilt tripping in surveys doesn't work. Sad!
In terms of research that readers would like to see, it looks like this:

The top 5 topics all concern group differences: whether their origins, effects, or perceptions. The crowd demands group differences research and who am I to question democracy? Surprisingly little interest in Wikipedia biases, despite this being one of the top contributing factors to, well, misinformation about science of human diversity.
What about politics? Political compass memes is the best subreddit, after them having banned everything else fun. What does the political compass look like?

So it looks overall like center right, or right-libertarian is about the average reader. But it's a bit hard to say because of the ceiling effect of the coloring. I downloaded the data to check, and the mean values are 68 and 52, so actually the distribution looks like this:
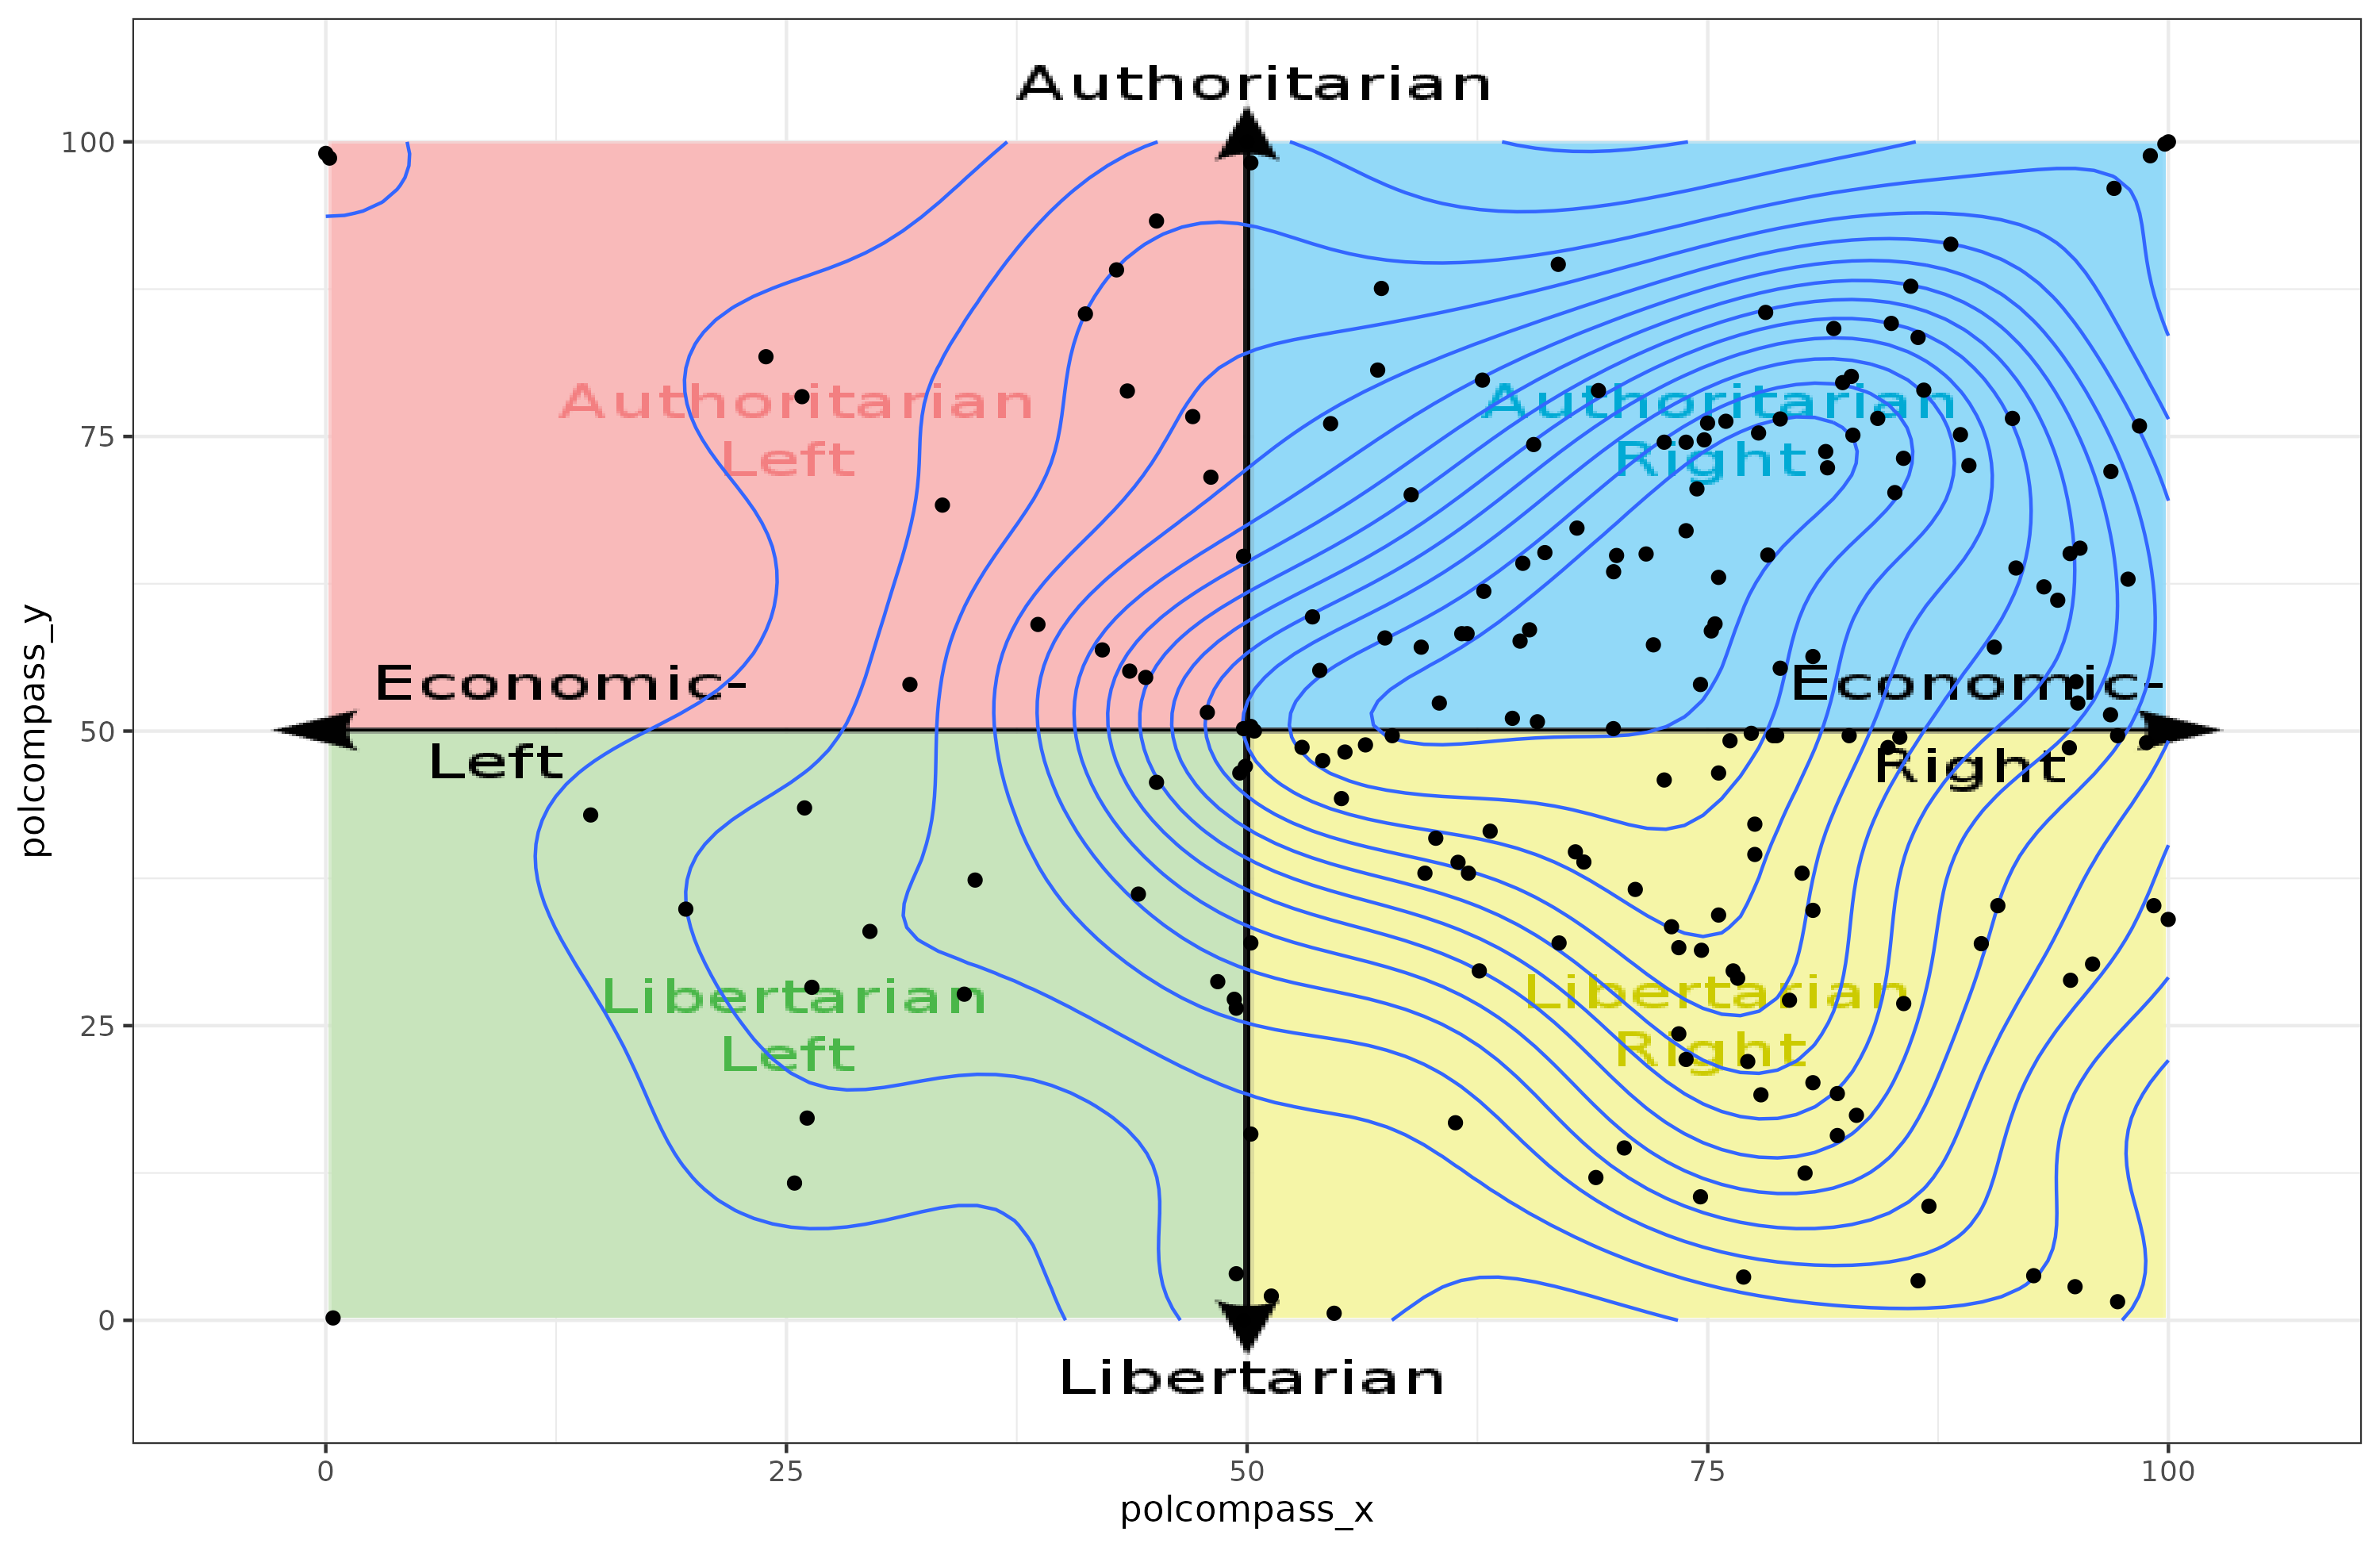
The curves show the density, with the most density in the innermost regions. They don't look exactly alike because the survey gave me corrupted data for 4 people (n's = 189 vs. 193).
OK, one thing is (self-rated) position, what about political labels?

So the most common ones were the two libertarian ones, "libertarian" and "classical liberal", but "conservative" was also pretty common. "Nationalist" and "ethnonationalist" weren't so common as one might expect, and "alt-right" is just below 20%. Somehow there are 3 communist readers, and 5 feminists. Are we officially diverse now?
What about political changes in the last five years?

So mostly people to the right, I guess in reaction to BLM, trannydom, drag queen shows, infinite-1 day COVID lockdowns and so on. There's also a question about former libertarians specifically, as there was previously suggestions of a libertarian to alt-right pipeline:

The most important metric of any blog, aside from IQ, is the autism quotient, so how are we doing?

In hindsight, this was a terribly inautistic way to do it. I should have linked to one of the online autism self-report scales, and asked users for their score. Fortunately, later on, we asked about diagnoses too:
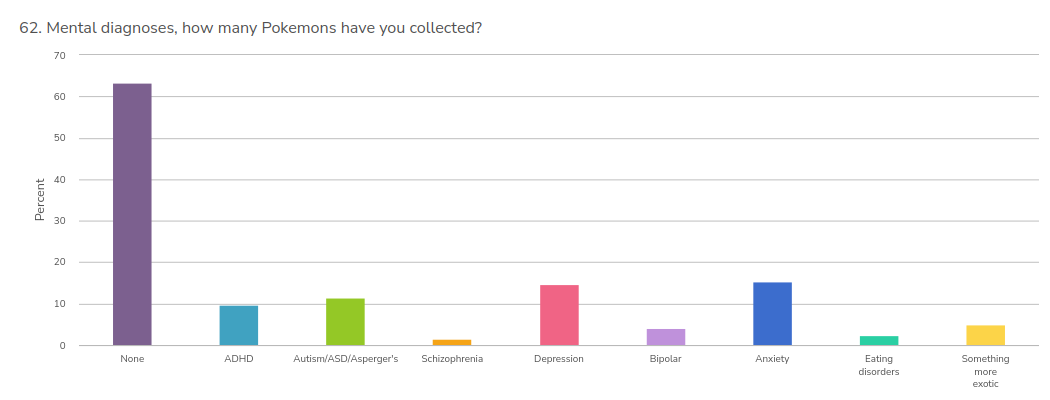
It looks roughly like one would expect from a typical Rationalist meetup. Most people don't have anything too severe (schizophrenia, eating disorders), but the usual suspects are kinda common (ADHD, ASD, depression, anxiety). In terms of happiness, people were doing fairly well:

Some 60% were happy or very happy, only 13% were unhappy or very unhappy. Large neutral group!
In terms of age, we are somewhat on the younger side, but not that much:

Mean age is 36, SD = 14. In light of this, the number of children people already have is not so surprising:
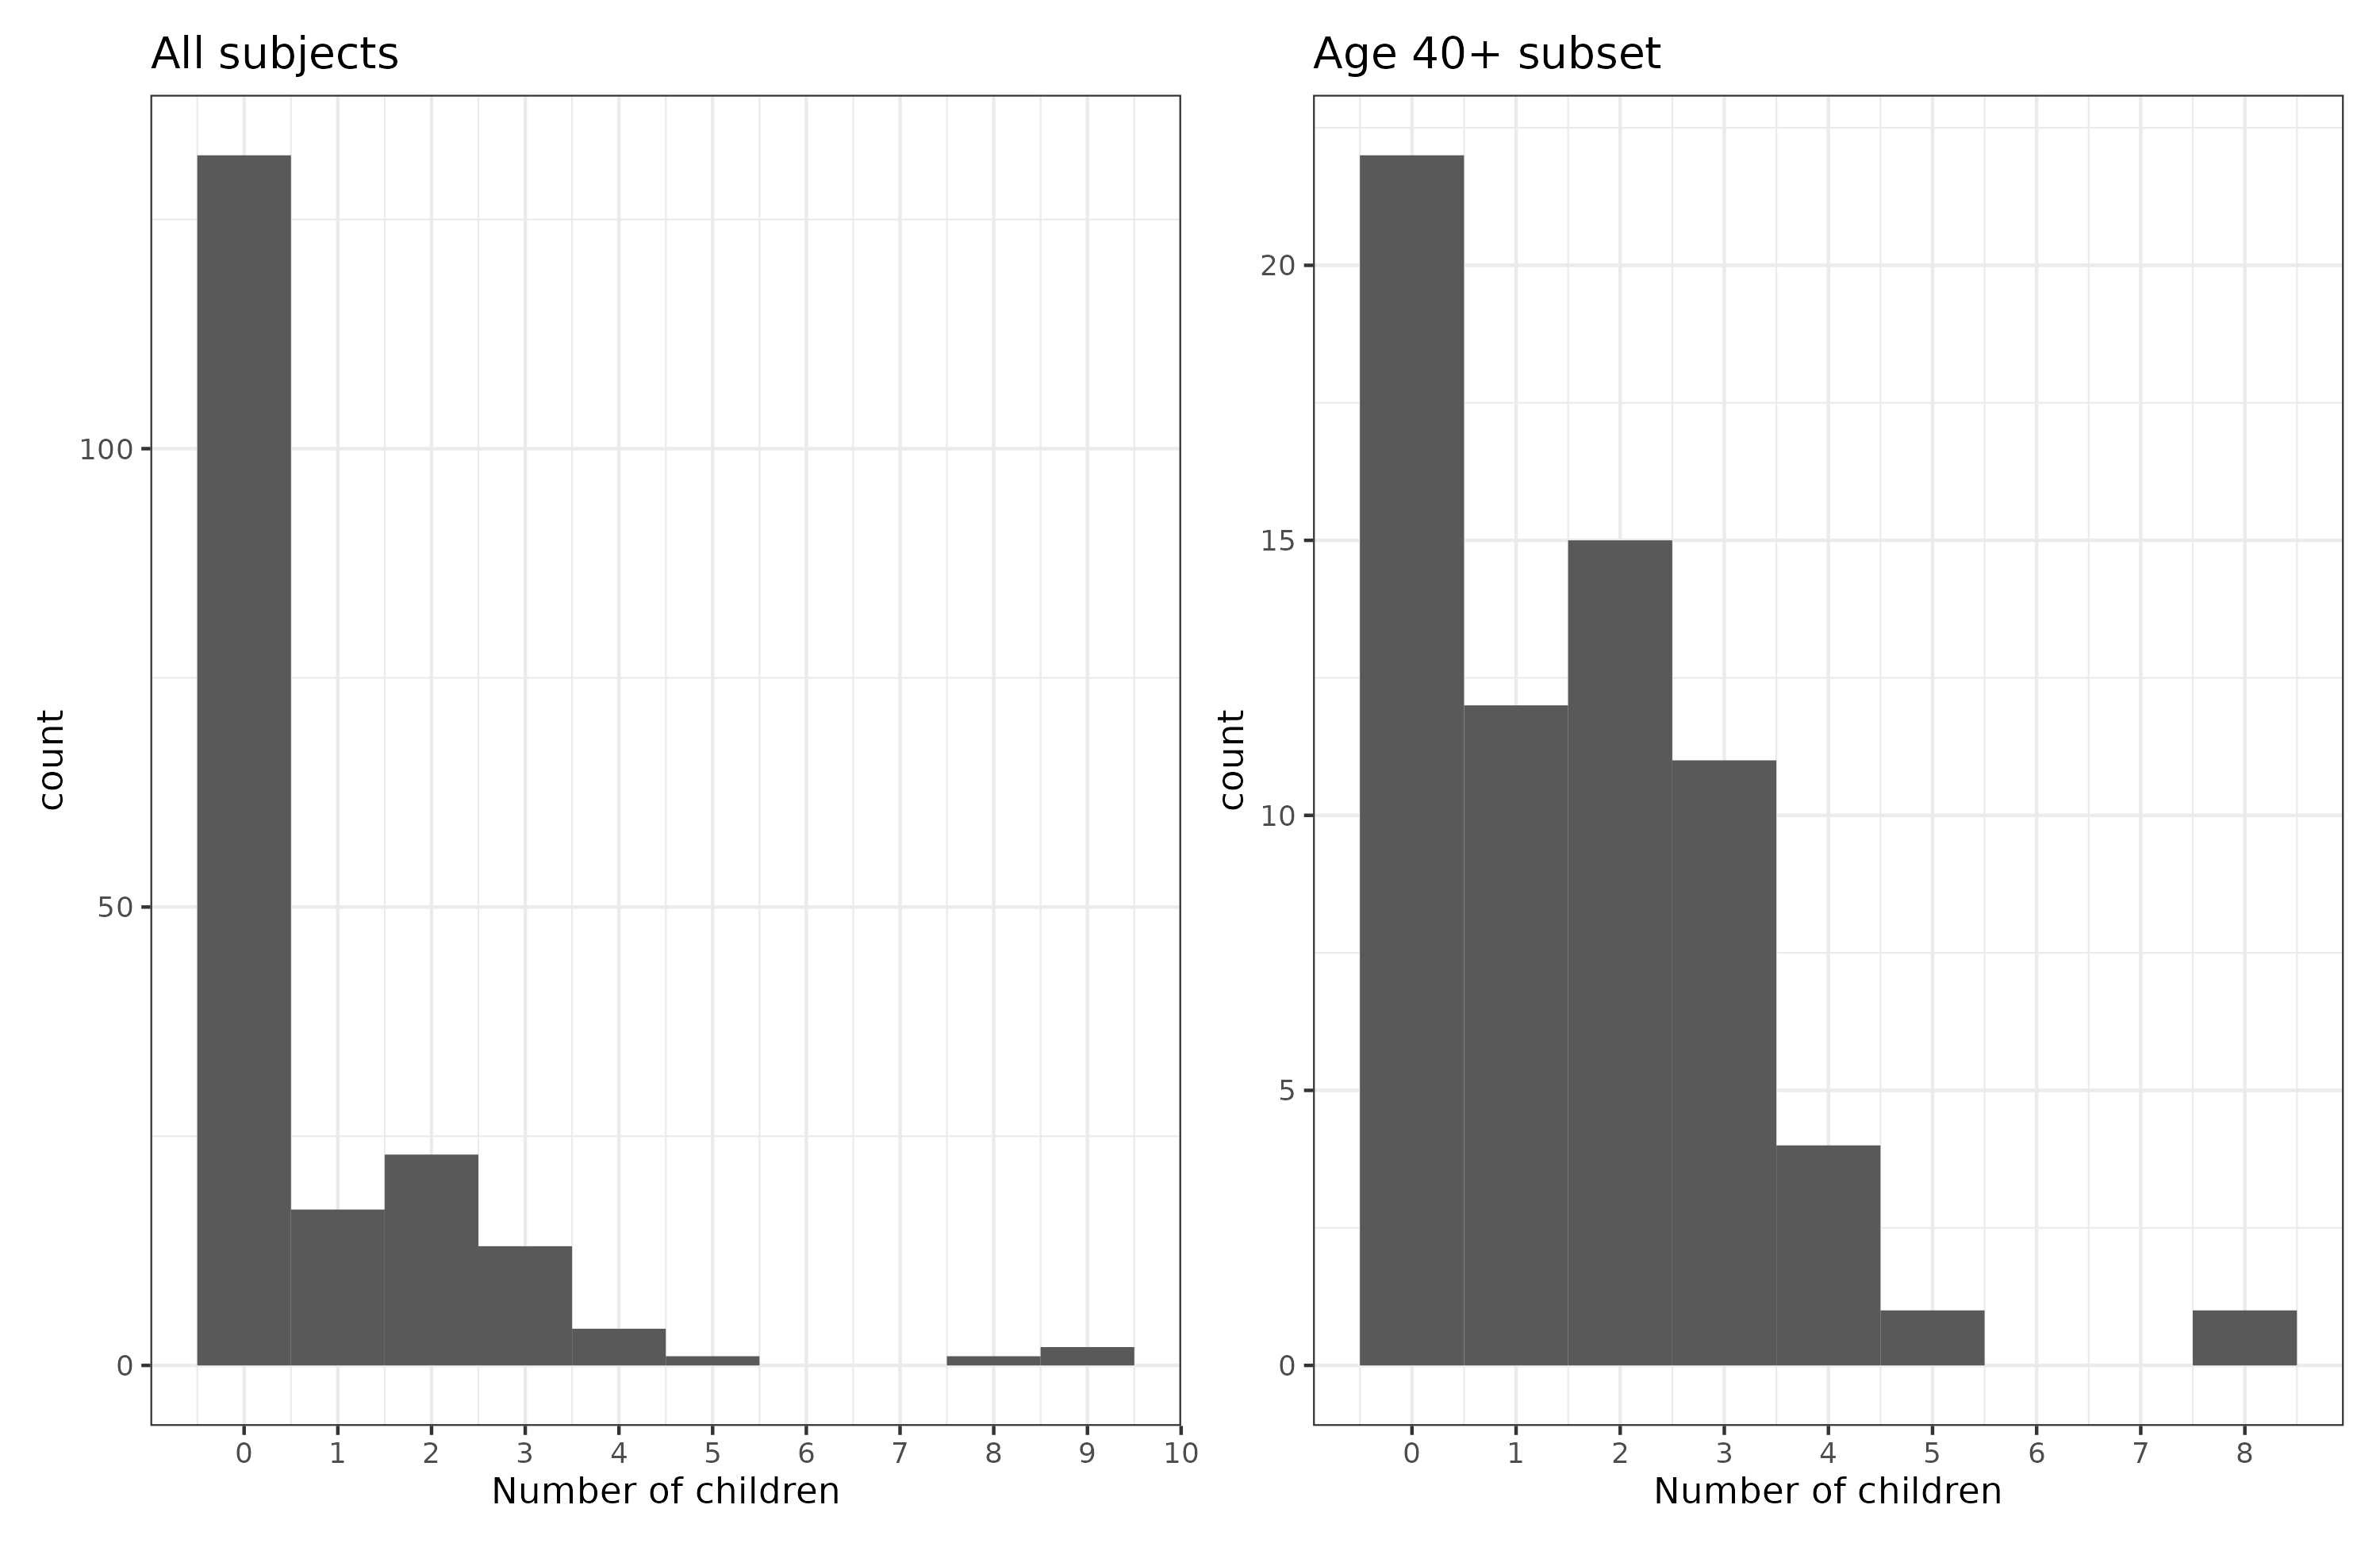
The mean is 0.77 in the total sample, but 1.58 in the 40+ sample. That's surprisingly high considering the autism and intelligence of the sample, so we can probably put that up to pro-natalist personal policies and general lifestyle conservatism. Speaking of that, how many children do people expect to have?

So one person wants to be Ghengis Khan, another was oddly specific with about 57 kids (or just clicked any random number in the middle). But excluding them, the counts look rather healthy with a mean of 2.91. Realized fertility is usually quite a bit lower than expected/desired fertility, maybe by 33% or so. There are still some 20% who expect to remain childless, but not necessarily desire to do so. This kind of number is not so uncommon for men in history. And you are mostly male:

And not very trans:

Looks like about 3% trans, and most of them prefer not to be trans. In the same light, you're mostly heterosexuals:

Not too surprising either, but not even that far from the population expected value. Given that homosexuals are often over-represented in elite occupations, this might be expected to be higher, but it's probably due to the politics confound, as non-heterosexuals are strongly left-wing.
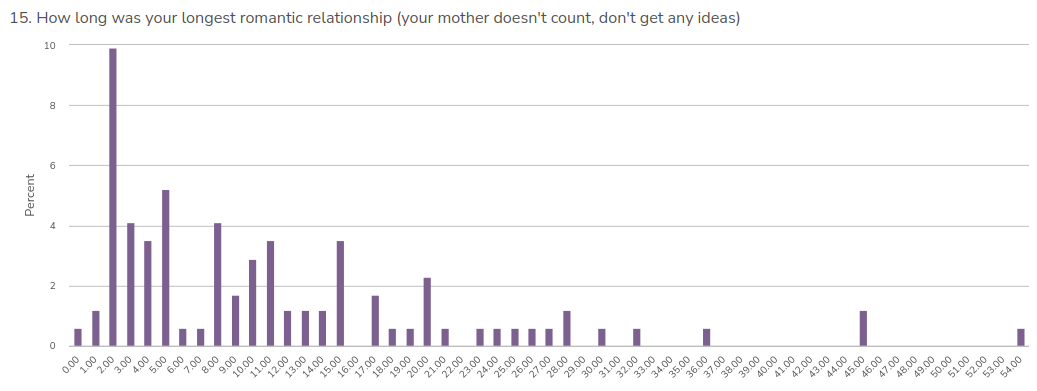
In terms of relationships, it is not looking that bleak:

And of those with romantic relationships, they were pretty long:
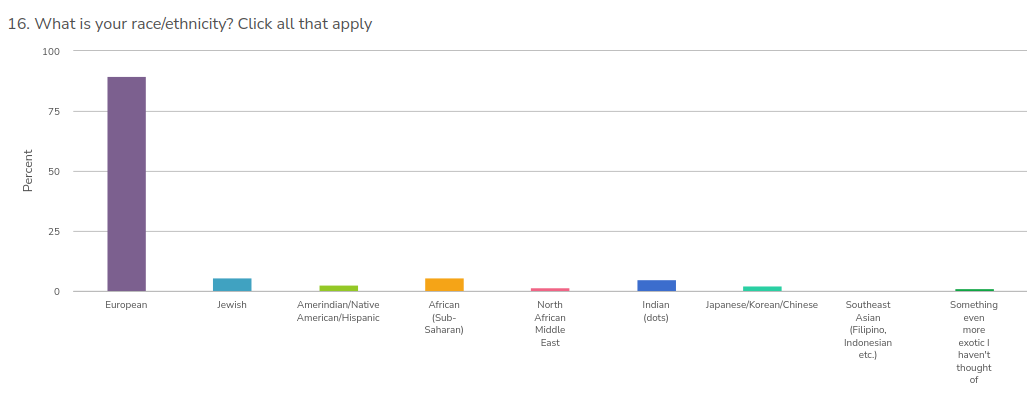
In terms of race/ethnicity, it's mostly Europeans, with some notable minorities. I am kinda surprised East Asian is that low, but maybe that's because they are too busy with their finance jobs to fill out surveys. Filling out mostly useless surveys is a prototypical European do-gooder thing to do. Or maybe it's more of the typical Coffee Salon demographics, selection for openness to ideas.
In terms of religion, it is pretty atheistic as you would expect:

Most readers I talk to basically hold the opinion that religion doesn't make a lot of sense from a rationalist-scientific perspective, but nevertheless it is a good and natural thing as it promotes group unity, family values/fertility, and probably health. There's quite a few former new atheist types, including yours truly:

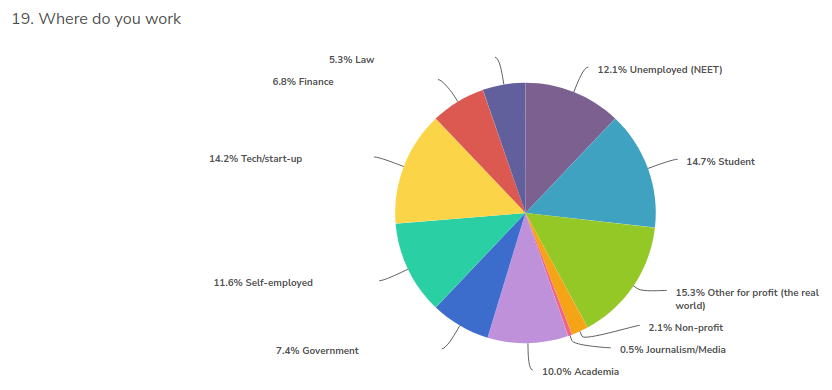
Jobs are pretty diverse:
Education level is pretty decent, despite many being quite young:

I stupidly forgot to include an option asking people if they were done taking formal education, so we can't filter them out, except by age. If we filter by age 35, we get:

So 20% with PhDs, against an expectation of 1.4% or so in USA (4.5 million out of 330 million). Very elite!
What about birth order effects? All the cool bloggers are now proudly presenting their birth order effects as a measure of eliteness (firstborns really are smarter etc.):

There's not that much to see. The sample is too small. There's 67 people with one sibling, and of these 61% are first borns, but the confidence interval is 0.485 to 0.726 (p = .08 for test vs. 50%). I guess I will try again next year when I have more survey takers (if Substack doesn't shut me down that is!).
Unrelated to this, when I post on Twitter or even in some private groups, people will complain if I link to anything Aellagirl. So I included a weird question about her value as a prostitute:

It seems she has rather divided opinion among my readers. About 35% of people are basically maximally repulsed, but another 5% are happy to fork over 1000 USD for an hour with her. I guess Aella doesn't care about the people on the left side of the plot, it is all about getting people into the right tail.
Speaking of sex, it appears we have both chads and virgins with us:

These are limited to heterosexual males aged 30+. The mean number is 17.3, which is kinda crazy, and driven by the outliers. The median is 7, which seems about reasonable in this day and age.
Getting to the important stuff, what about the programming languages?
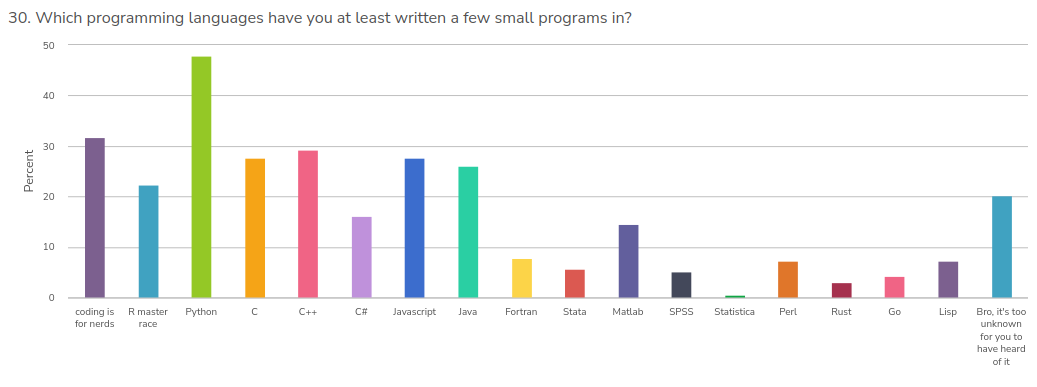
Python wins, but there's a good showing for most stuff.
Some time ago, Scott Alexander wrote an essay about Murderism, I mean racism, and how it's difficult to define. I came up with two kinda common definitions and wanted to see what people prefer:
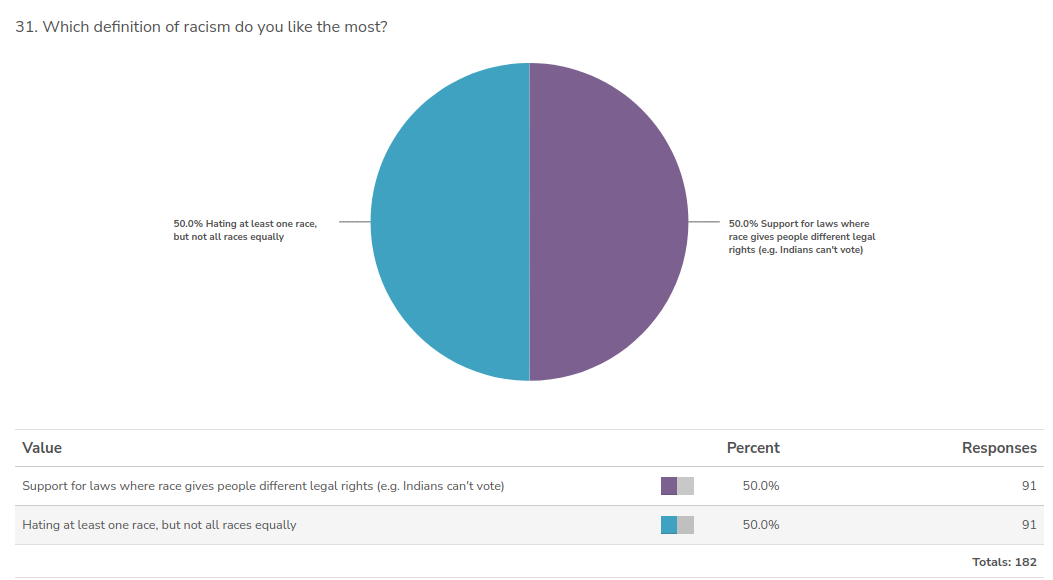
Amazingly, it came down to a direct tie with 182 votes. Clearly, no one can agree on what this word means, not even on a niche blog about the topic. Speaking of that, how 'racist' are people?

The mean estimate is 73% and the median is 80%. This is basically Rushton and Jensen's 2005 position. In the Rindermann survey of researchers, the mean was about 50%, so the readers here are probably more on the hereditarian side. Speaking of their paper, does this estimate relate to politics in the obvious ways?

There was no sex difference to detect (but only a few women), younger people were probably more hereditarian (p = .02), economic right-wingness predicts higher heritabilities and so does more libertarianness! It appears authright is not the 'most racist', but rather libright (probably, p = .01). Maybe this has to do with the family-focus on traditional conservatives, who thus typically believe in the importance of motherhood (libright will literally sell you a baby).
In terms of who likes whom like Richard Hanania did in his survey, here's the results:

The results show some obvious stuff, like people don't like Mao or Hitler or Stalin much (phew!). In fact, Putin is also quite unpopular too. The most popular people are myself, Steve Sailer, Scott Alexander, Lee Kuan Yew, Charles Murray, not in exactly that order. I don't know why you don't like Noah Carl more, he's maybe the nicest person I know. More surprising was how unpopular Nick Fuentes and Richard Spencer were, even Trump is not that popular
It's possible to make a kind of position of these people using factor analysis of the likes. Unfortunately parallel analysis said to keep 6 factors, but that would be difficult to plot. If we just keep the 2 most important dimensions in the data, they look like this:

Note: the two factors can 'explain' 26% of the variance in scores, so obviously, there are some other patterns in the data that this plot is neglecting to show. Ignoring that, it looks like Y axis is a kind of fondness for dictators, with Hitler winning, but Stalin being close second, then the two Chinese communist dictators and Putin. Pinochet is not so far away either. The least dictator-liking people seem to be the IDW/Quillette cluster which also has a strong libertarian bent. The X axis looks like a wokeness vs. HBD, with communist activist academics Gould and Lewontin on the far-left, along with The Guardian and Vox outlets. Steve Sailer and Taki's magazine are the most HBDness. It doesn't fit exactly because Fox News is not very HBD.
Another way to look at it, is to look at the heatmap of the correlations. I have also clustered them so that variables are generally cluster to each other when they have similar patterns (NOT ALWAYS!):
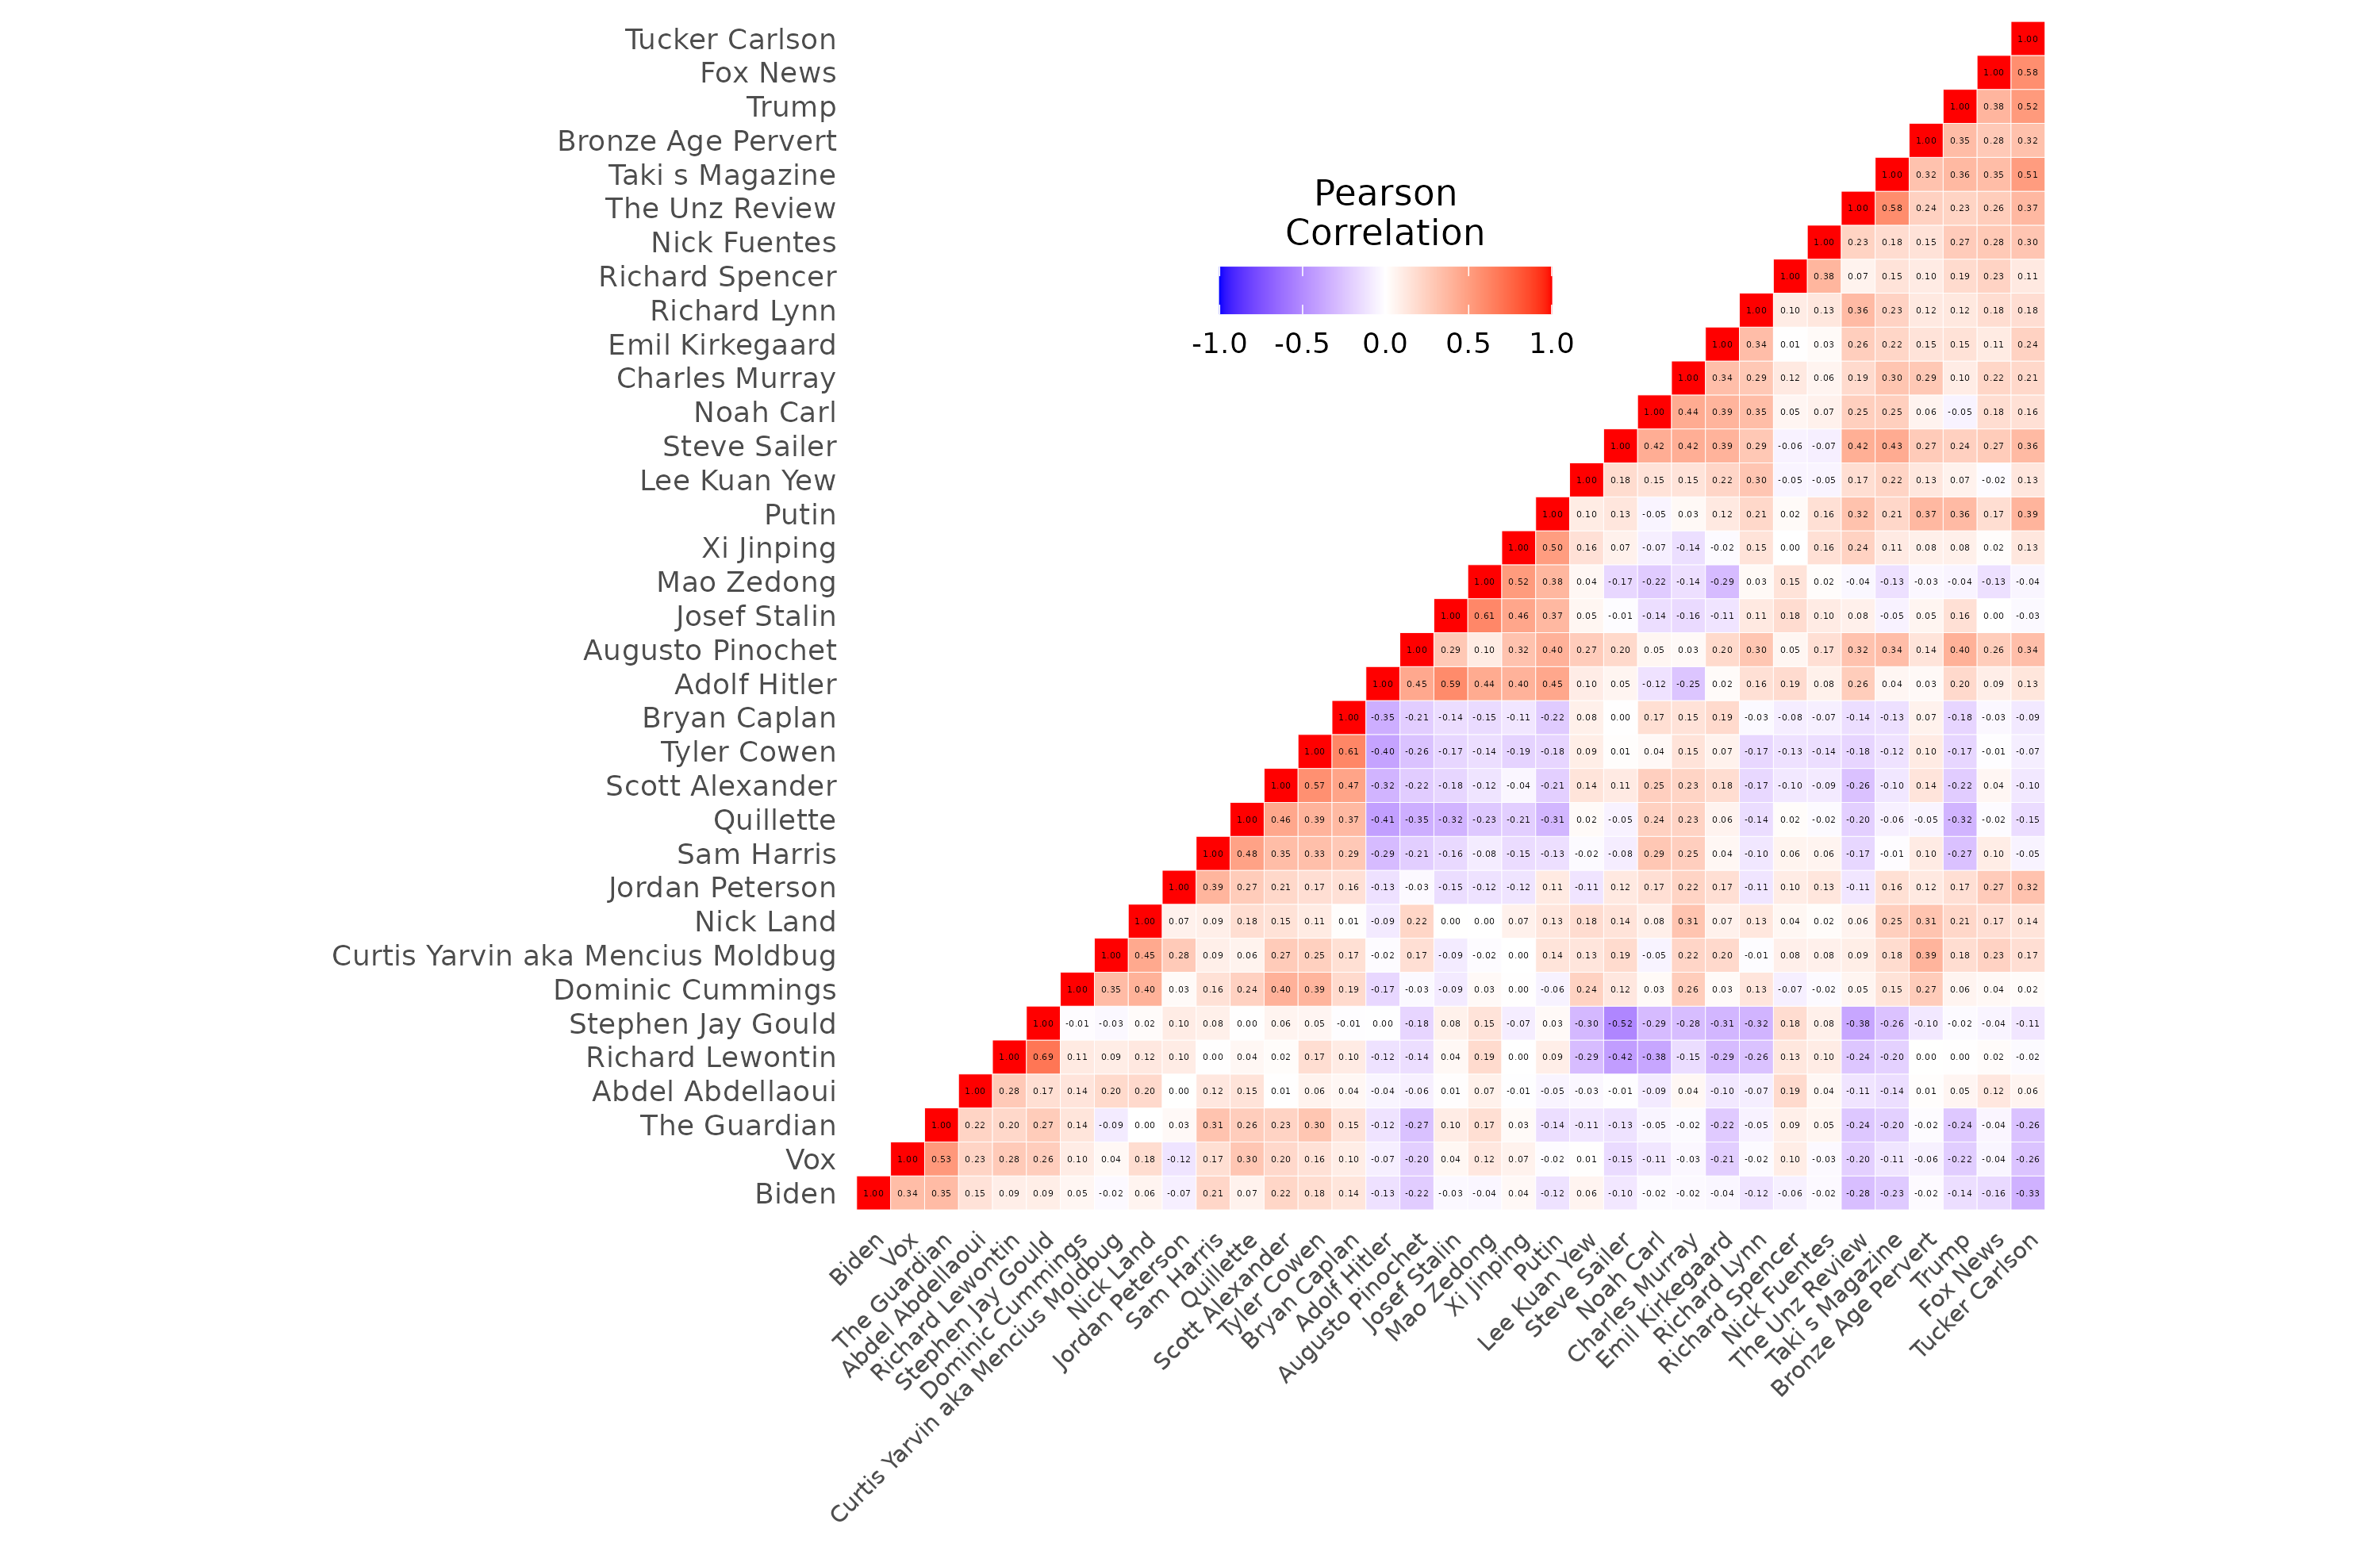
So with this you can see that people who like Hitler also like Stalin, Mao etc., the dictator factor. It's hard to see so click to zoom, the image is quite large.
Similarly to the likes, we had a bunch of agree disagree statements.

Most agreement was seen for free speech being good (I guess a few of the disagrees are from fascist supporters), IQ testing working, voluntary eugenics (biotech/embryos I guess), not having daughters be on OnlyFan. Ukraine war was a big topic of disagreement. Generally speaking, readers basically have the same opinions I have, which is not too surprising.
Doing the same factor analysis as above, we find it needs 4 factors, yet it will only get 2, which can account for 34% variance. Looks like this:

X axis looks like a traditionalism vs. wokeness, woke on the right. Y axis looks like transhumanist/eugenics vs. equality-morality/back to nature(?).
After politics, comes intelligence. Self-rated IQs on a hypothetical perfect test:
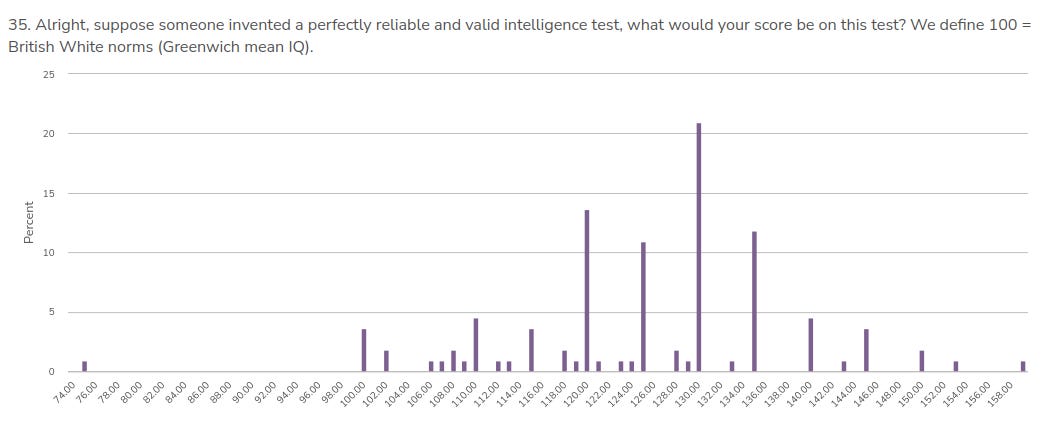
The mean is 125, SD = 13. If we exclude the one not-so-serious person who thinks he is borderline retarded, they are 126 and 12. More generally, the stats are:

And their correlations:
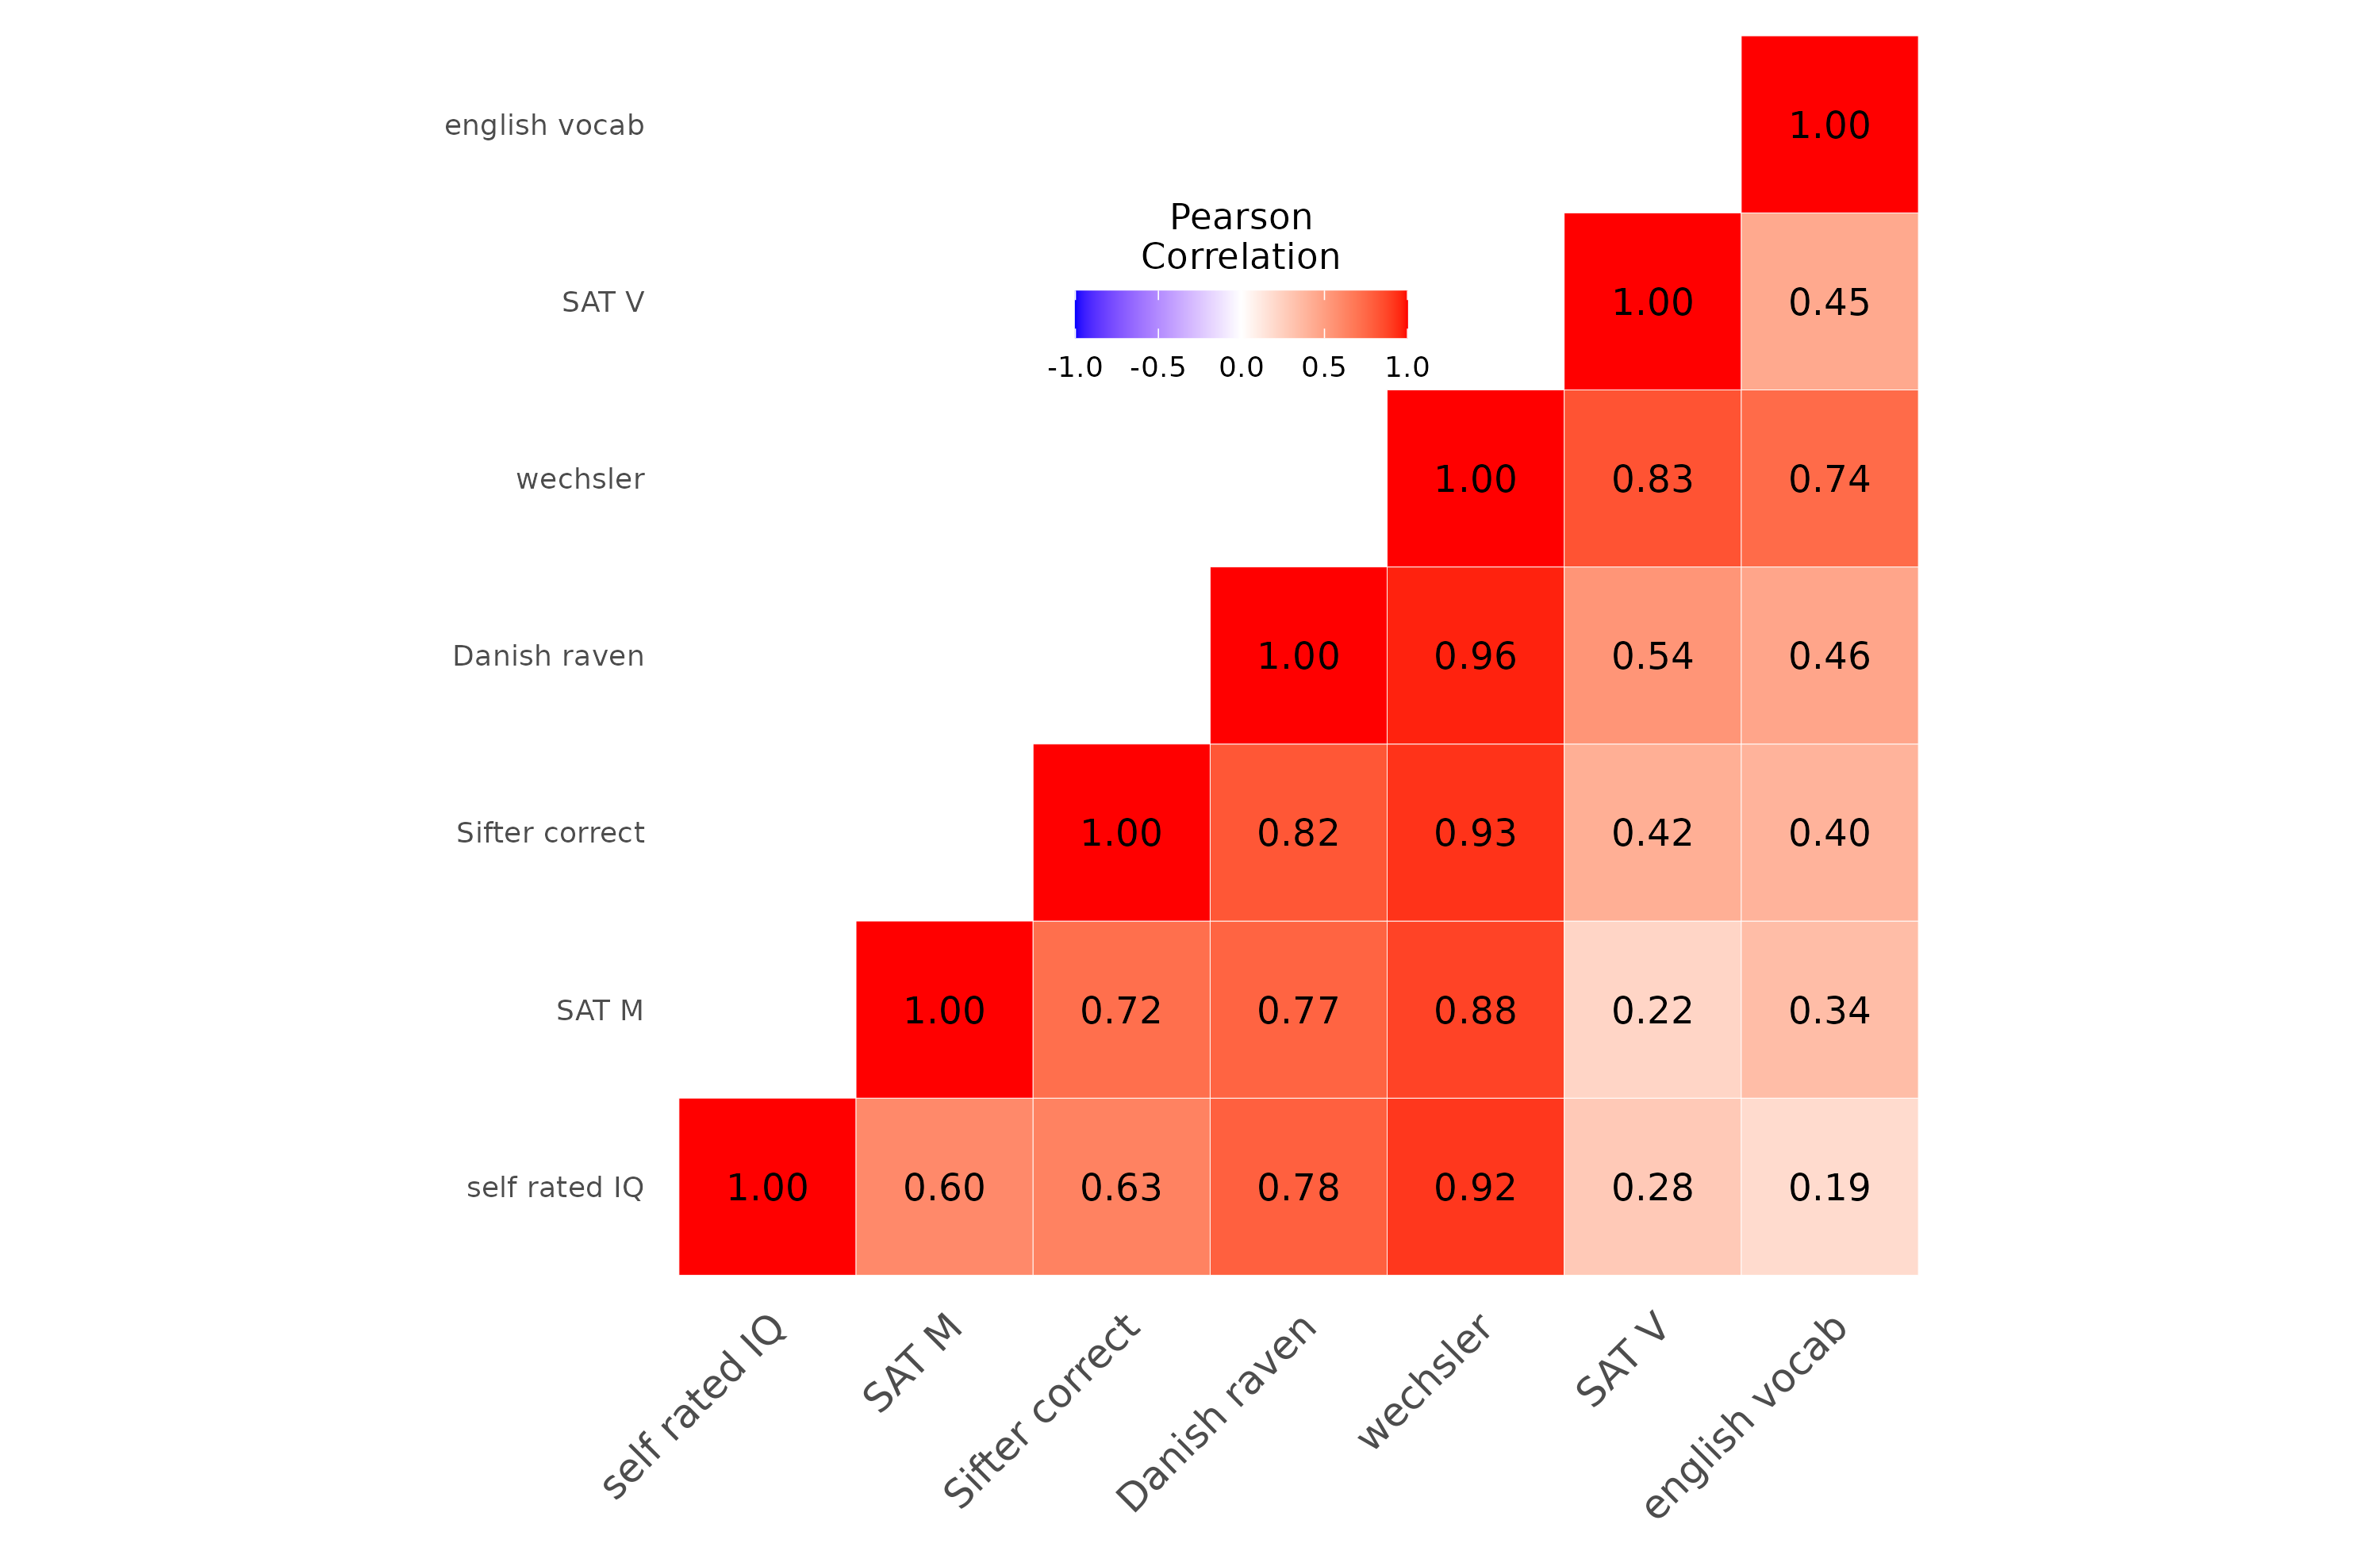
Self-rated IQ is fairly accurate here in the aggregate. Obviously, people who took a Wechsler gold standard test also gave self-ratings close to that value (.92). Self-ratings don't seem to relate so much to SAT V, or English vocab. Maybe this is a fluke or due to a large proportion of English as second language takers (I forgot to ask about this). Sample sizes are not that large, and with this rather extreme selection bias, there's a lot of restriction of range. Still, the estimates align fairly well with a mean about 125.
What about the actual test items? There were 10 items. All about 100 test takers got the letter order swap one right (STEAL STALE), so really the test had 9 items. With that in mind, all of the items had positive loadings (yay!), and, people's self-ratings of items they got right were half-way decent:

Apparently no one got 10/10, but a few people thought they did. The mean score was 5, so the test was apparently the correct difficulty, except for that one item that was much too easy. Does this test relate to the self-reported scores and other test results?

Despite being based on a super selected high IQ sample, this 9 item test managed to correlate .71 with Wechsler scores, which is kinda amazing. It also correlates .52 with two other online tests that people probably took during the survey. Not bad at all. The two verbal tests continue to show bad correlations, even being negative here (a fluke surely). It seems like if one just takes these these items, but say 40 of them instead of 10, one would have a pretty decent high end intelligence test. One could then give it to Prolific/MTurk subjects to obtain the norms.
Now, we finally get to the best part of the survey, body parts preferences:

So it's official: nerds like faces > boobs > ass. Looks like one guy likes feet and hands and no one else cares. Caveat is that this plot includes a few women and non-heterosexuals, which might slightly skew things insofar as these refer to heterosexual male preferences.
And after this, the worst question in the survey (blame George Francis):

Considering free speech, and Americans' weird obsession with the N-word, it's a rather obvious free speech issue:

It looks like about 25% of people are free speech absolutist types. Actually, it's just a badly formulated question, so this doesn't mean much.
What about sleeping style? My girlfriend commented on this, so I wanted to see how unusual my log-style was:
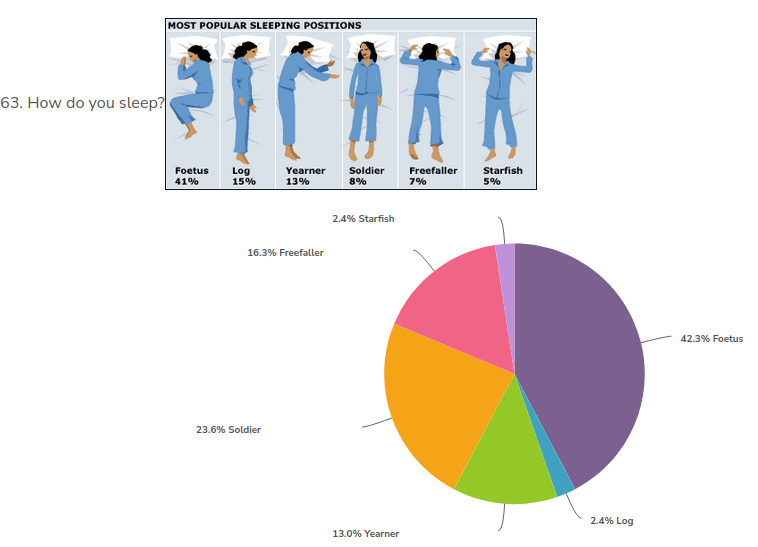
Apparently, very unusual (I didn't take the survey, so I'm not one of the 2.4% loggers). Didn't know so many people slept in fetus position. The numbers are not that far off from the image ones.
The comments
My favorites were the comments telling me I made an error with one of the IQ items. There were 5 people telling me I listed the options incorrectly in one test. Mea culpa. Other highlights:
INTJ. Most unusual accomplishment is having 37 sugar babies between my ages of 71-76. Most were college students. Youngest 18, oldest 34 and 44. The pandemic shut that off. Great memories that will be fresher than those from the 1970's. How can I contact Aella, lol?
Obviously, I forgot to ask about MBTI scores.
Just to note that is possible to be a Marxist and and hereditarian. And both have been my freak ideological acquisitions in the last ten years. I was the typical center liberal. Your work is quite interesting. Thanks for it.
Your mission to to go convince Freddie of this!
If the test says I am dumb it is biased.
Not sure how many bisexual polytheist occultists you have in your readership, but you've got one at least. Guess that person is at least a little more based than the average bisexual polytheist occultist if he's reading you.
If you show 3 adjacent sides of a cube, anything can be on the other 3 sides. Correct answer is "all of them", that's *basic skills*
I see the unmentioned assumption here is that each symbol can only be on one side. If one drops that assumption, indeed, every cube is a correct answer. But meta-reasoning would rule out this interpretation as this would make the test useless.
Three things: * Your shit is way too US-centric. * I got 97th percentile on the UCAT, the UK medical school admissions test (it's a timed, IQ-style test with verbal/maths/shape rotation/logic sections). * Nigger.
True, but also no Americans were involved in making the survey!
I don't like 54. Meteoric iron contains nickel but neither iron nor nickel means you've found a meteorite. I answered "cobalt" since you asked for a single element answer (though I was just guessing). It's extremely rare to find on earth's surface except when the source is a meteorite, so I think it's the best answer for the question as written.
I scored all answers containing any of the elements listed on Wikipedia as correct: nickel, platinum, iridium, and cobalt. Most people who got it right wrote iridium. Honestly, I got this information from reading A Short History of Nearly Everything a decade ago, I guess many readers did too. But commenter is right. This was a bad item. g-loading was only 0.12.
That's it. One could do some more cool analysis of the relations between variables, but the sample size is on the small side for these analyses, so I have mostly refrained. Hope you enjoyed the results! They are fun and interesting. Thanks for the support and participating.
> I don't know why you don't like Noah Carl more, he's maybe the nicest person I know
He is nice and writes very well.
The people that got “liked very much” have a more risky (controversial?) writing style that polarizes opinions about them. I am pretty sure for example that Noah has overall the fewer haters, specially when compared to you, kmac, cofnas or sailer. At the same time he will have fewer hardcore fans for the same reasons.
Great that you took the time to do this btw. Interesting to see how similar your readership is.
Wow, great work.