
Reader survey 2025 results
n=664/320

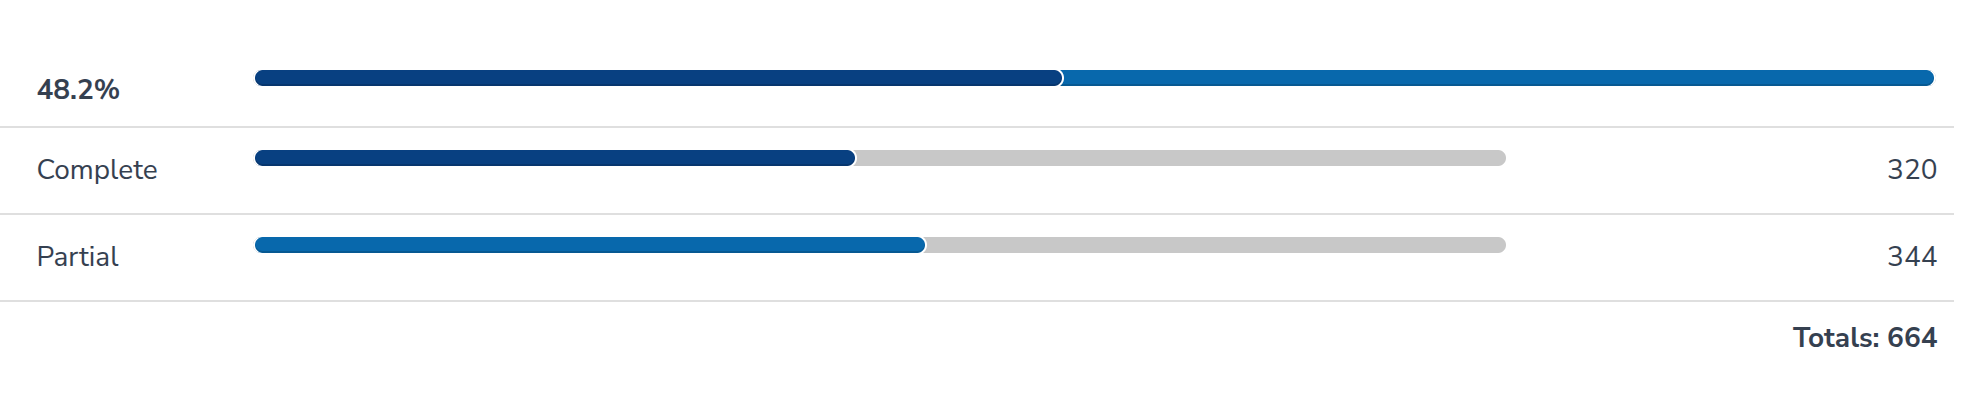
OK, I got tired of waiting for more willing subjects (that is, maybe you), so here's the results of this year's survey. There were 664 subjects of which 320 complete (meaning clicked to the last page, not answered everything). Last year the numbers were 552/238. Thus, the growth rate was 21% for all subjects and 34% for complete cases:
This growth dovetails with the growth of the readership:
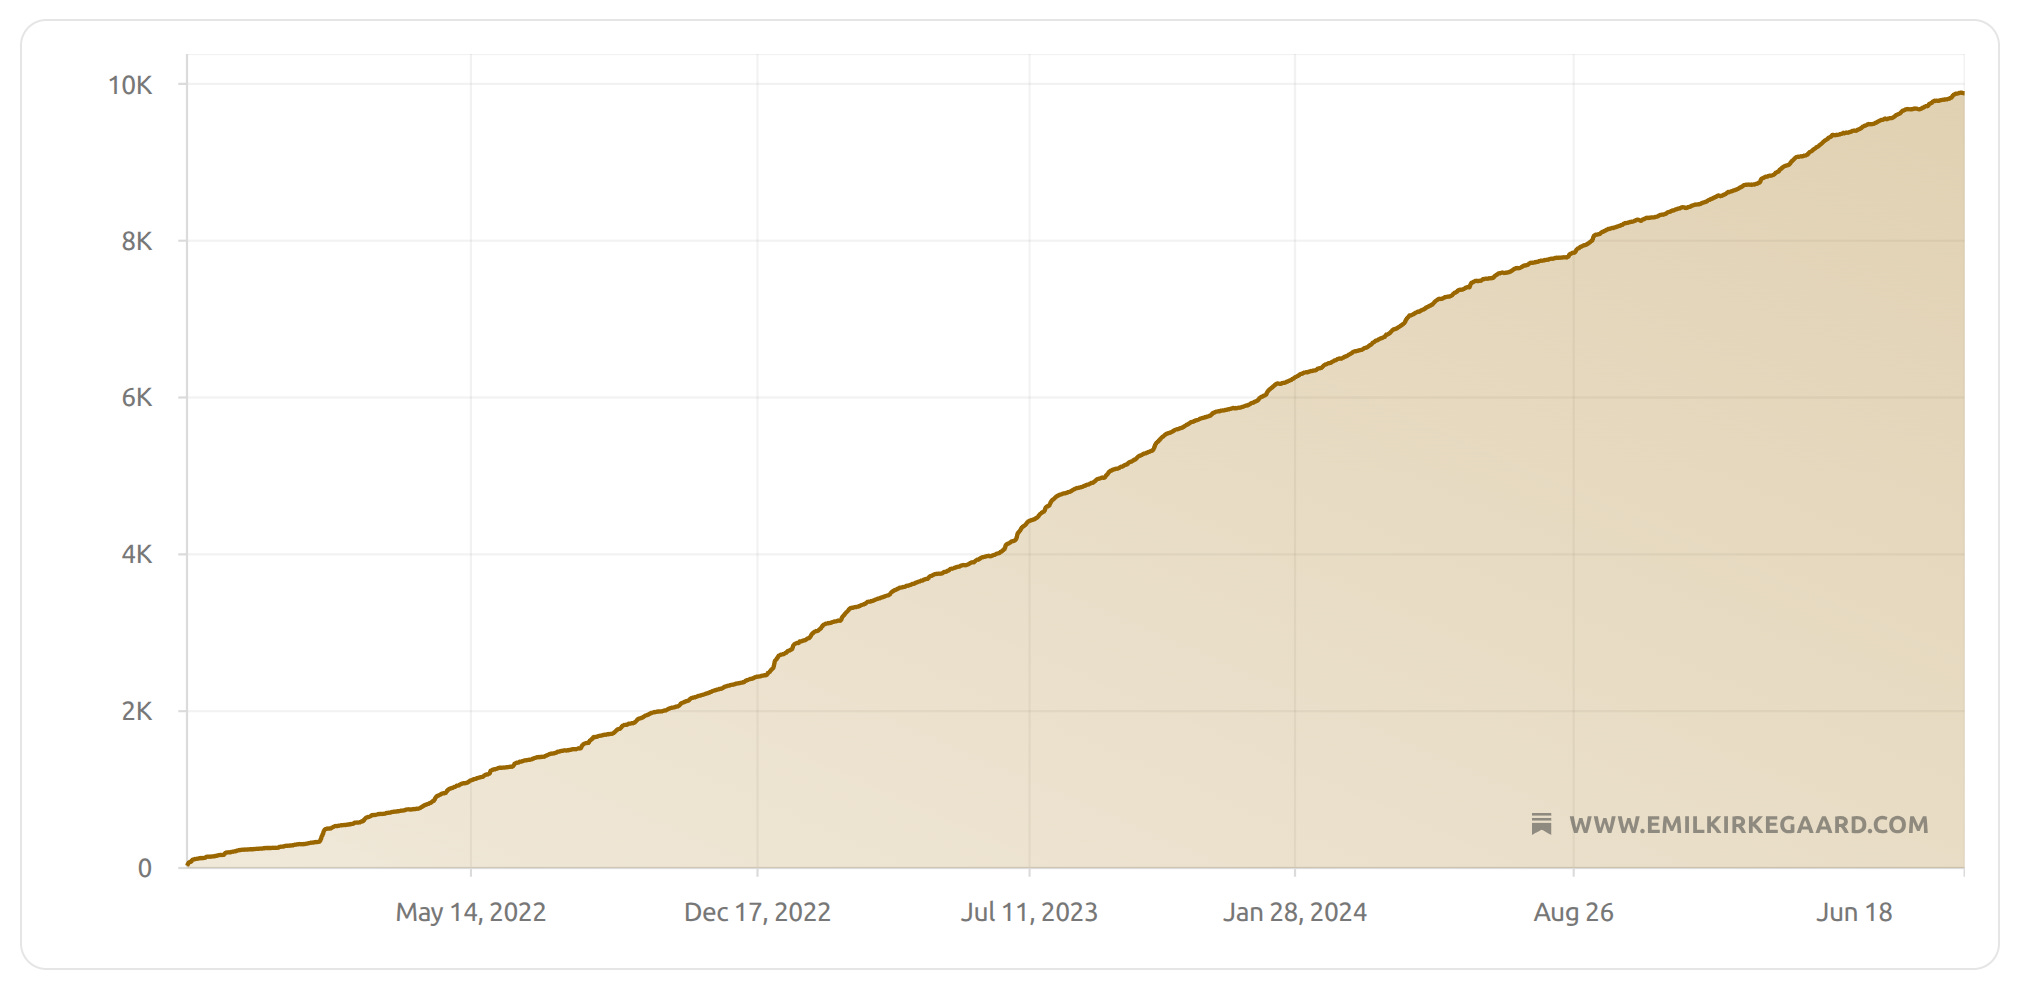
As of writing, the readership (email subscribers) is sitting at 9880, very close to the magic 10k number. The growth rate is remarkably linear. Basically a story of line go up at roughly a constant rate:
I noted that the total number here is a bit larger (9904 vs. 9880). It seems this is because the email export function counts Substack Notes (Twitter clone) subscribers. I am not sure if it is double-counting some people, or if these represent people who subscribe to either or both.
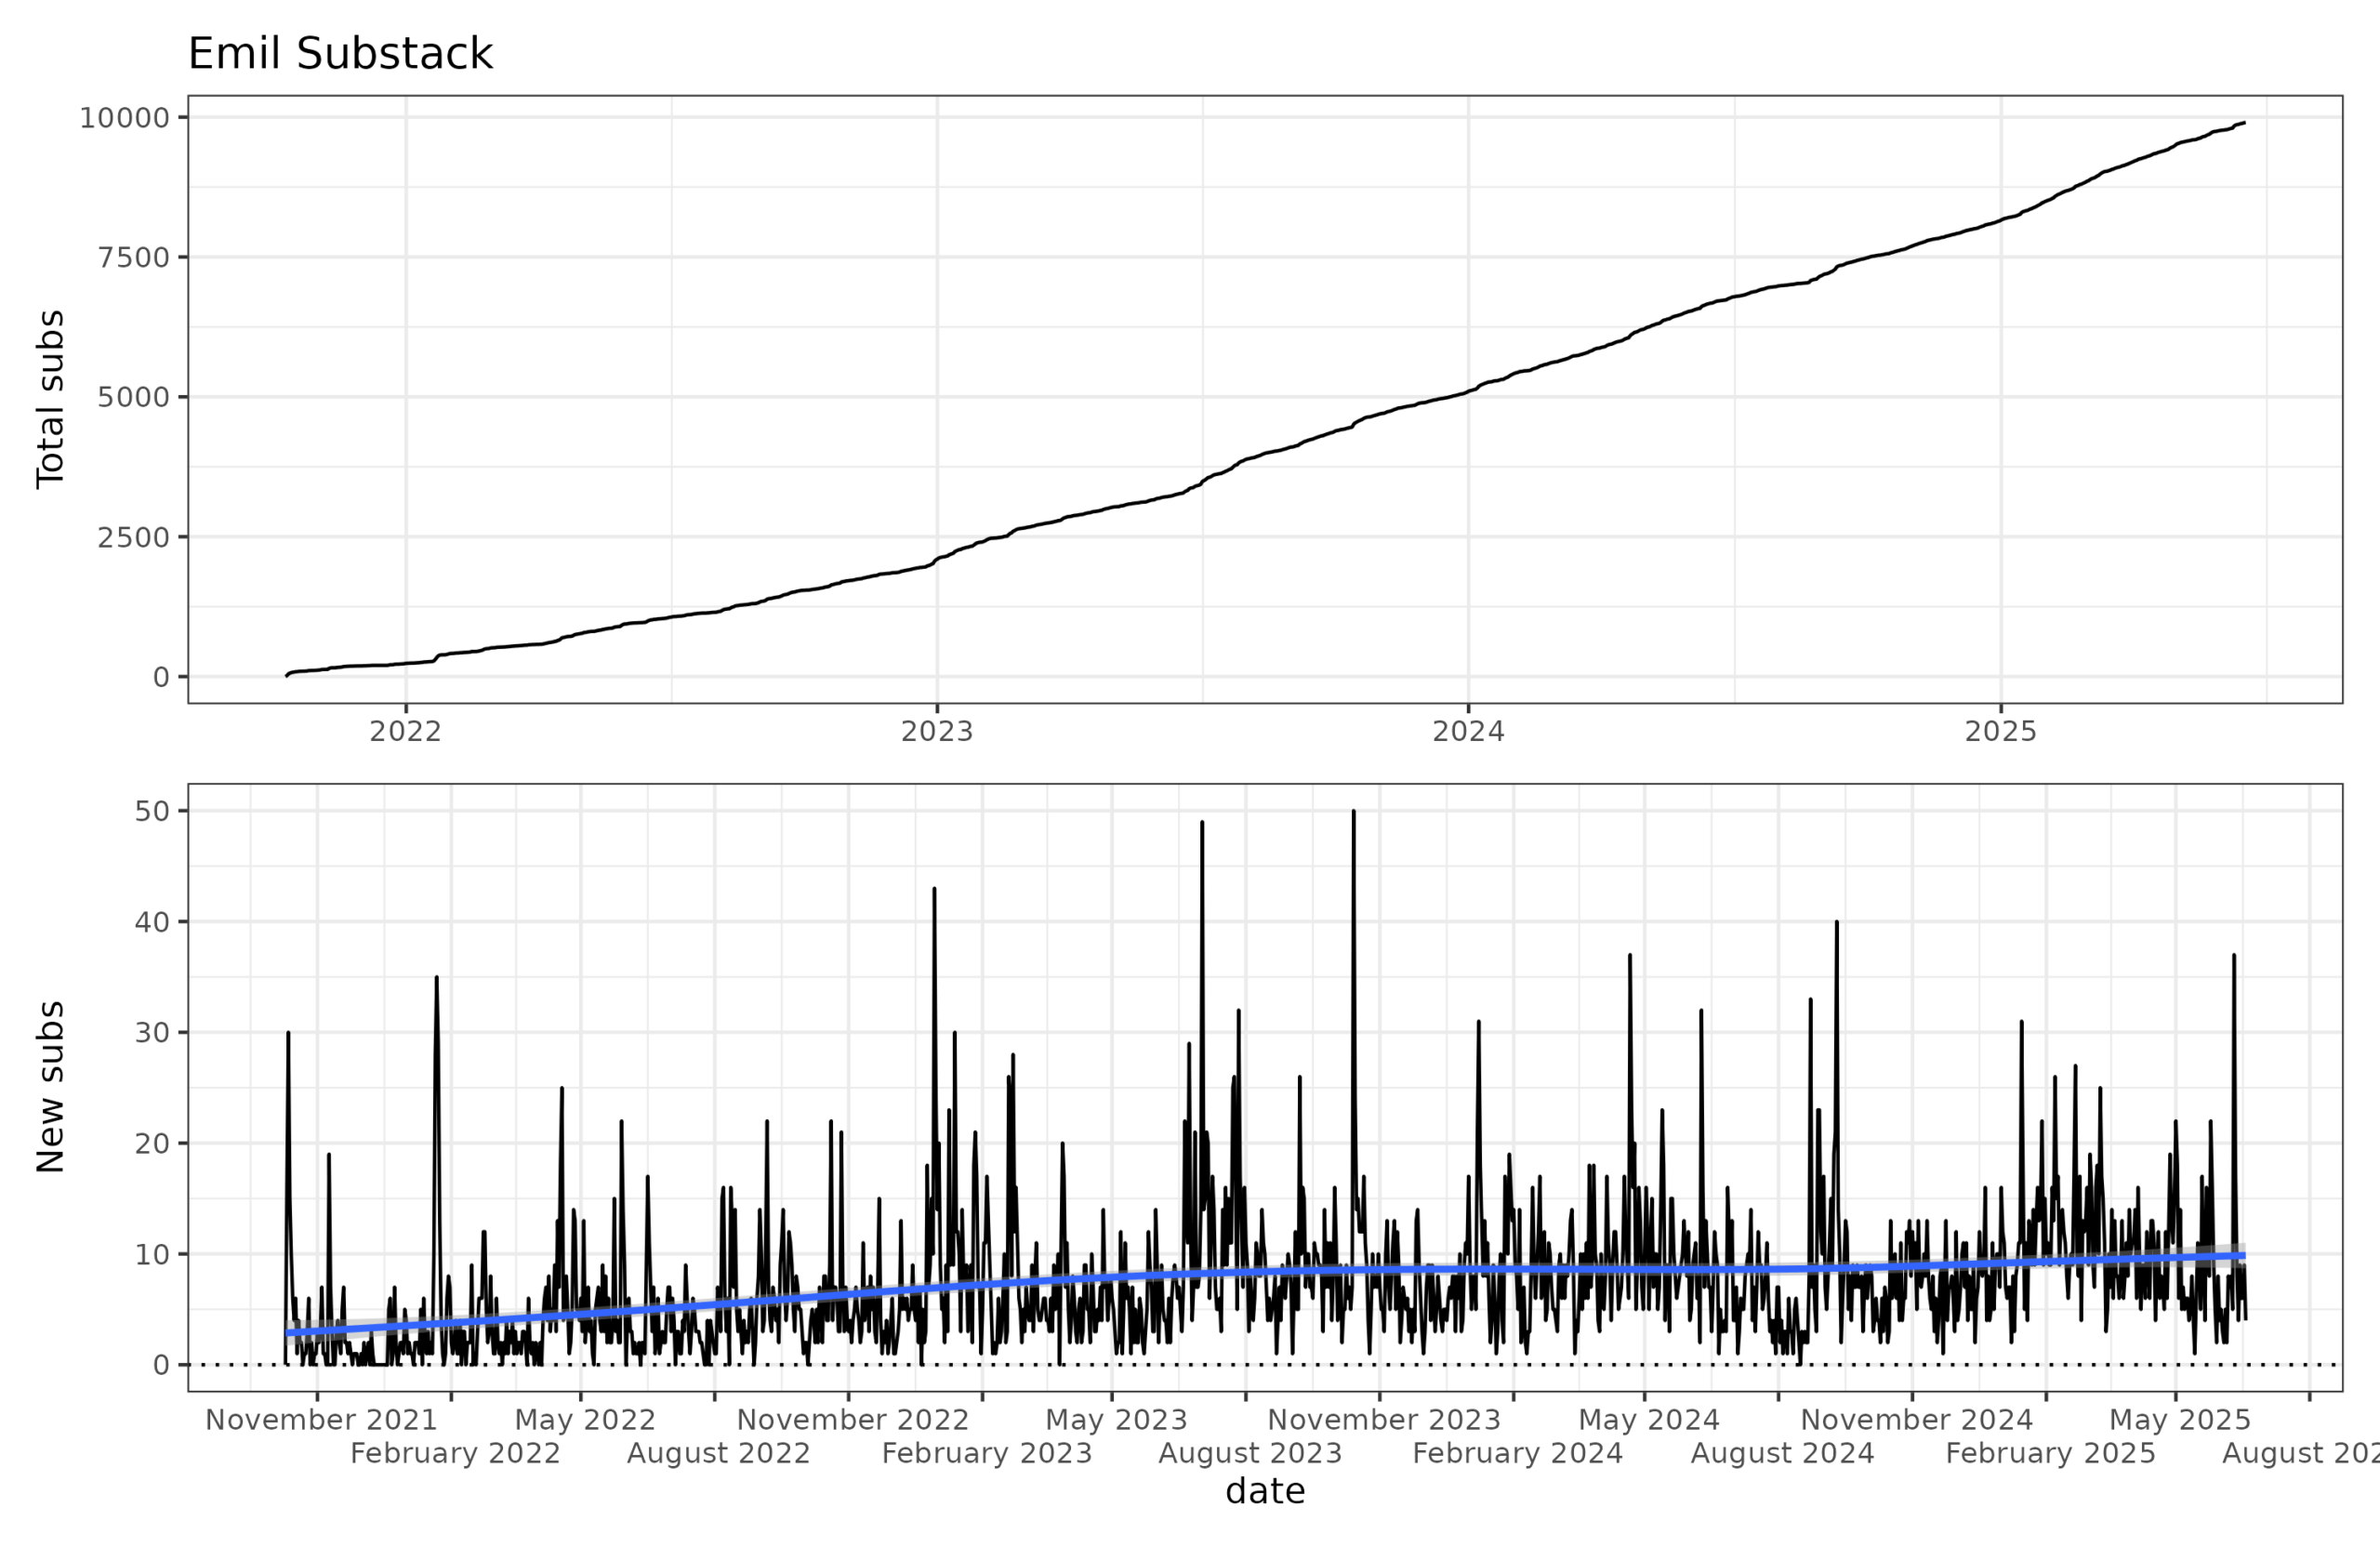
Looking closely at the blue line in the bottom, we can see that new subs/day rose from an initial 3 to 8 around August 2023. After this, there was a very slightly upwards trend in the growth rate, such that the growth is currently around 10/day. The big spikes are due to viral posts. Hopefully, my posting these metrics will incentivize others to also post theirs (and if not, at least they will be informative about this blog).
Let's start with the basics: age, sex location?:
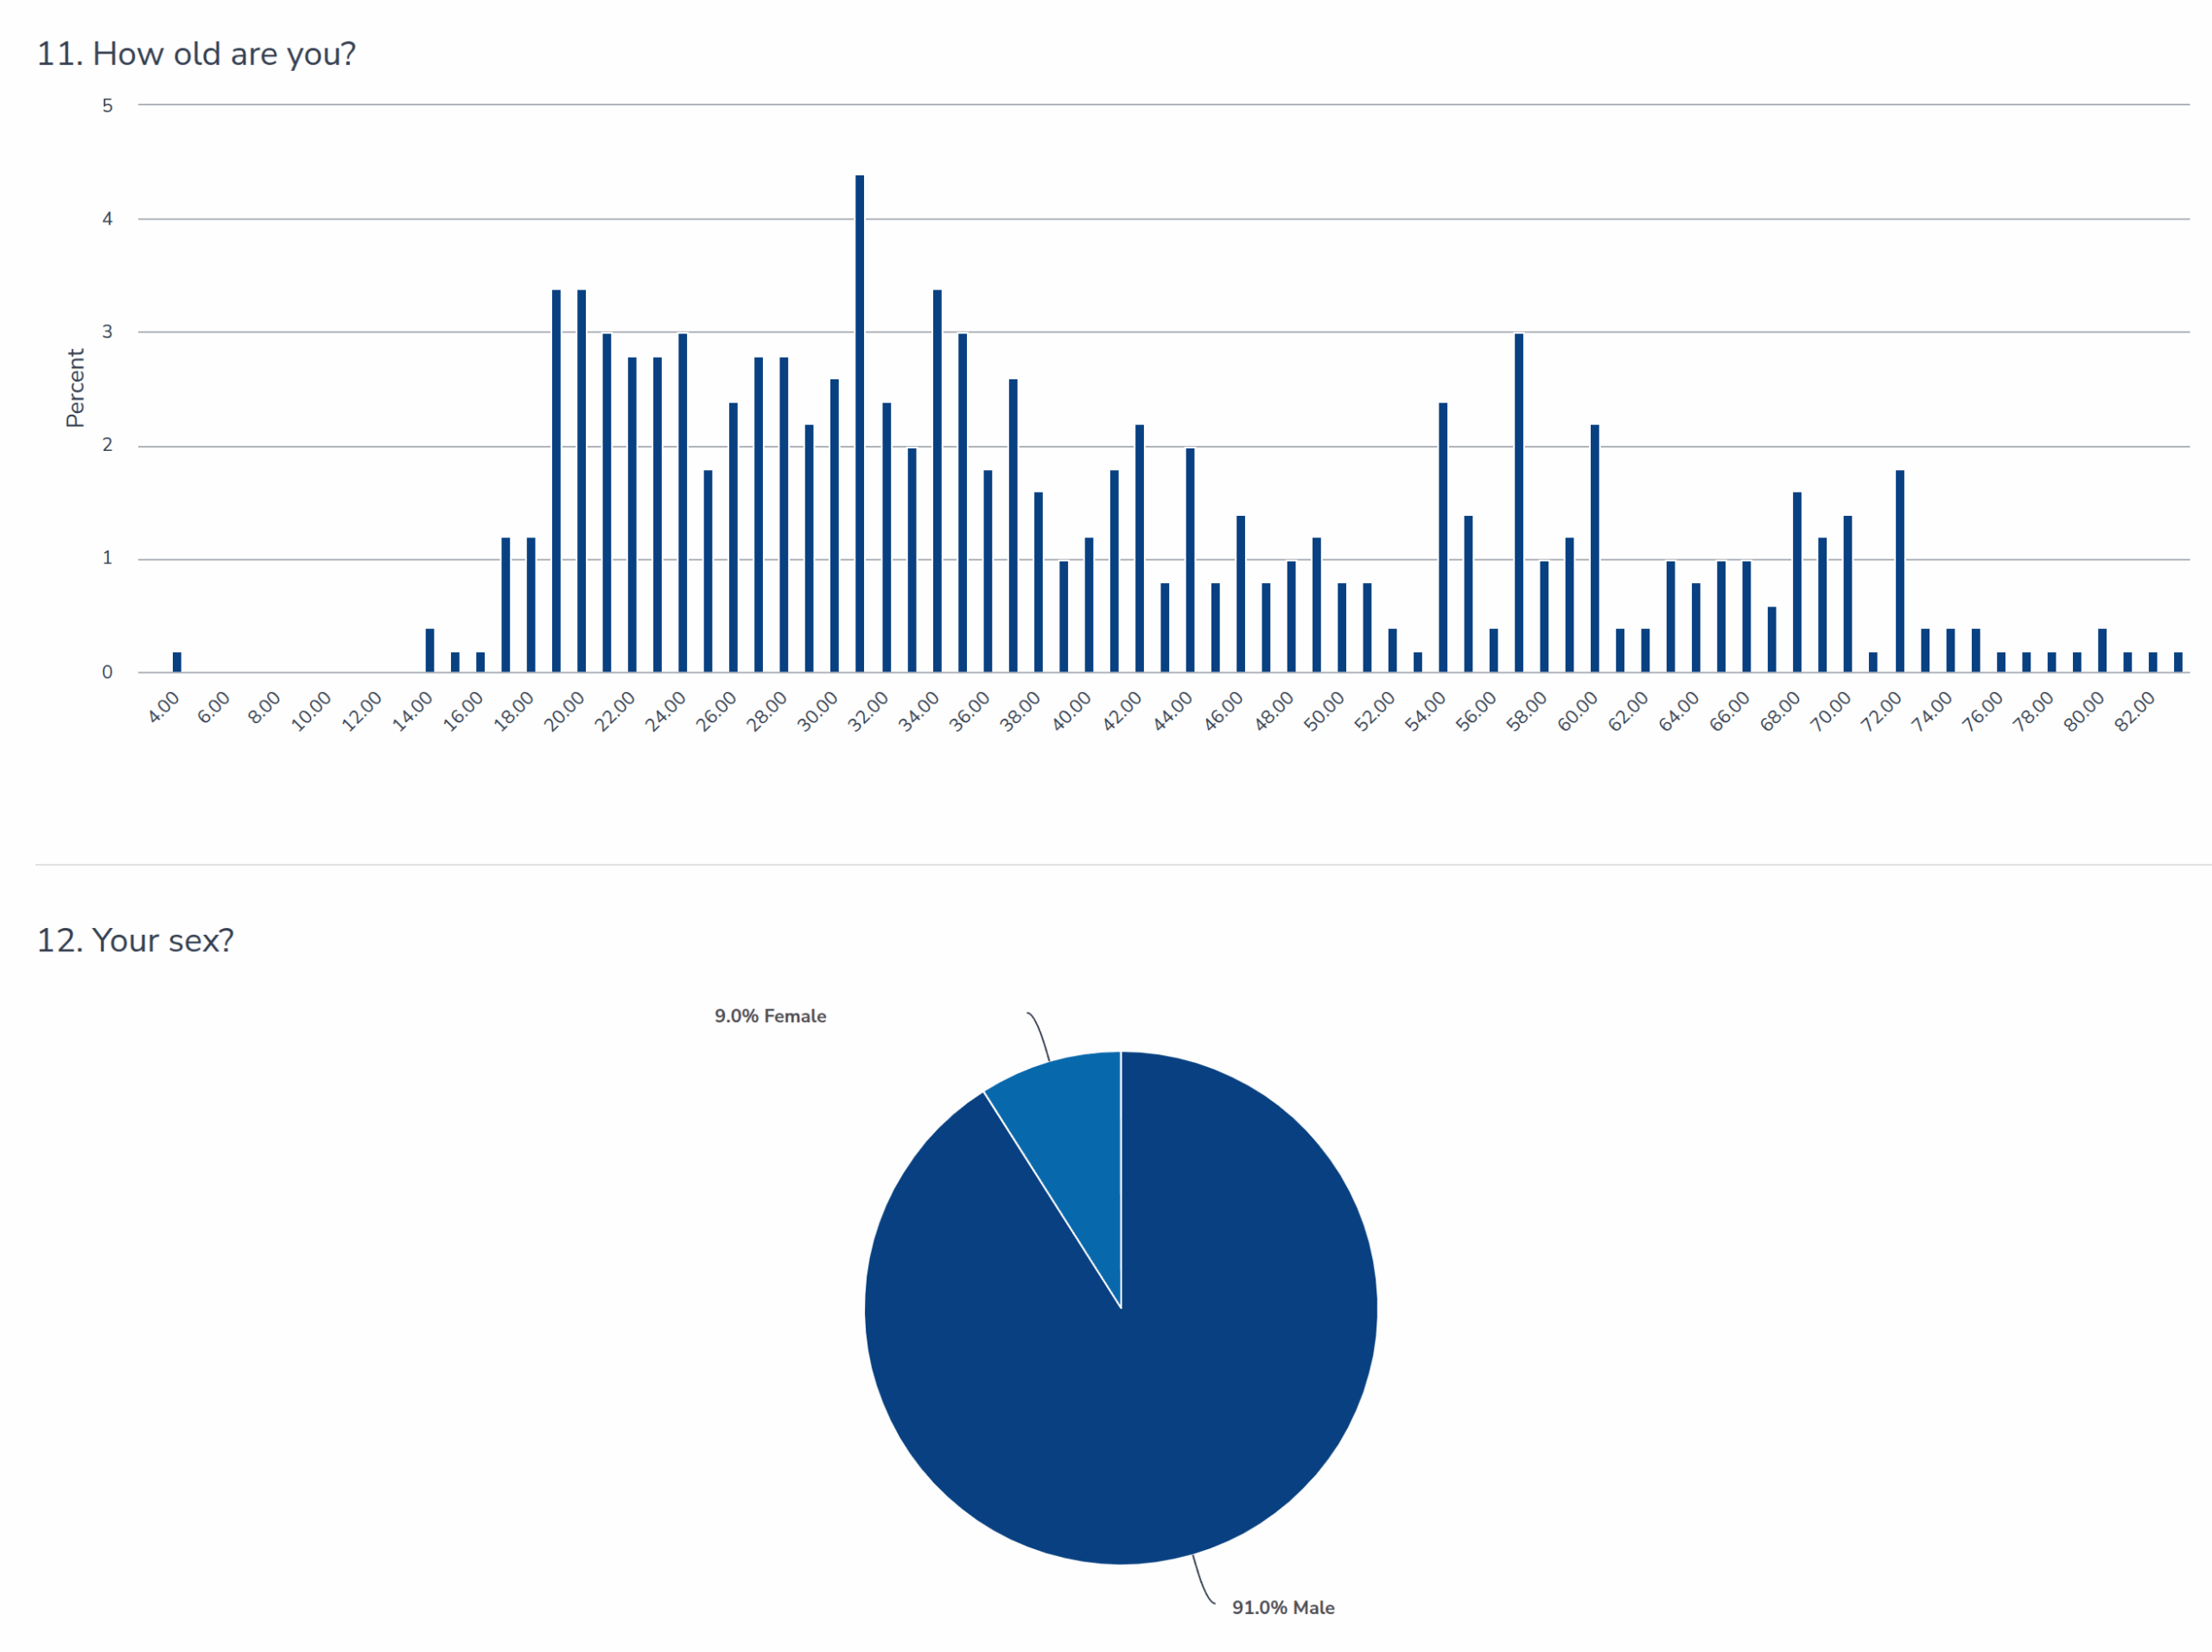
90% male, median age 35. I am male and just turned 36.
In terms of sexuality, it is pretty standard as well:
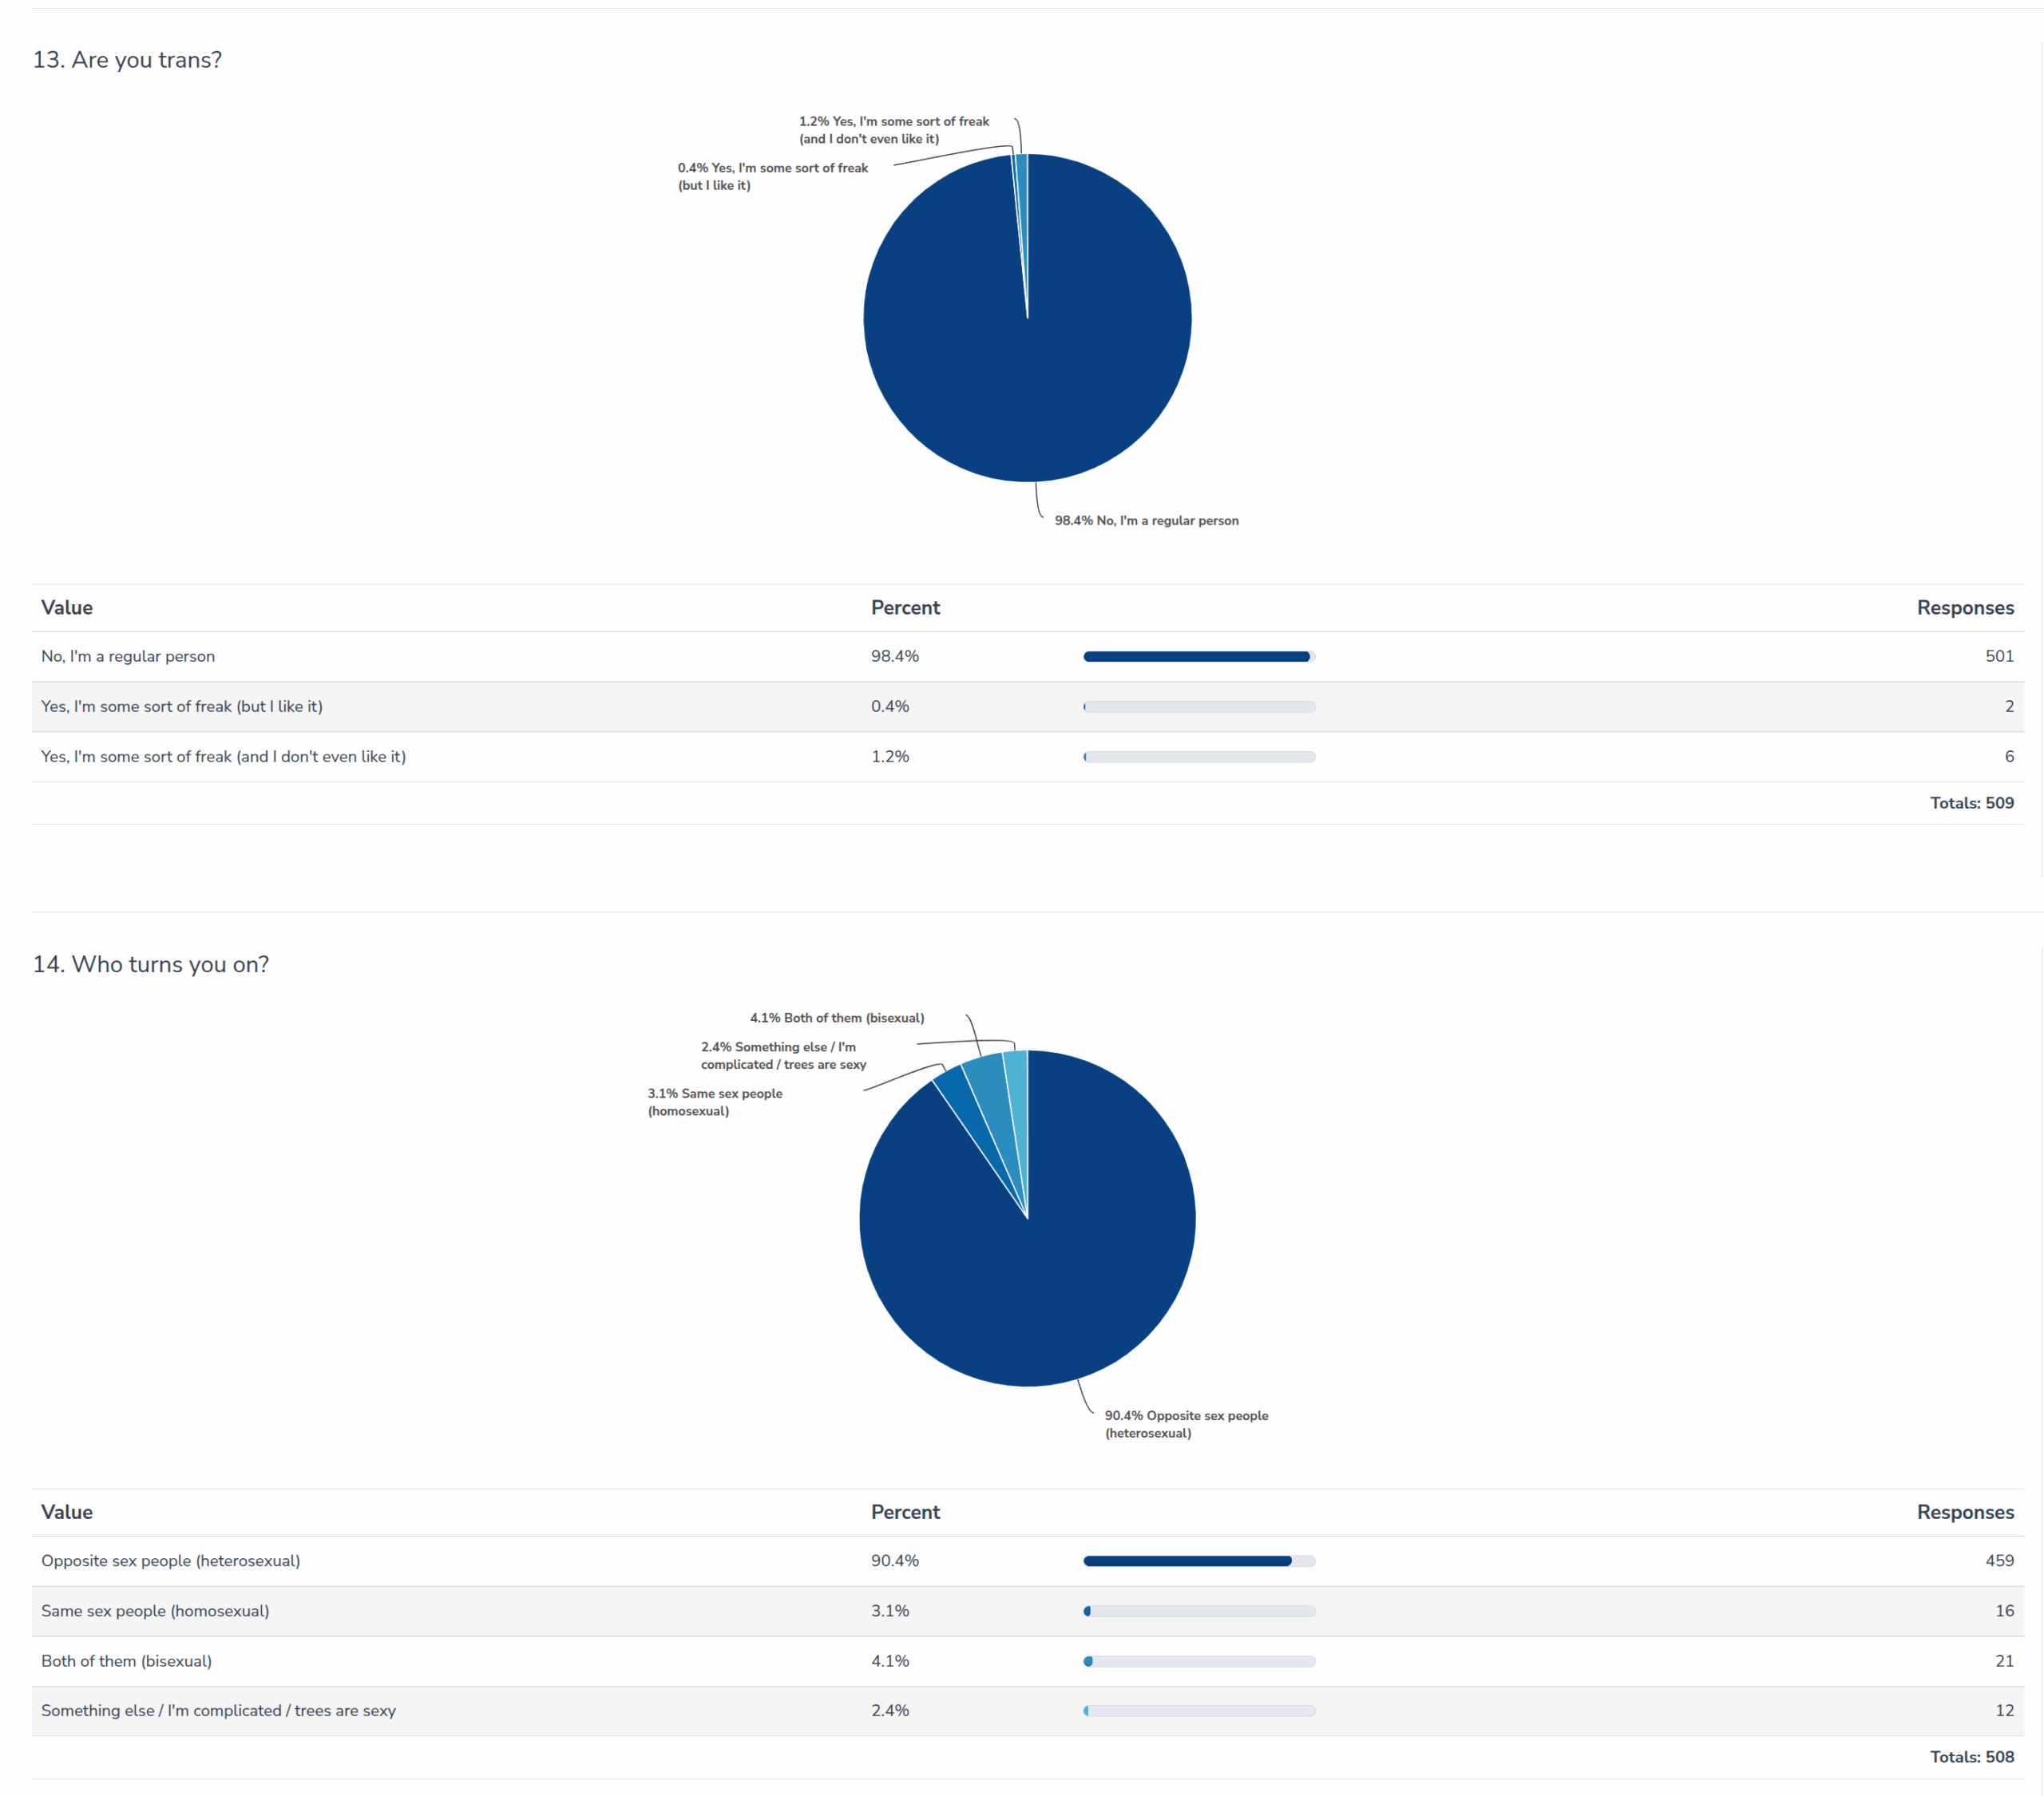
98.4% 'cisgender', and of the 8 trans, 6 don't even like it. On top of that, 90% are heterosexuals. Still, despite ostensibly being a very reactionary blog, maybe the sexual minorities are still over-represented here.
Ethnicity is also fairly standard for an English language intellectual blog:
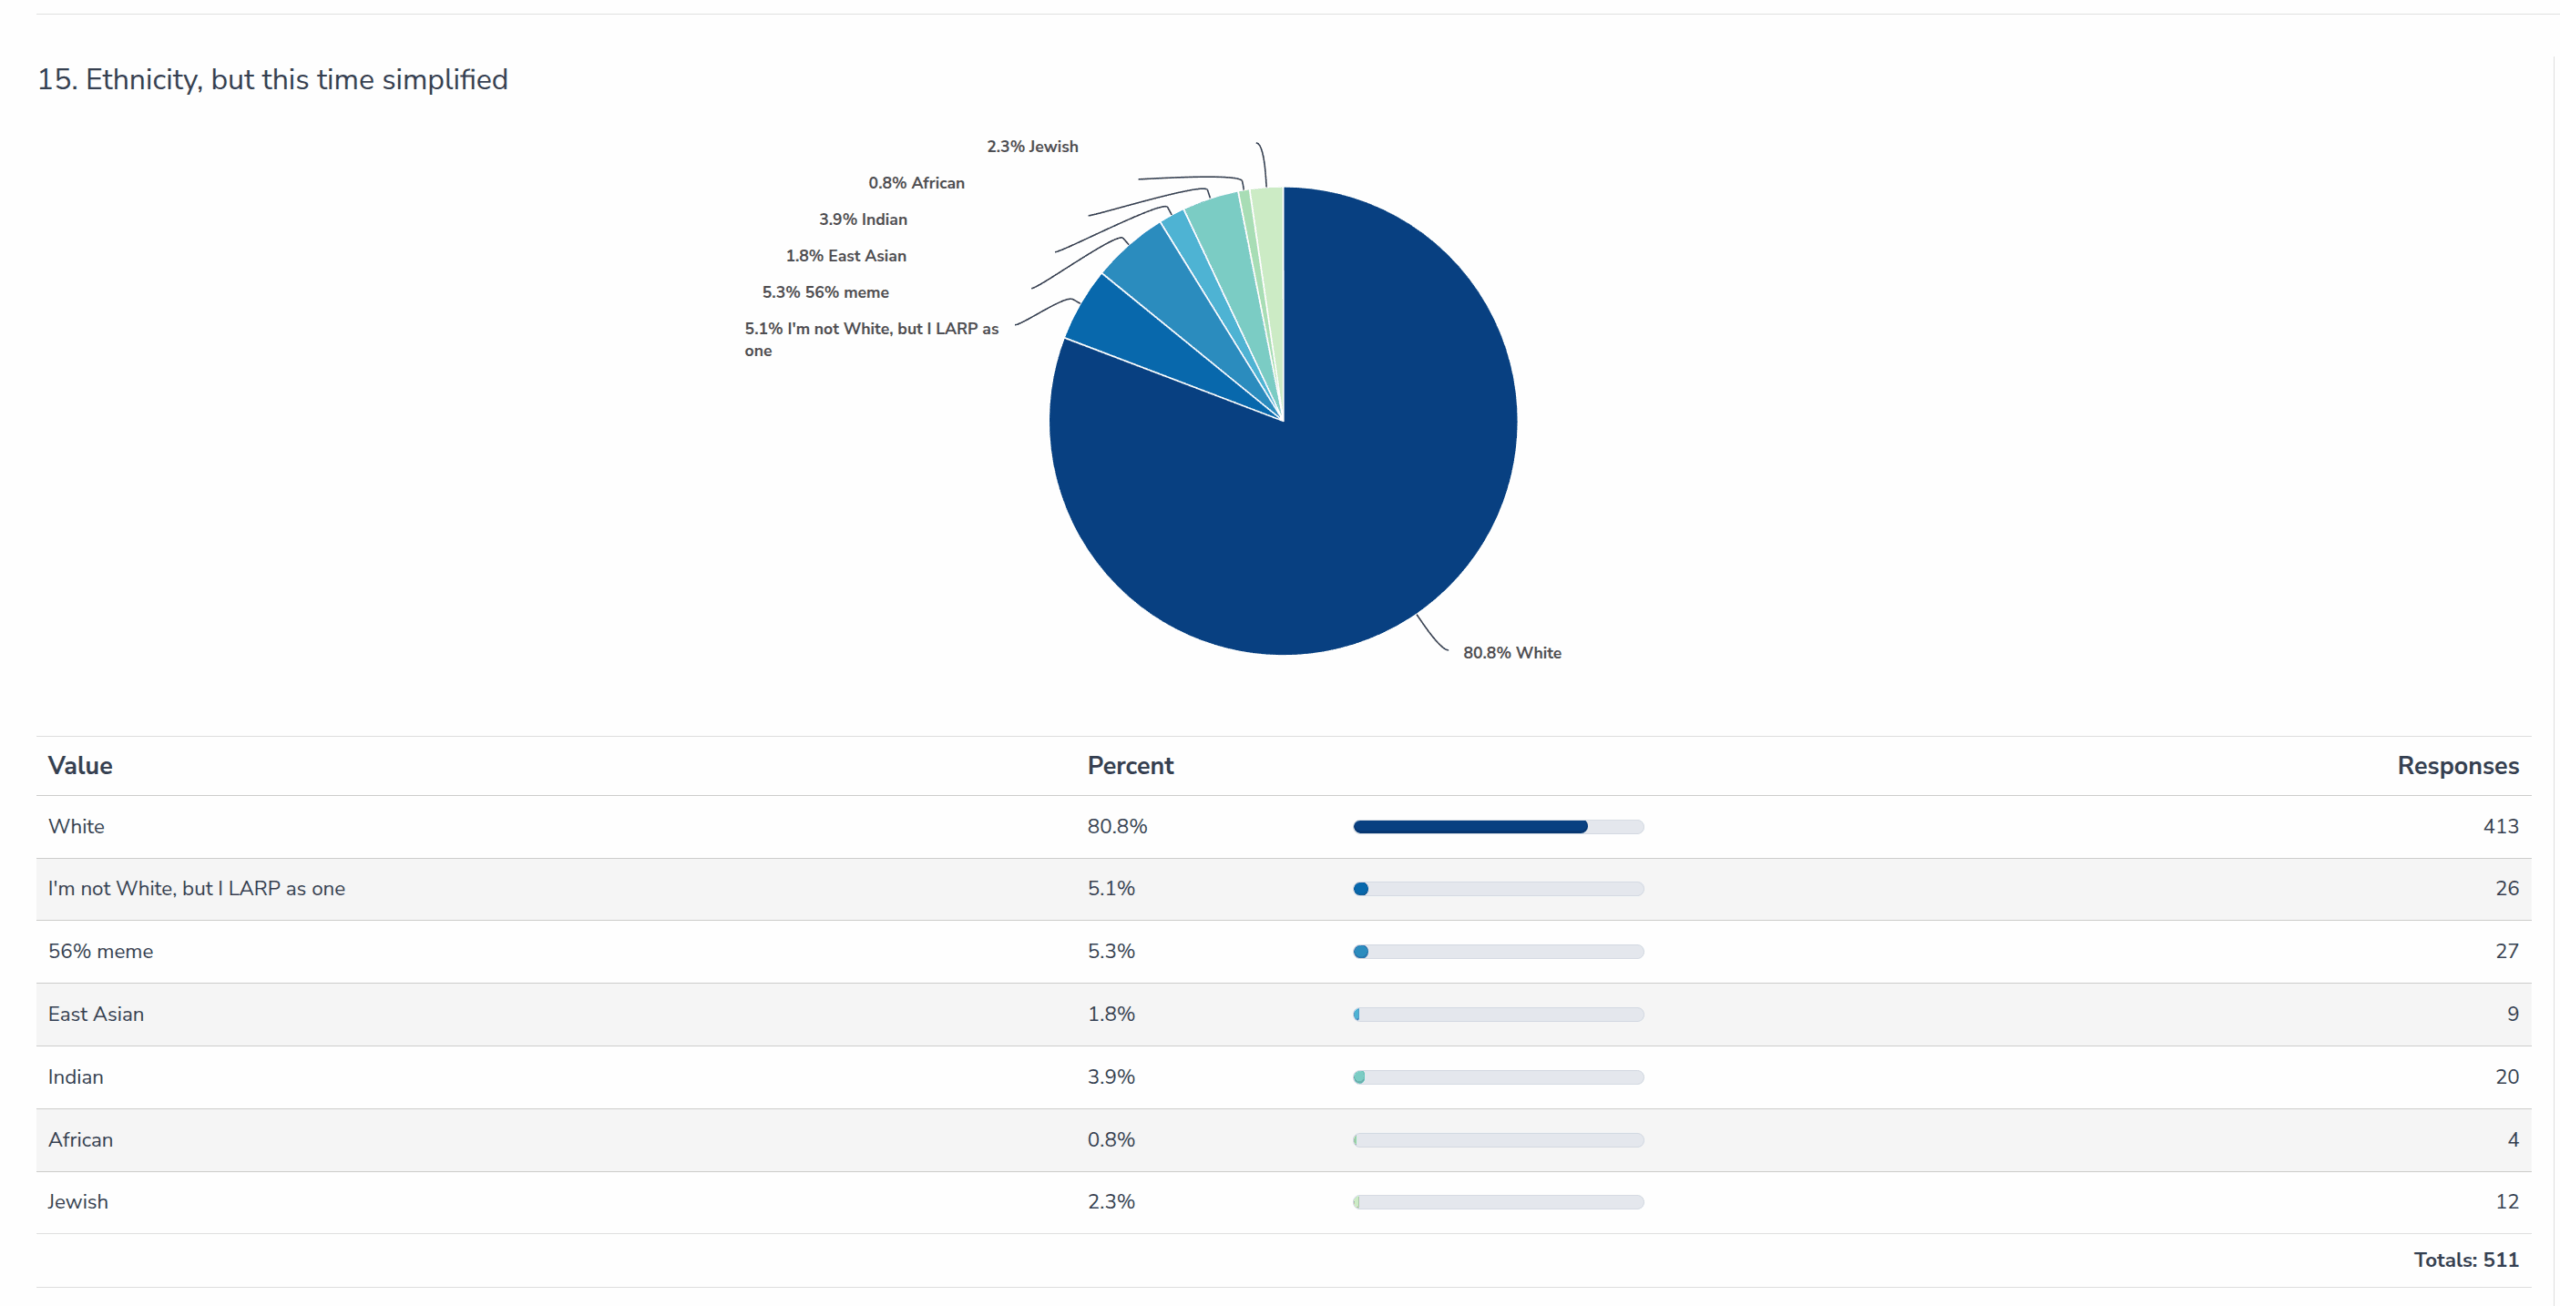
Last year I looked at detailed ancestry estimates. But this was overly complicated, and the results here will probably be about the same as we may guess based on countries of IPs:
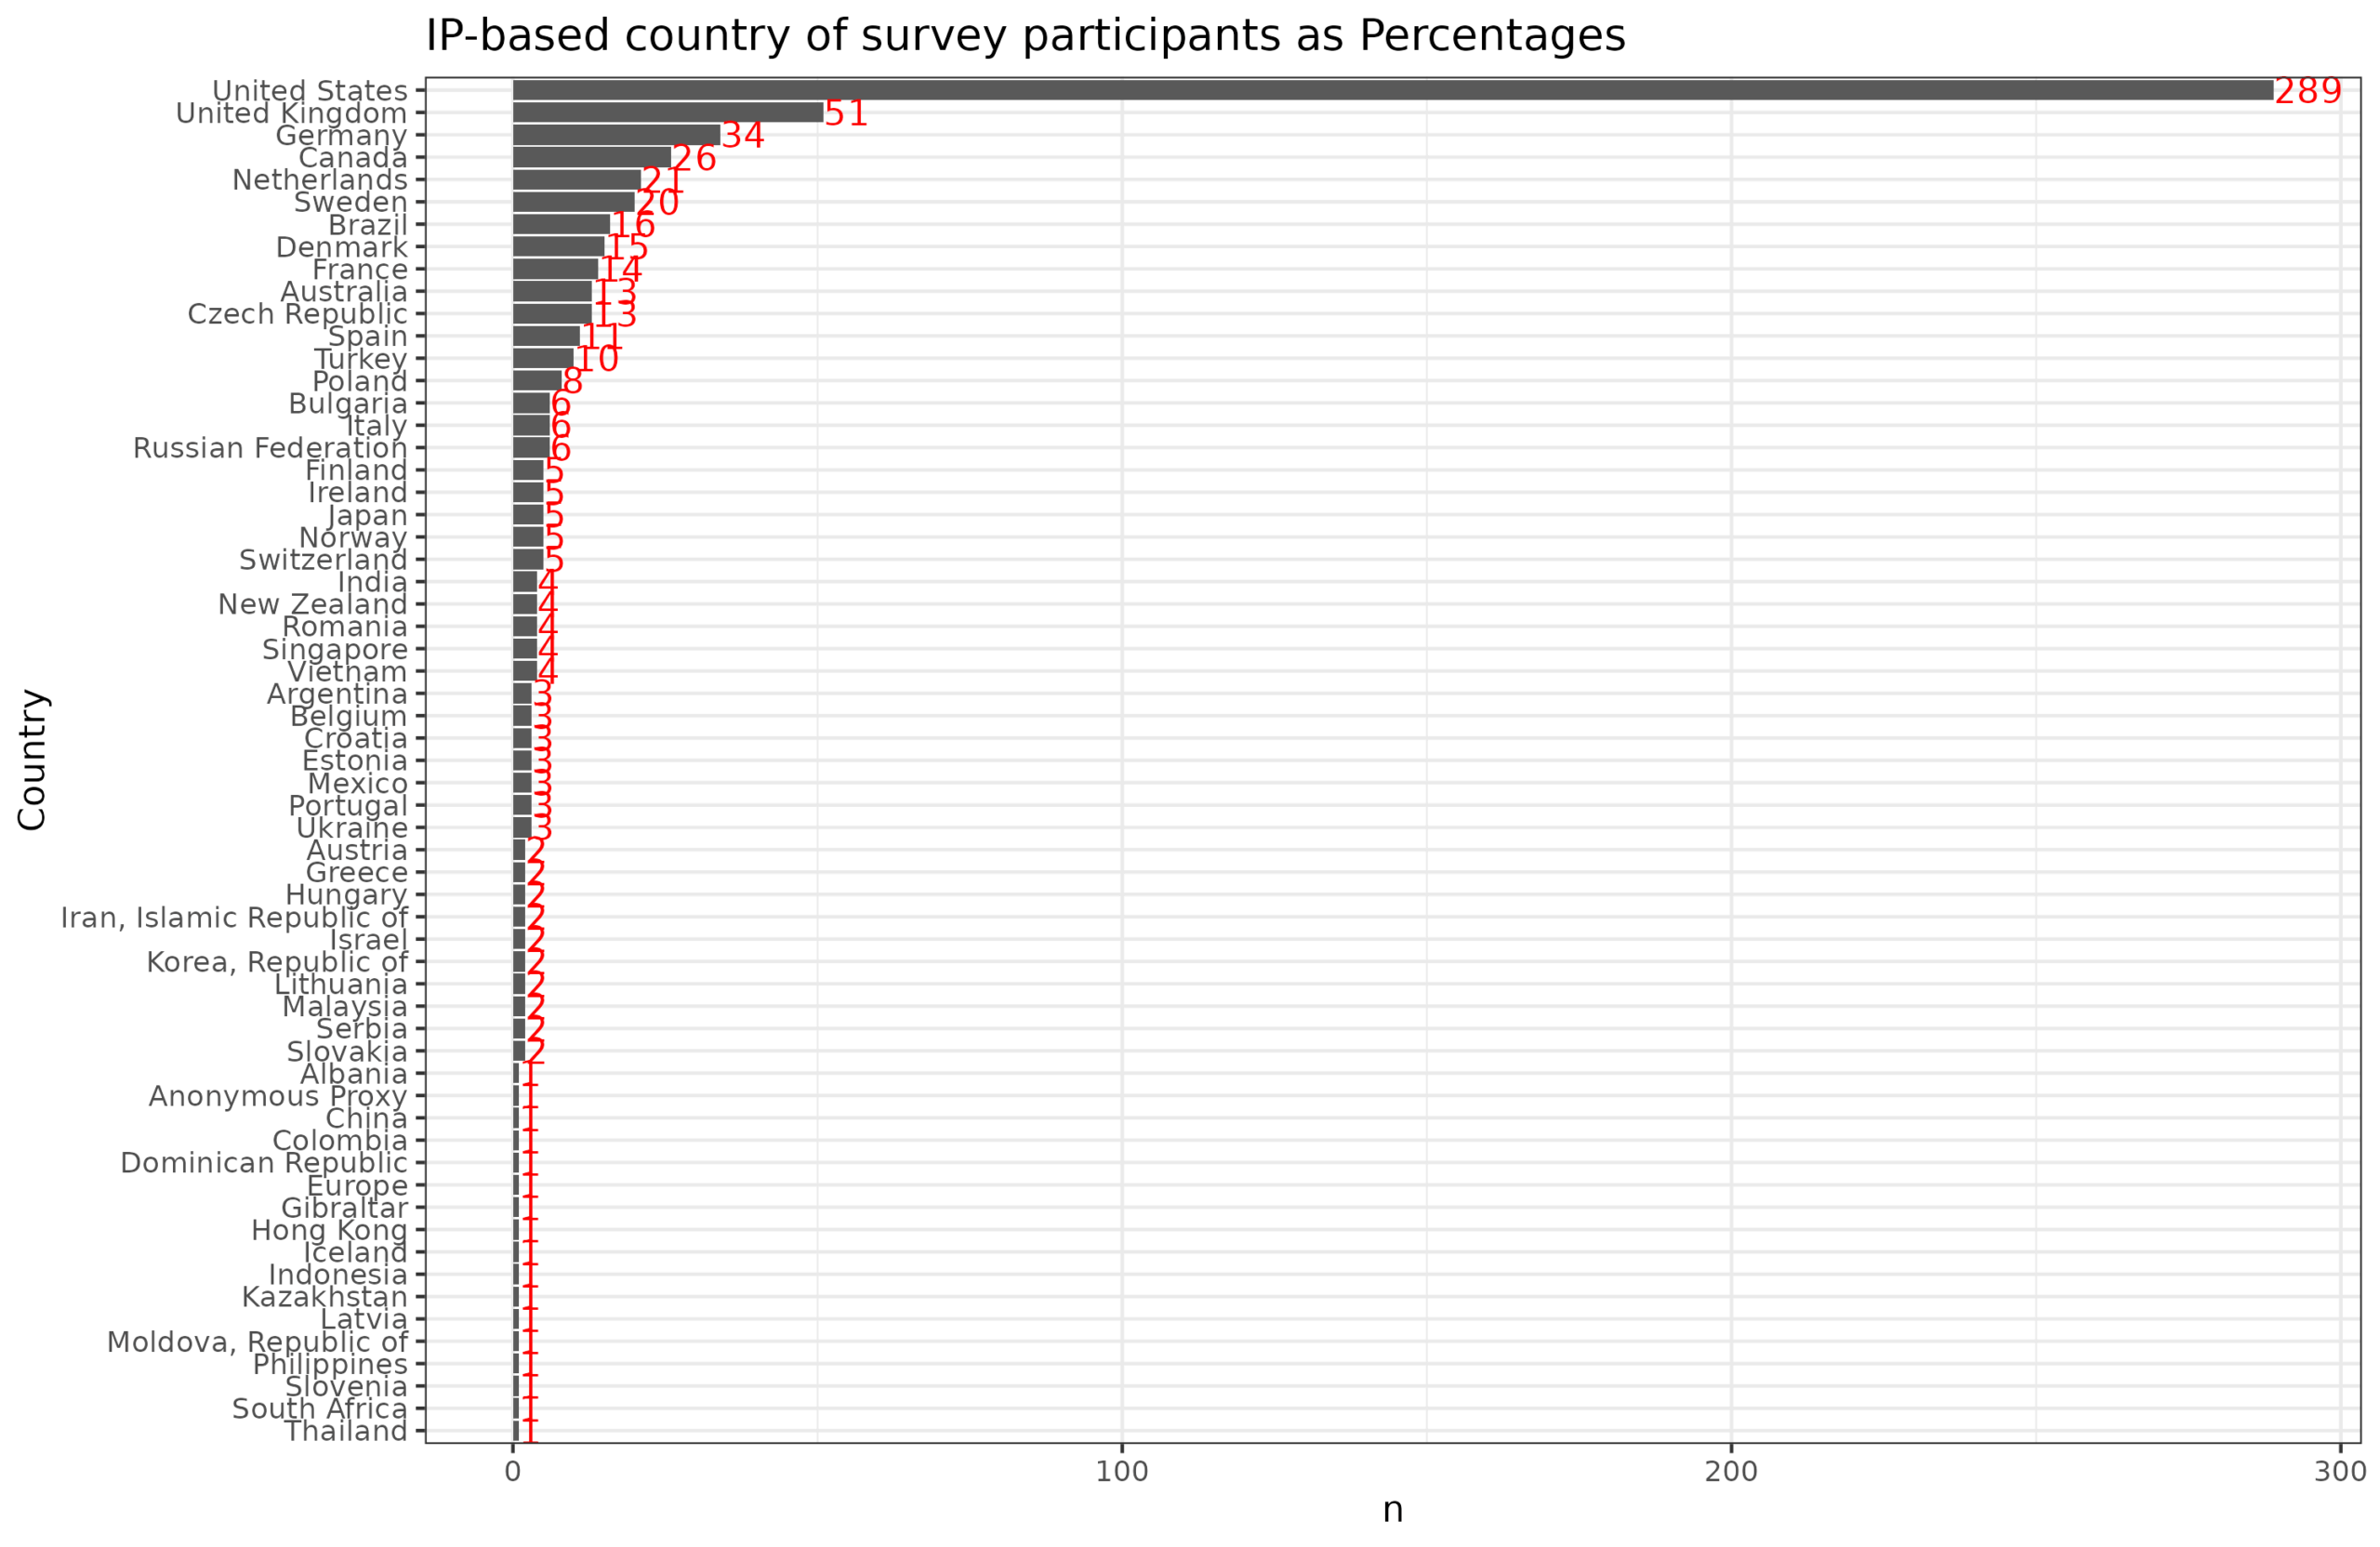
Last time I calculated per capita metrics (and log count residuals). However, you can see from the counts that this may be foolish for the many countries that have 1 reader (possibly a European tourist), and most countries (not shown) have 0. World top 1 country for per capita of readers of this blog is Gibraltar, the smallest population unit from the figure above with 1 reader, giving it a rate of 30/million. We could try the Bayesian approach, which is essentially estimating a global mean (the prior) and adjusting away from that based on the data (better would be a hierarchical Bayesian model taking into account related countries). This is the same method I used for estimating the cinematography skill of countries a few months ago, and which can be used to estimate e.g. between country talent in the Olympics/sportsball:
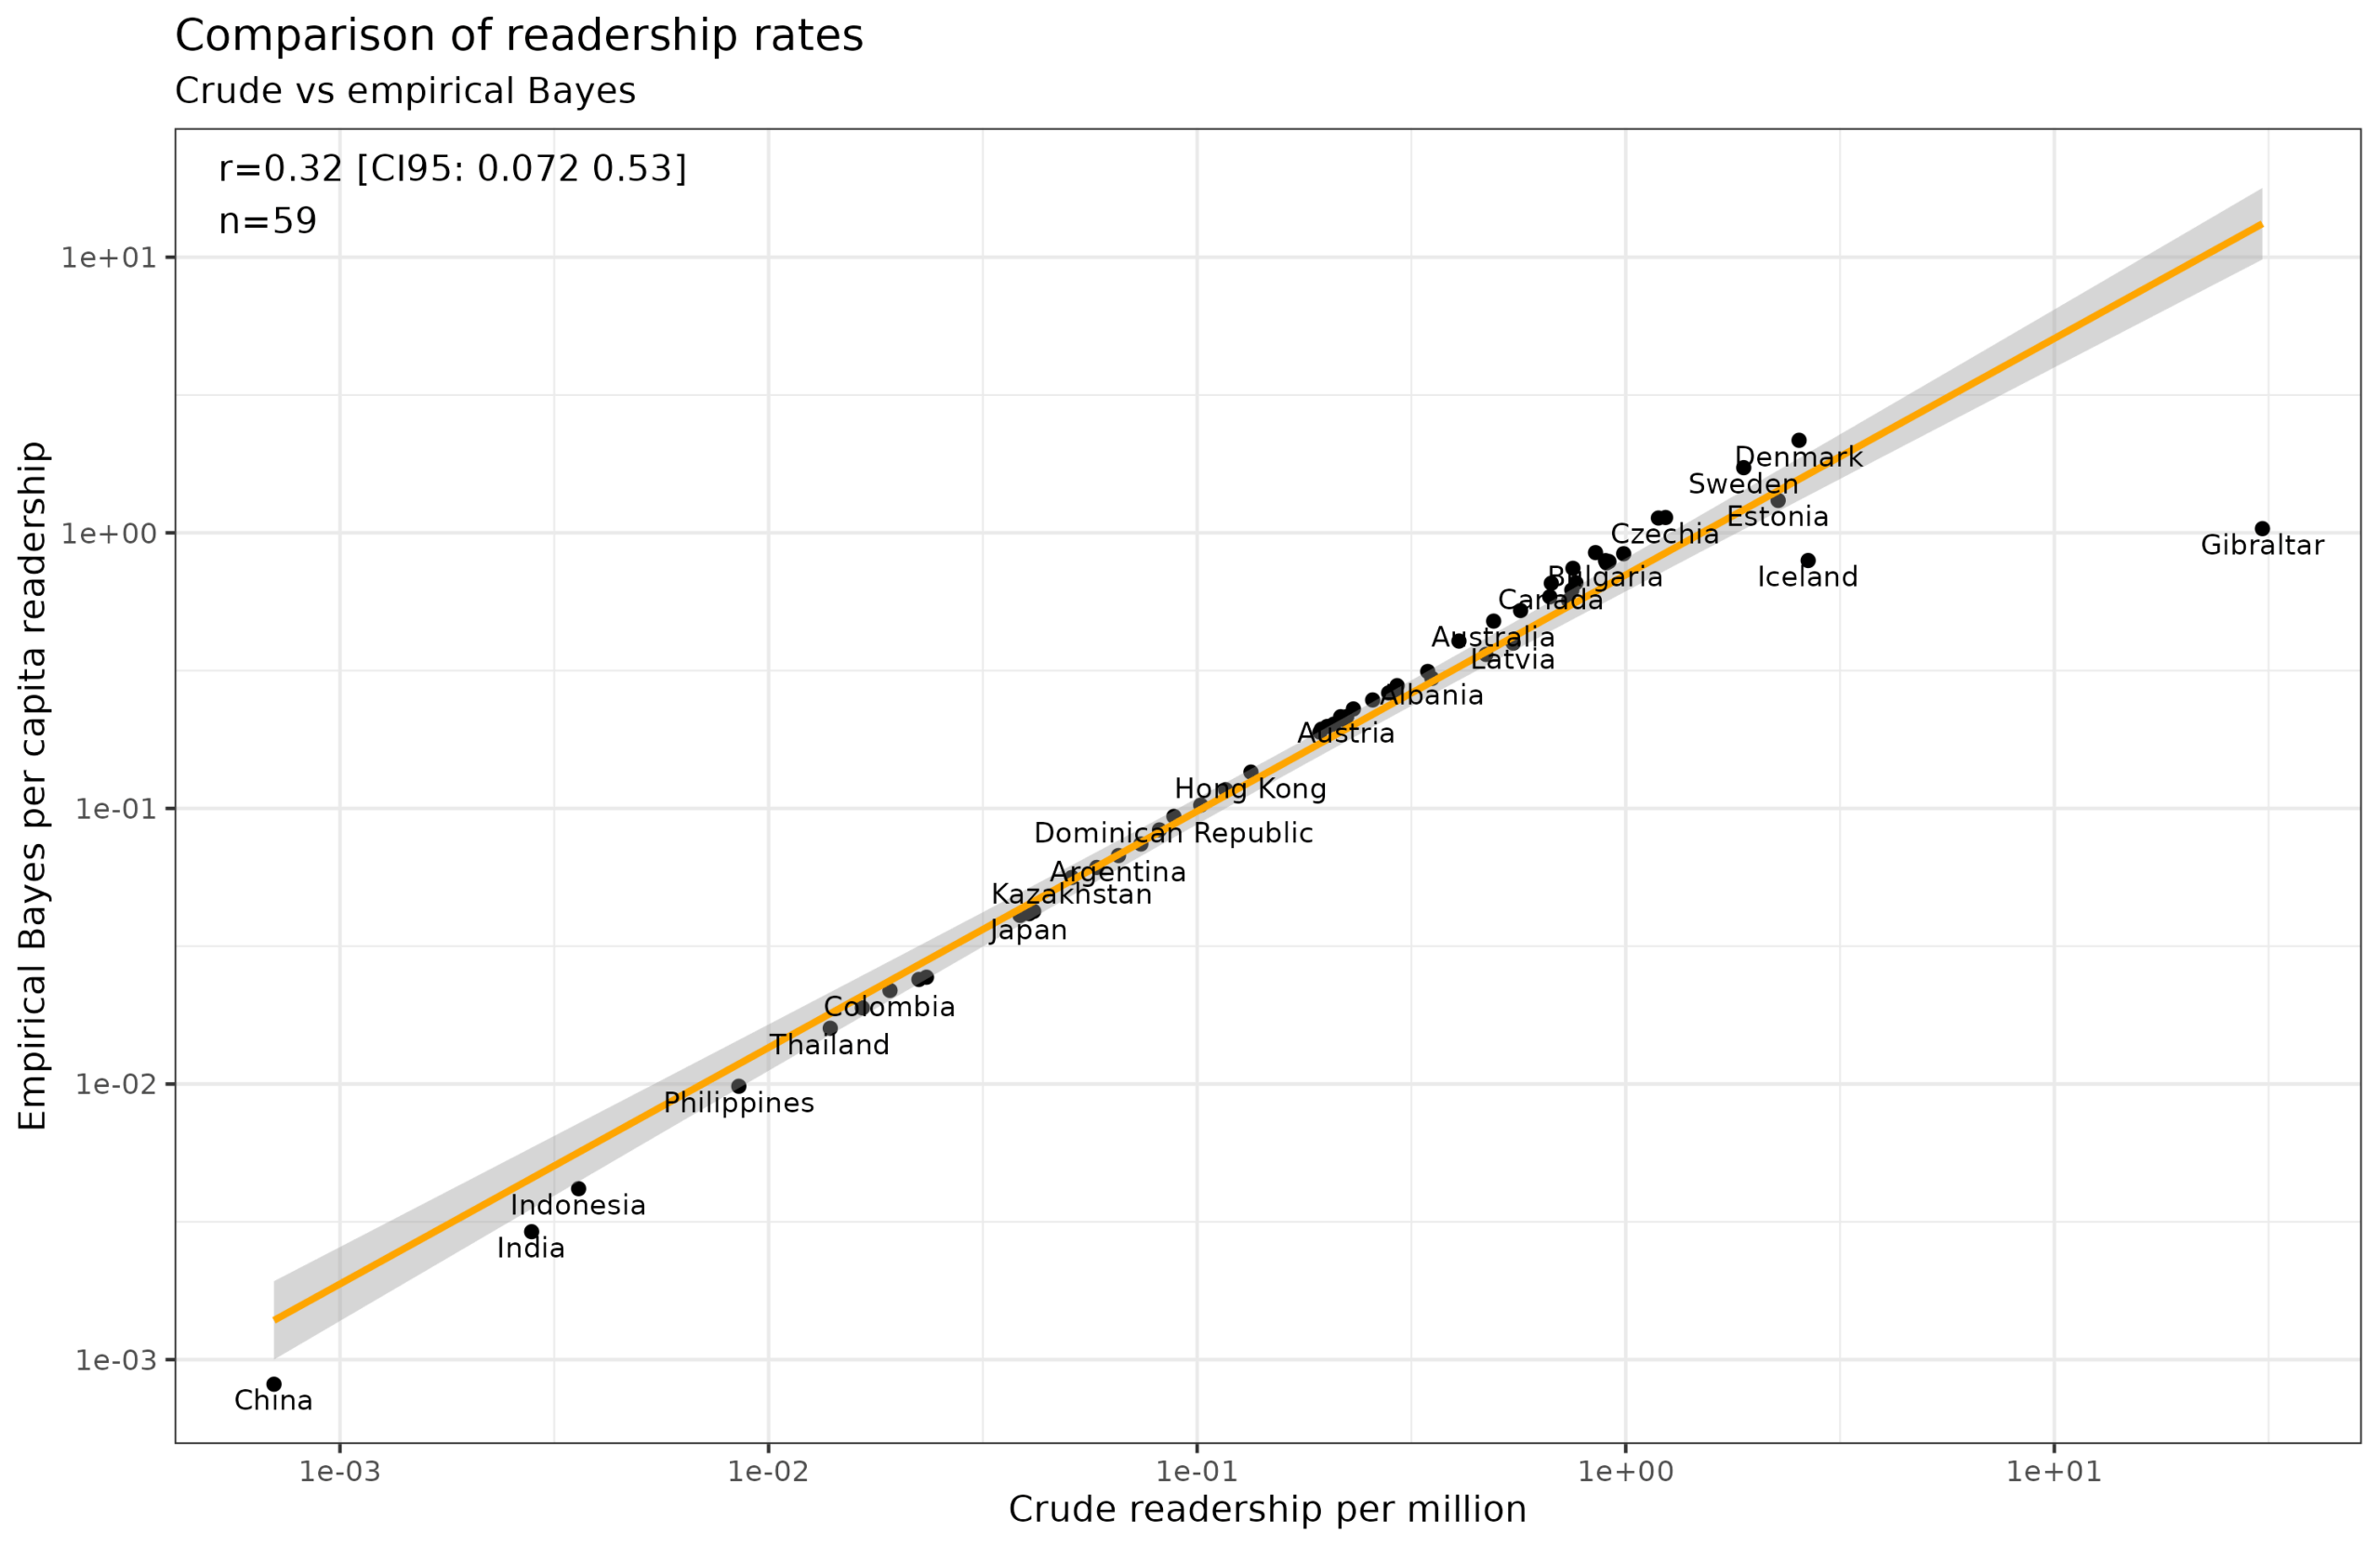
Using the biased (especially for small countries) but more stable method we see that Denmark is number one, as one might expect from a Danish author. Norway also trails behind the other Scandinavians as usual in science. Gibraltar is probably still over-estimated. Oh, and I omitted countries with 0 observations because otherwise they would all line up on the left side and make the plot ugly. These 0 count estimates still have some precision because if we see no readership from a country with 50 million people this doesn't mean the same as no readers from a country with 5 million. On this note, Pakistan was the least Emil-reading country with 0 readers of a population of 240 million.
Given these results, we might also expect that the typical reader has a decent amount of human capital. Education:
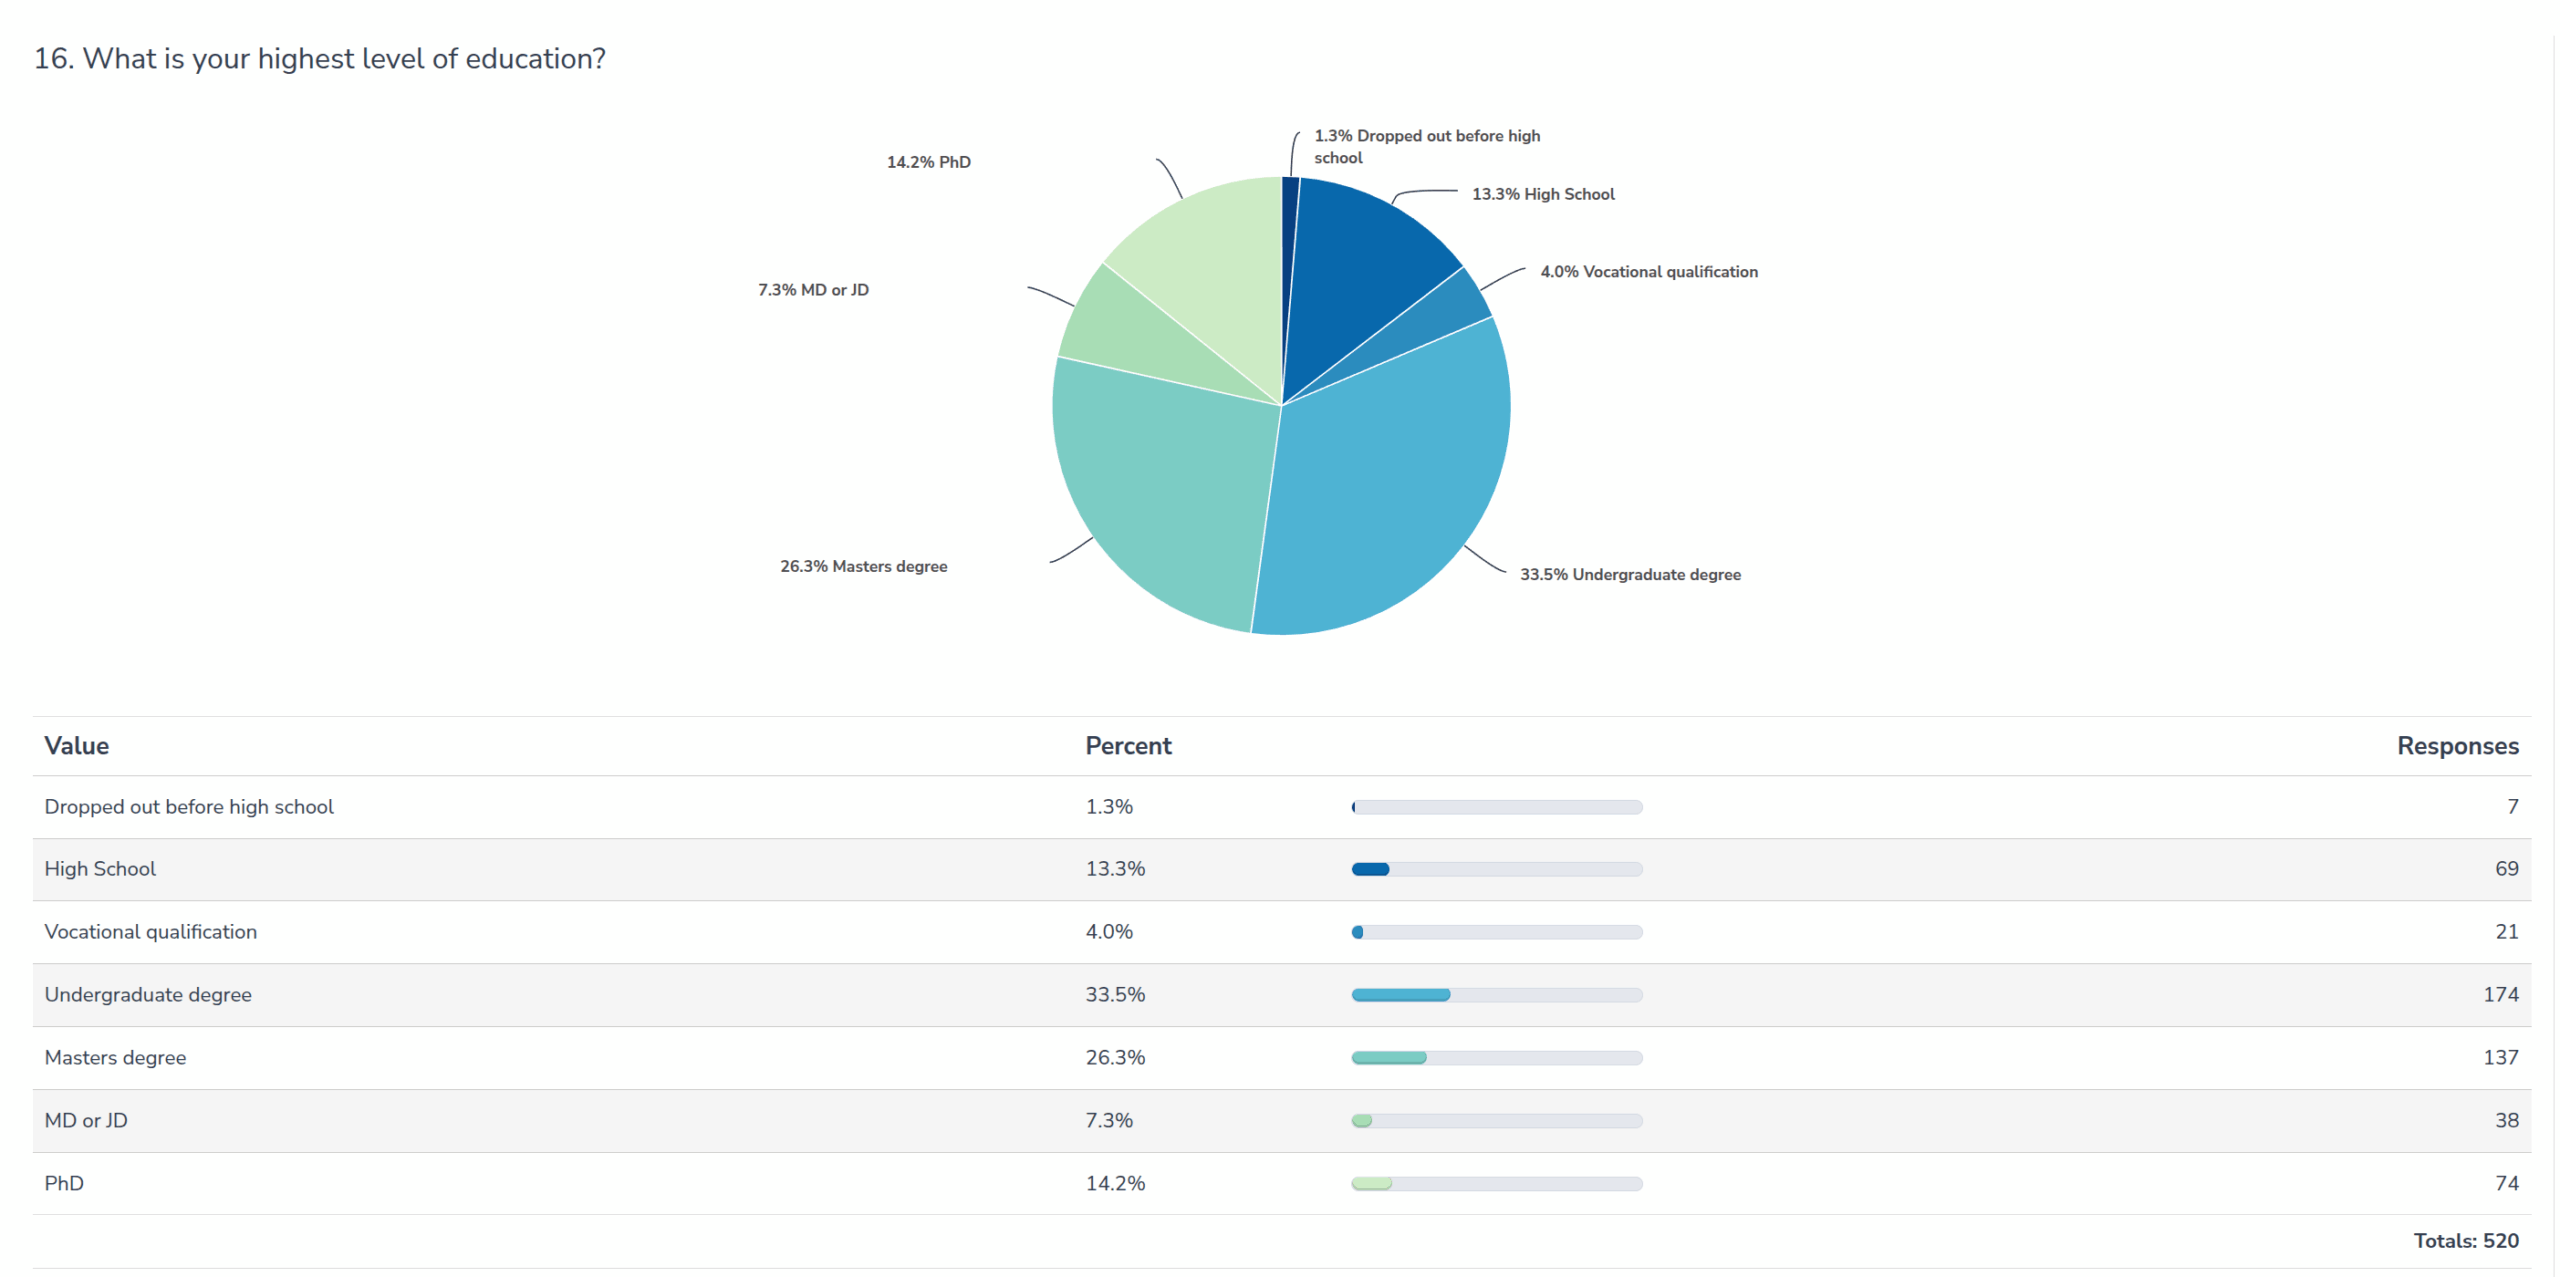
As a matter of fact, almost 50% of readers spent more time at university than I did (3-year bachelor of arts degree in linguistics). A rather amazing 14% have PhDs, at least of those who took the time to fill out surveys (after all, universities select for people who are ok with filling out paperwork).
In terms of religion:
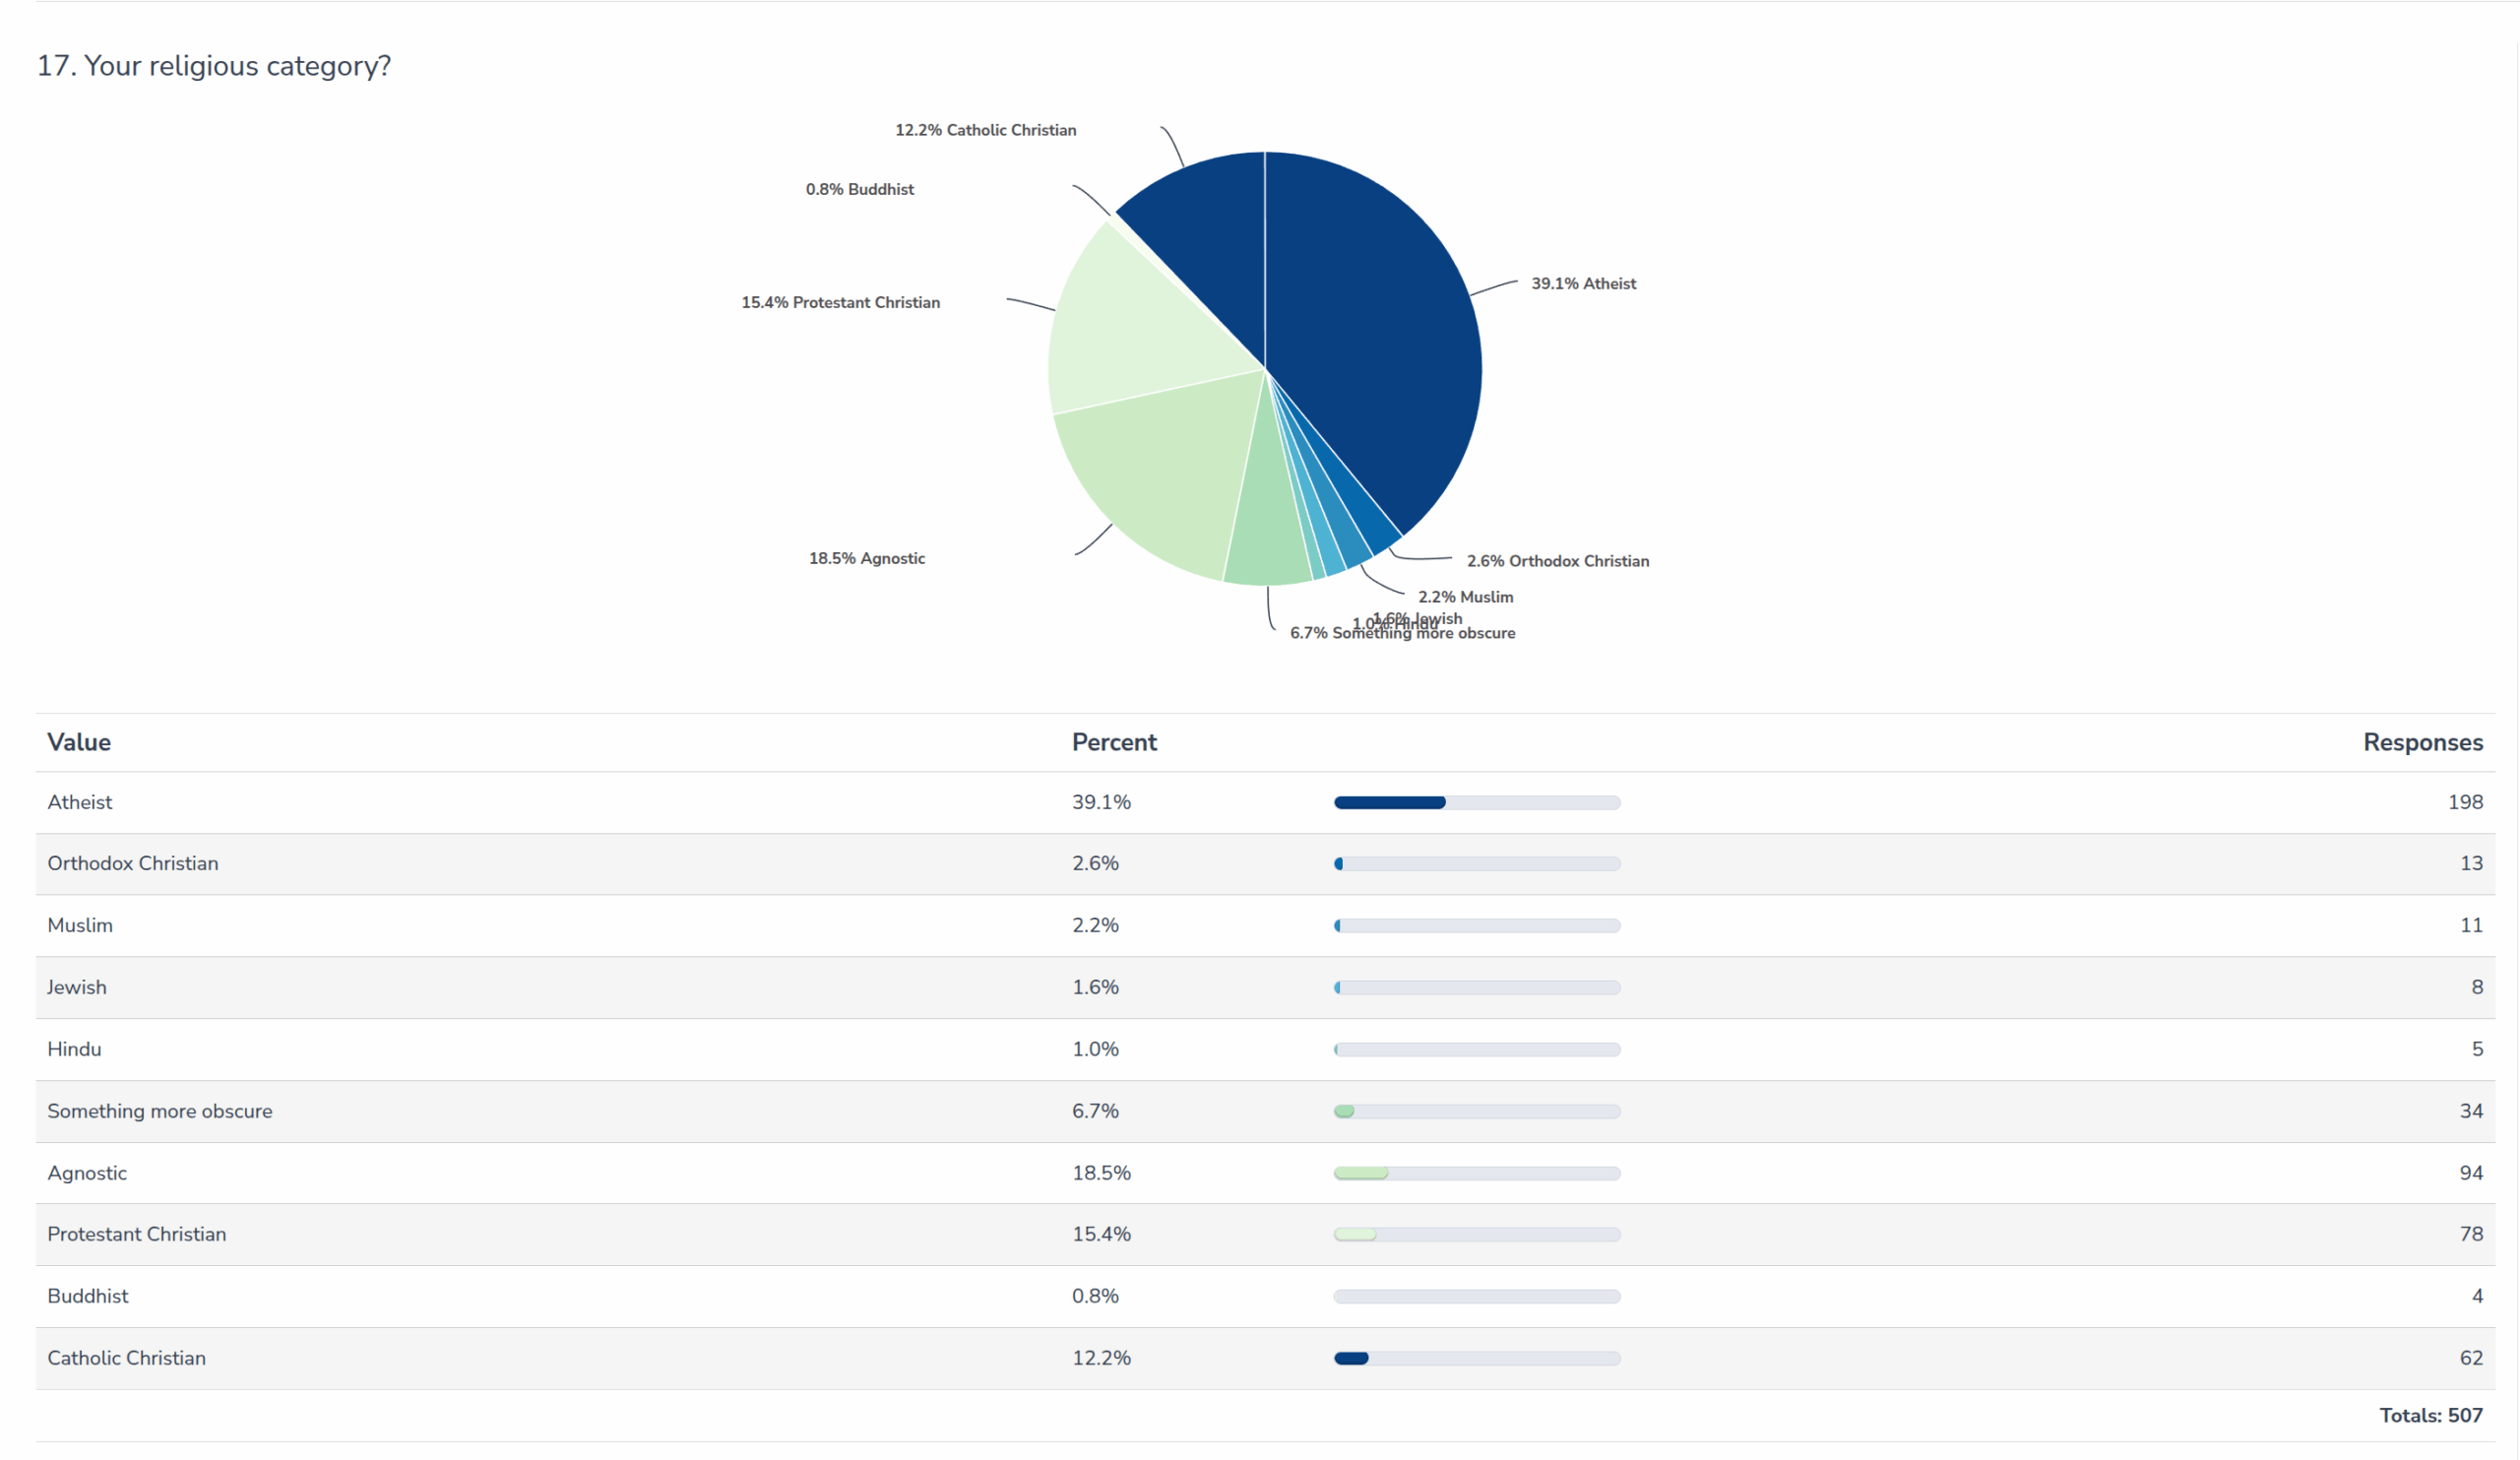
Non-religious (atheist and agnostic) are nearly 50% of readers, and the largest remaining category are Christians (15% Protestant, 12% Catholic, 3% Orthodox), with small numbers of the remaining groups.
Closely related to religion is morality. This was a new question I put in this year due to recent debates in the friend group:
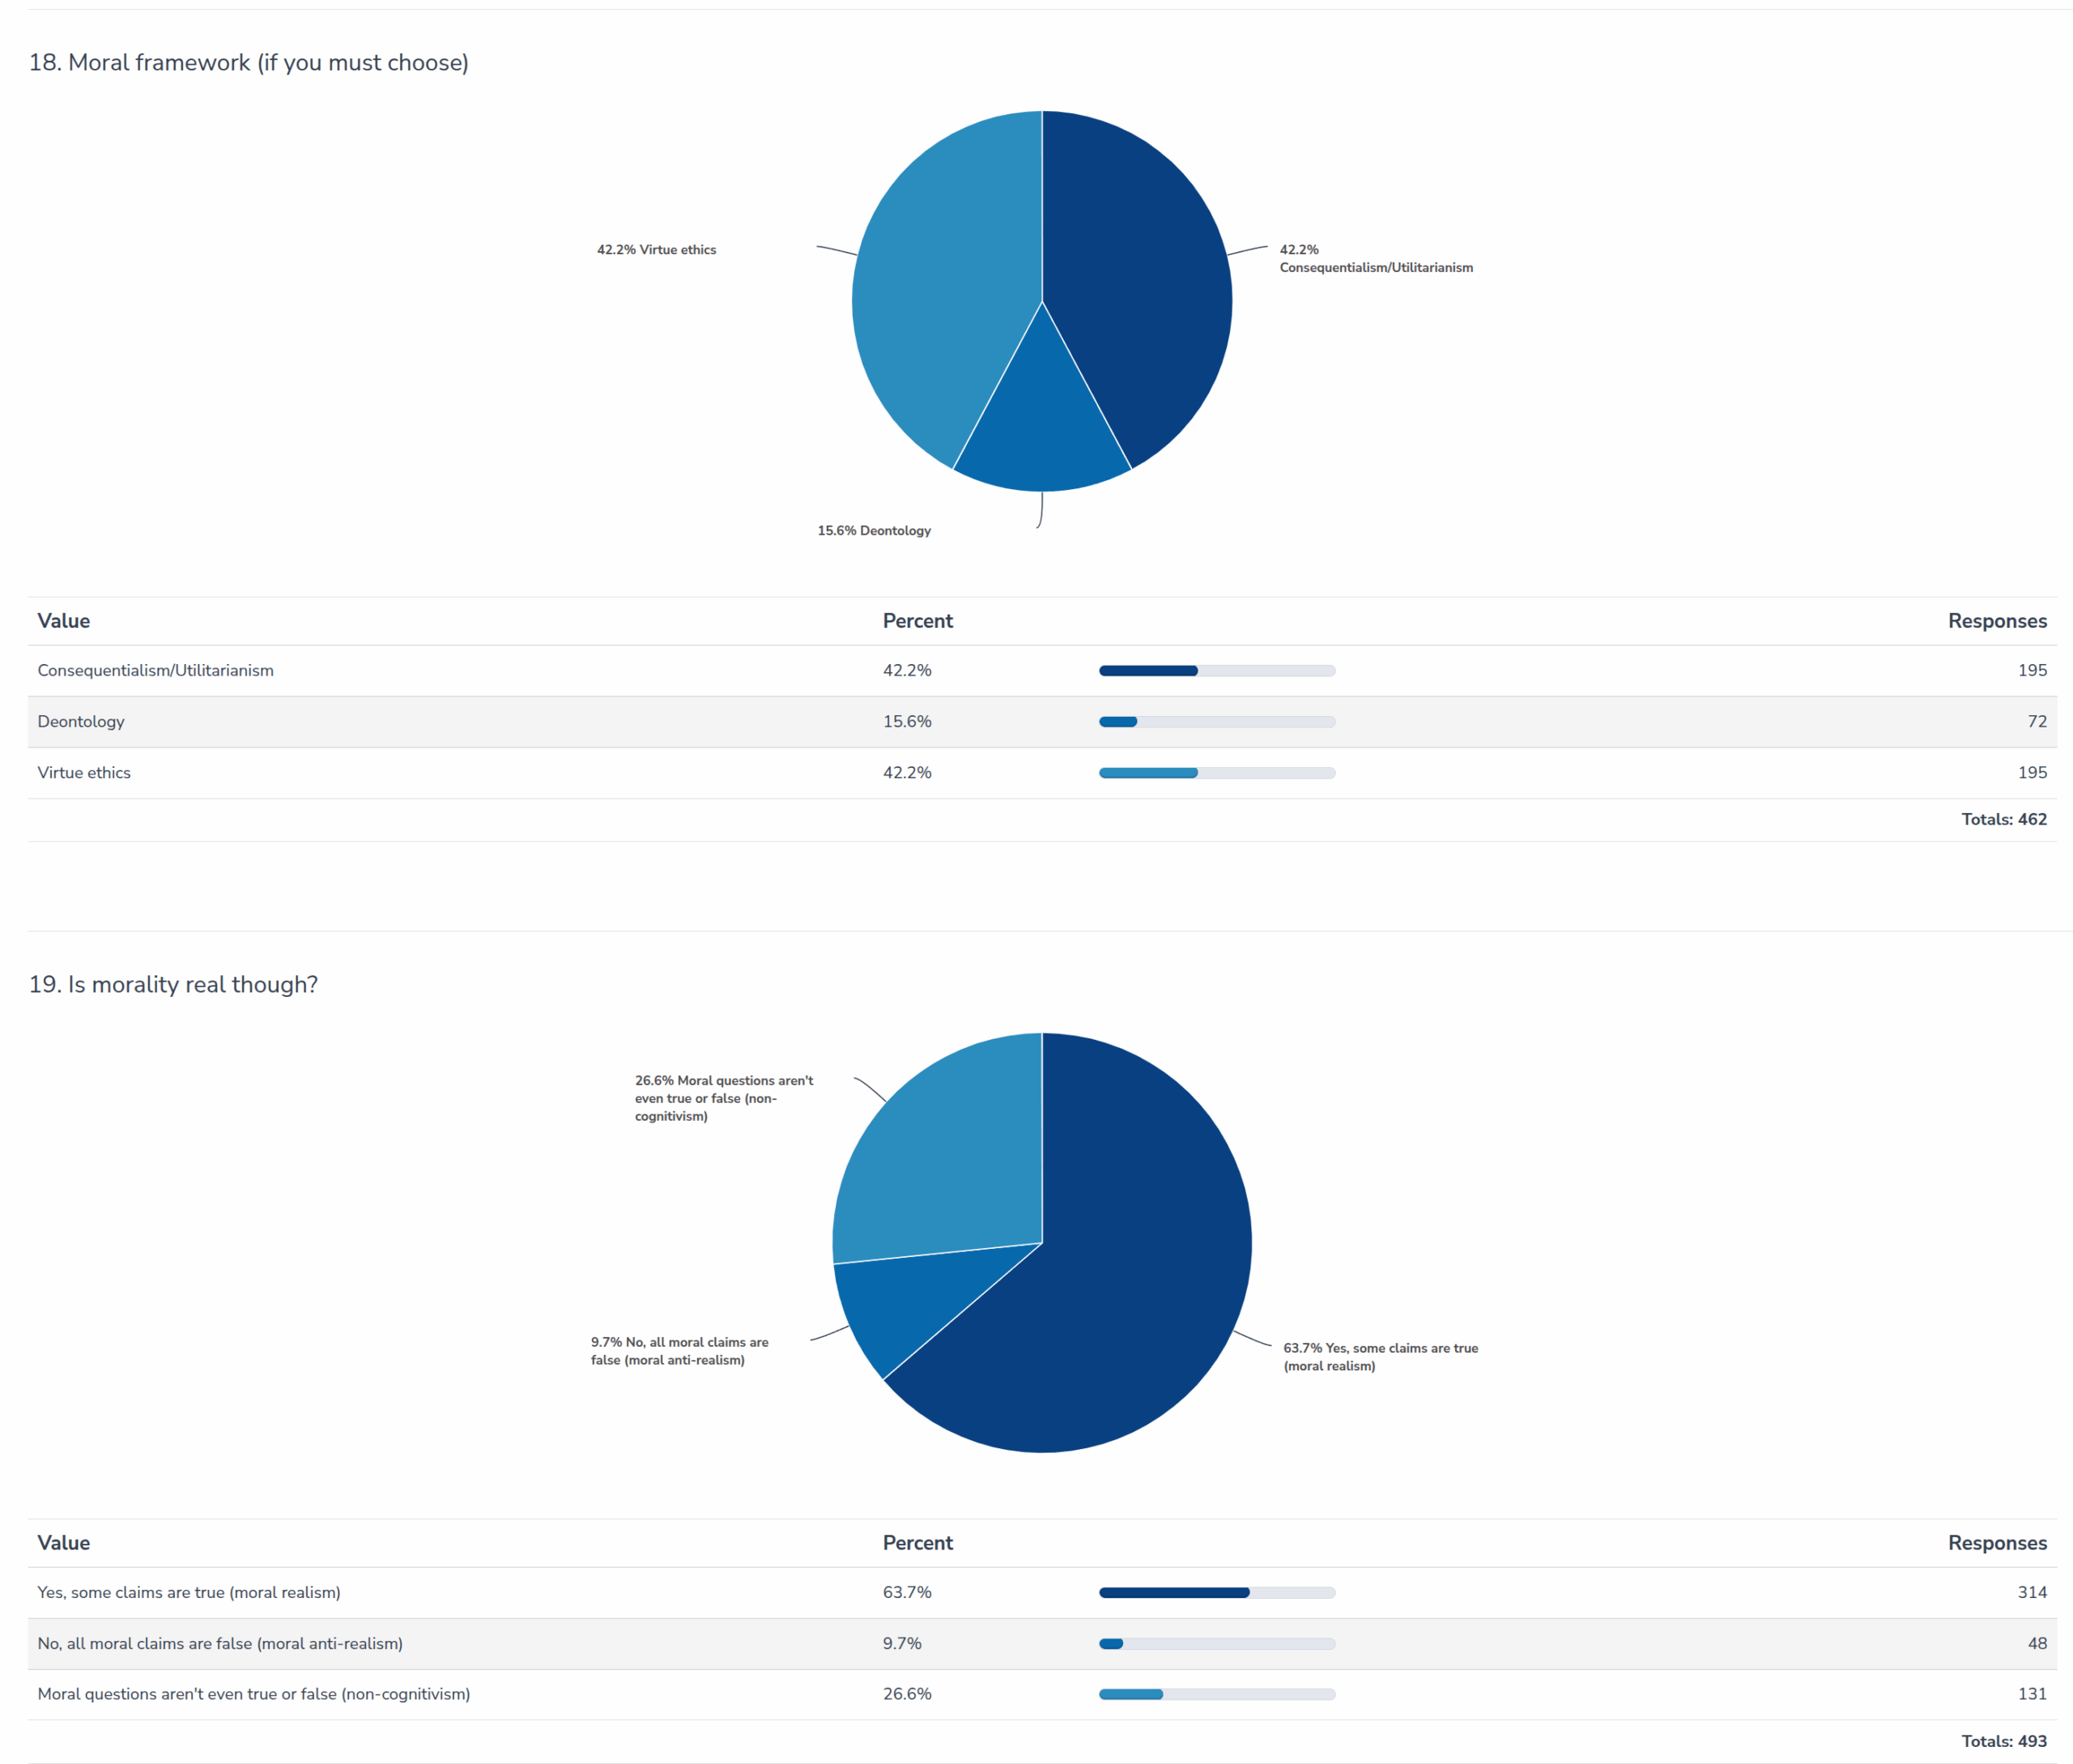
I was surprised to see that virtue ethics is equally popular to consequentialism. I basically never write about virtue ethics, but I do occasionally say things about consequentialism/utilitarianism (mostly criticism). In terms of moral realism stance, 64% think there are some true claims (probably some of their own), a sizable chunk of non-cognitivists (moral statements are best understood as expressing emotions or preferences, and don't even have truth values, a view typical of positivists/the Vienna Circle), and only a minority are error theorists/anti-realists. Here it would also be interesting to look at their combinations:
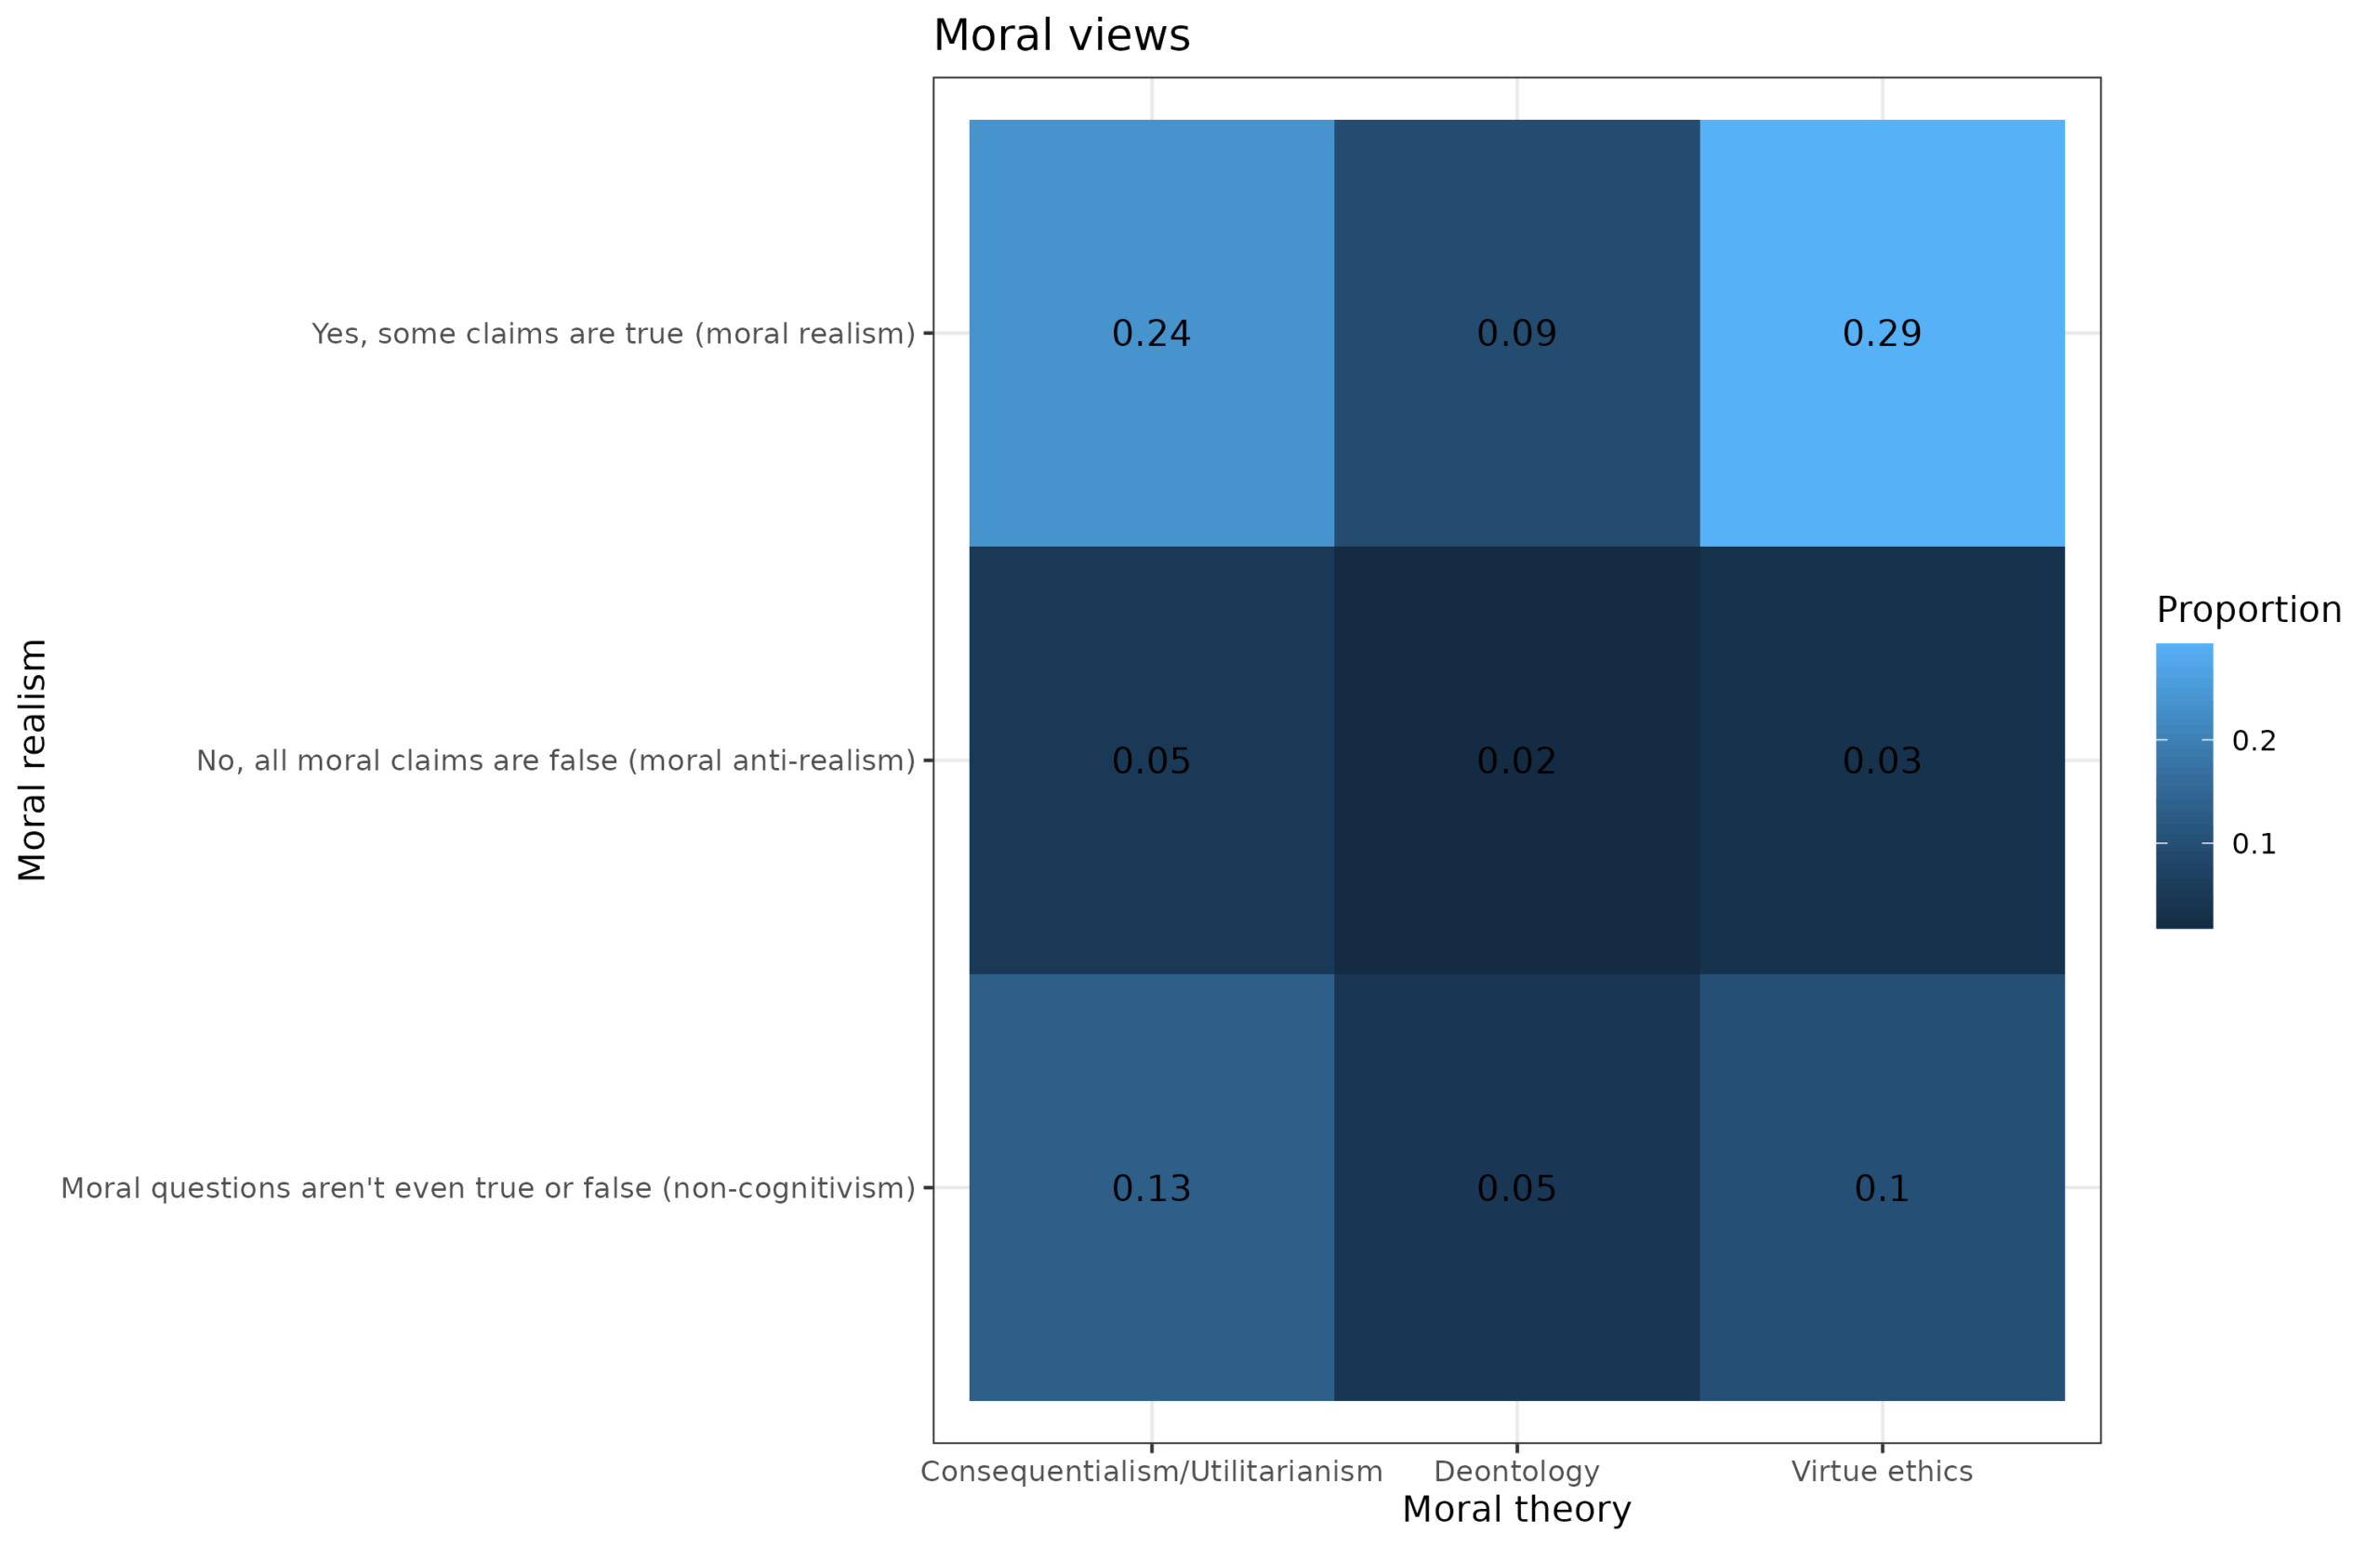
The results were perhaps not terribly illuminating. The most popular stance was that some moral claims are true but that these take the form of virtues that one should aspire to. This aligns with the current memes about being like Gigachad (based) and not being like Soyjak (cringe). Among consequentialists, there were a lot of non-realists, almost as many as the realists. Perhaps they think we can use utilitarian frameworks, but that this is a kind of useful fiction (I am inclined to agree).
Regarding favorite colors, there was a lesson to be learned in poor survey design:
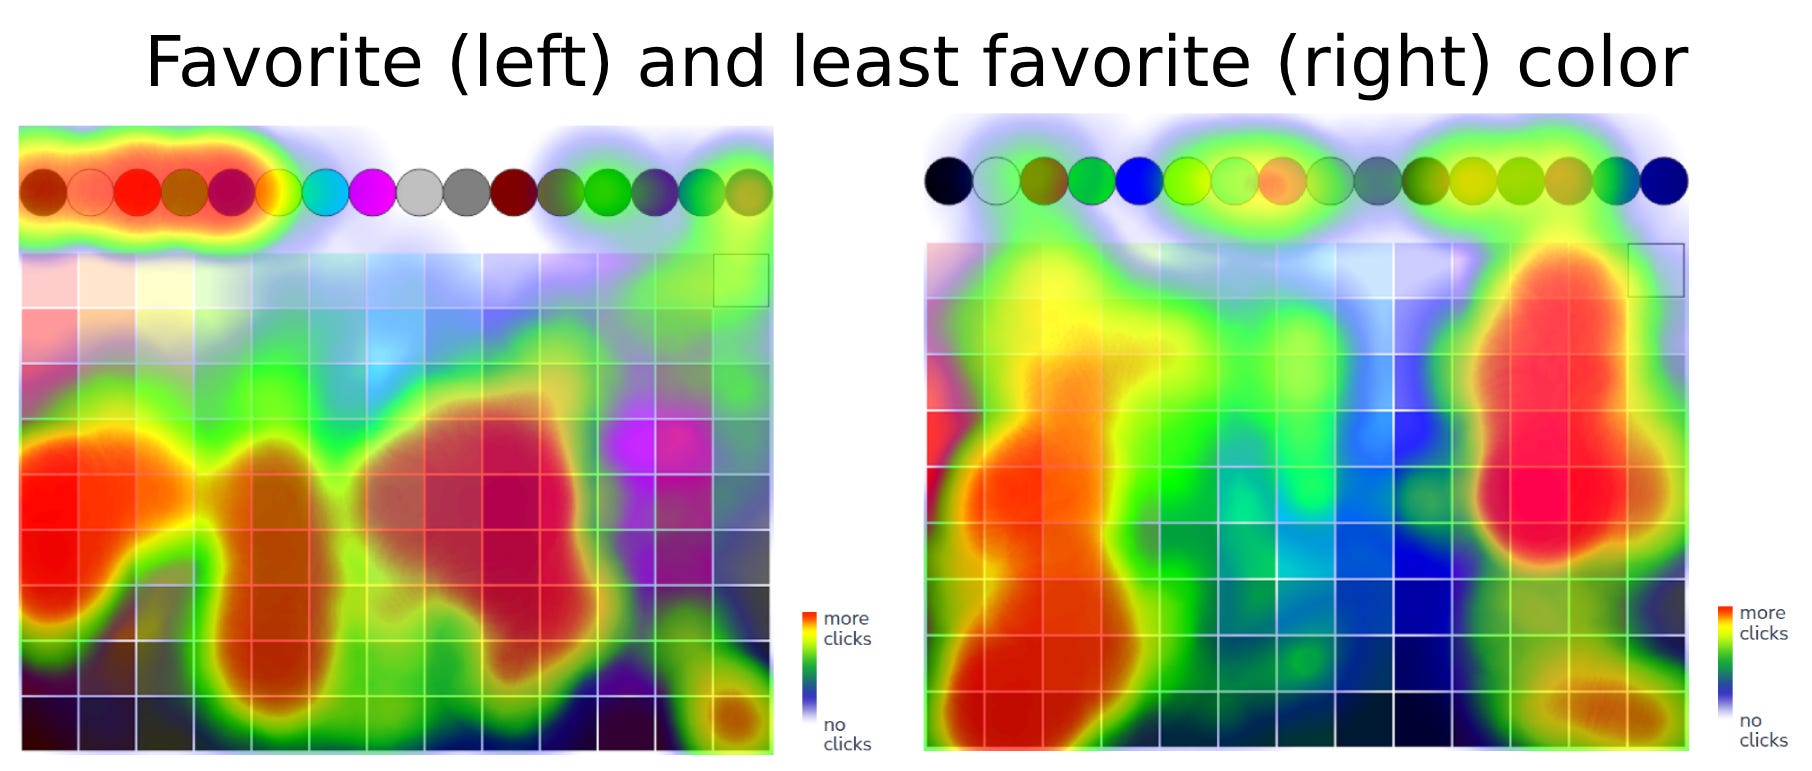
I suspect that color preferences correlate with something interesting, aside from sex (men like blue). However, given that many people choose some of the bottoms in the top of the image, I am not so easily able to extract the information. I mean, it can be done if I manually map each position to the fitting RGB code, and maybe this reveals something interesting. Since readers are 90% male, it is not so surprising that blue colors are liked and pink/purple not so much. Very light colors were unpopular as were the almost black ones.
Regarding art, I had people select their favorite art piece from a collection. I also neglected to give them proper filenames, so now we know that the most favored piece was "Screenshotfrom20250527051940.png". I doctored this overview in Photopea:
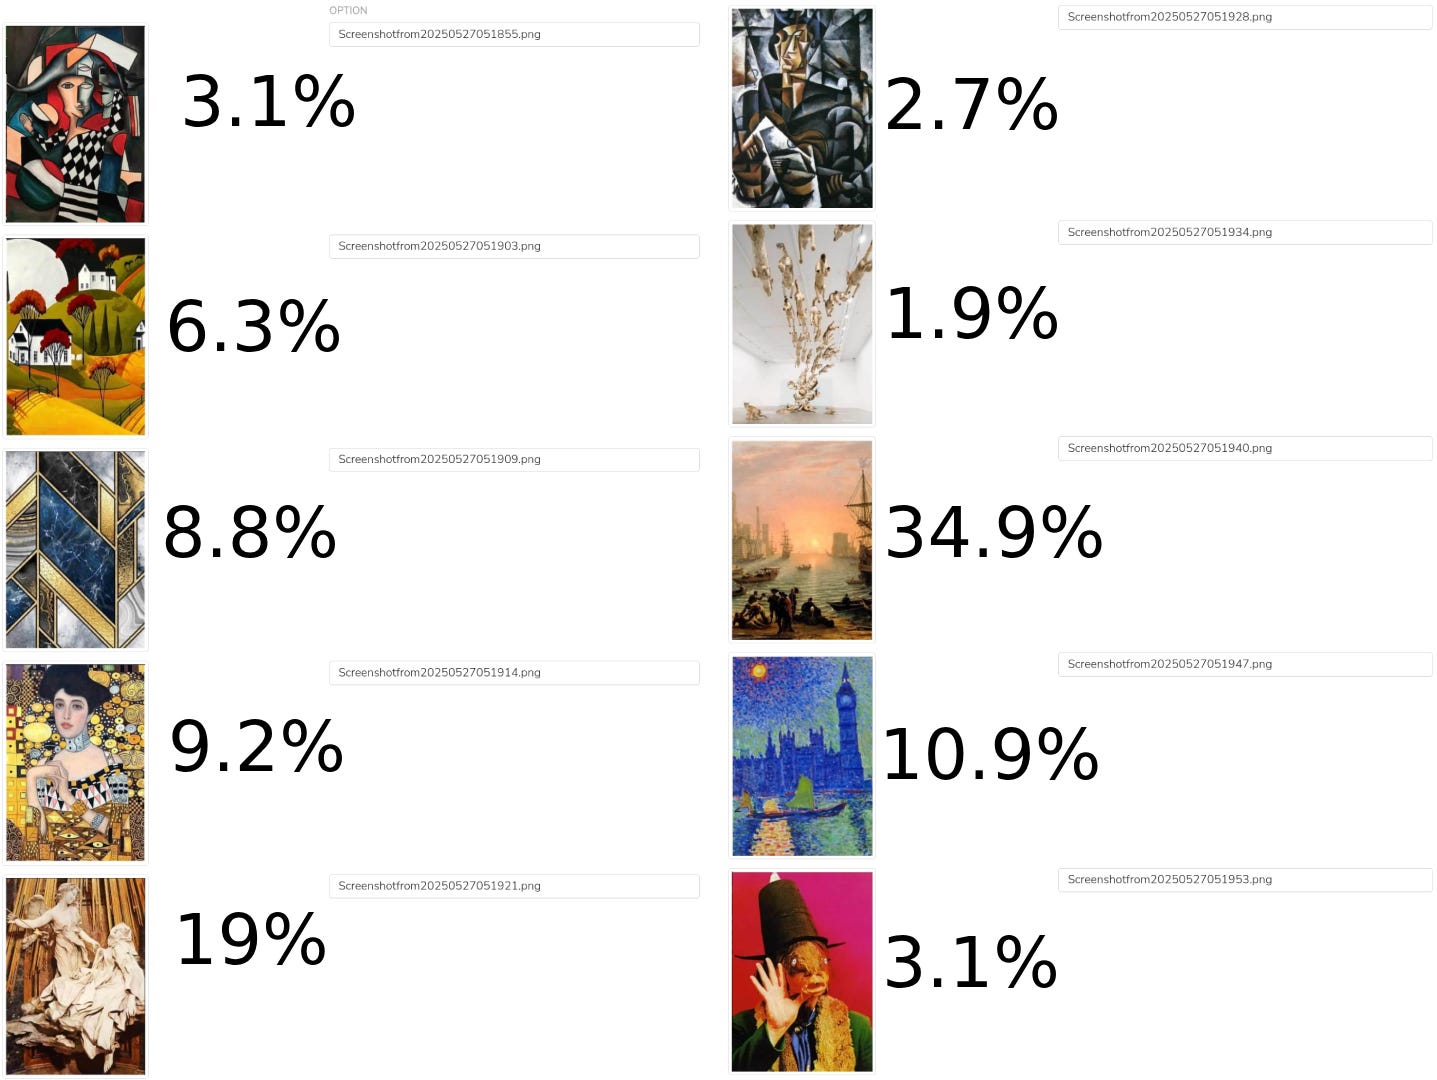
Readers didn't like the polar bears in the ceiling, but they did like the nice ships, and the classical sculpture. I like the fish man. There's research showing that art preferences align with politics, making them useful as covert measures (if one wants those, say on applications where discrimination is possibly illegal). Not much work has been done on this, so I am interested in doing more of this. The question here in my survey was a test of one approach (probably better is to have people rate each piece of rate).
What about money? Emils gotta eat too:
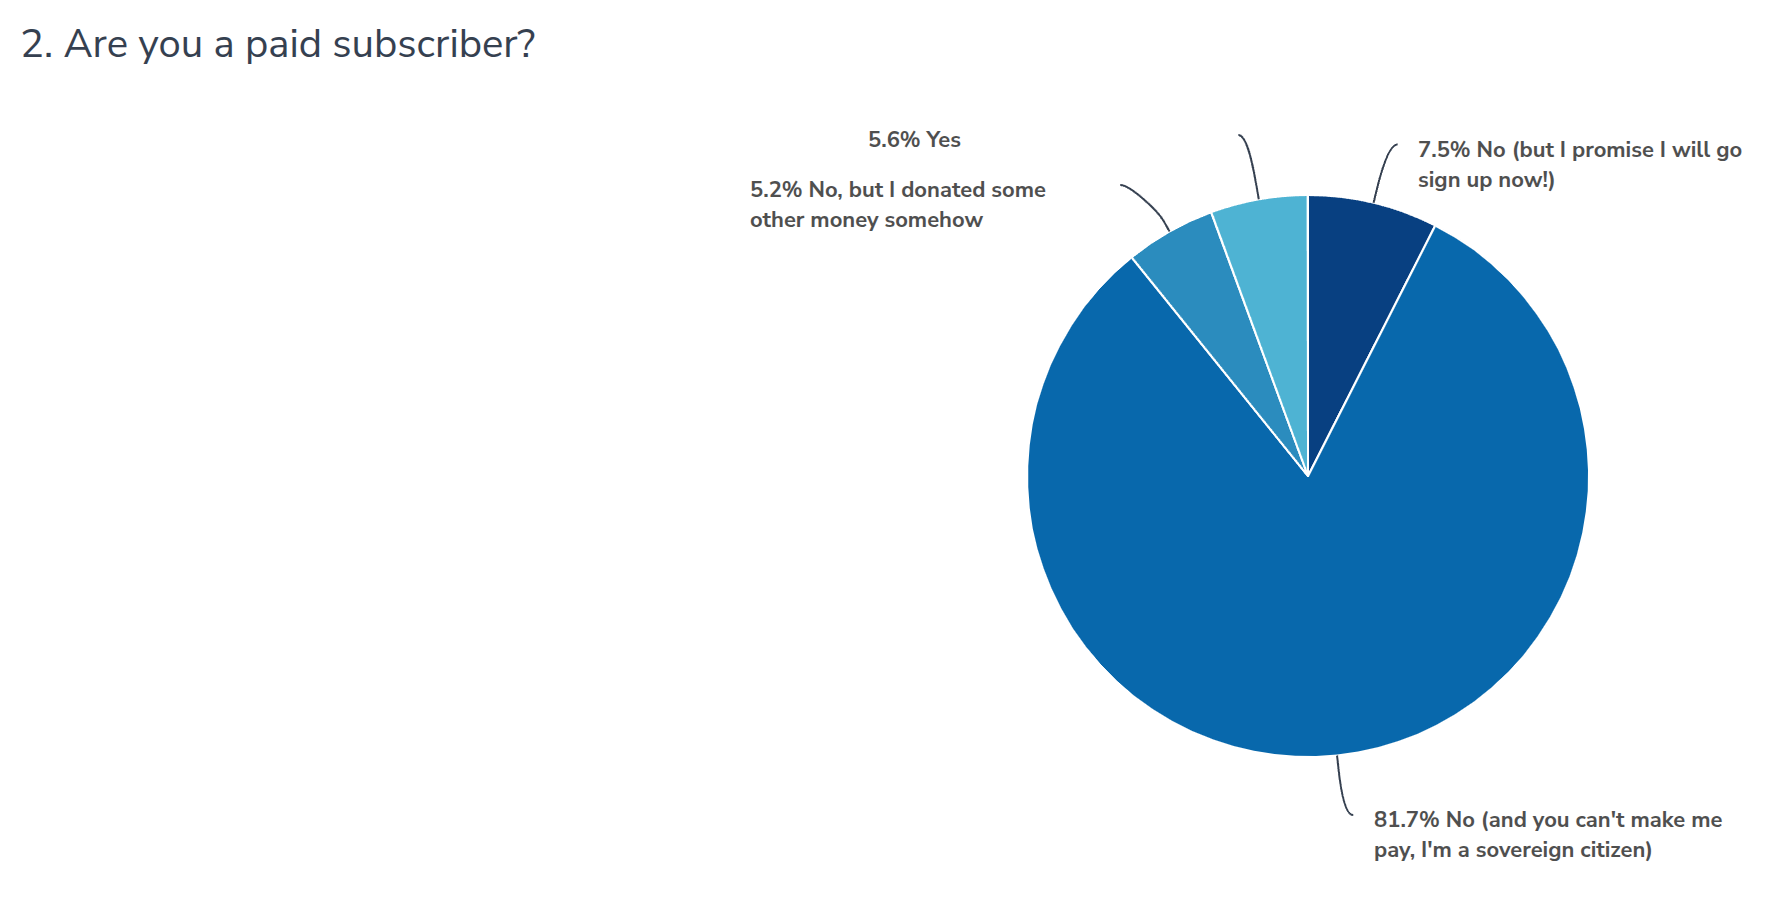
My various attempts at shaming people into submission have unfortunately not been overly successful. Every year some 7% of people promise to definitely become paid subscribers, which they mostly don't (or maybe they do, but others stop). 7.5% of 664 is 50 people. The post stats shows that 2 people signed up, so 2/50 or 4%. Whatever the case, it turns out that if you give all your writings away for free, you aren't likely to be making a killing.
Speaking of money, I asked you how I make you give me more money. My guess was that many wanted the nerd videos to come back:
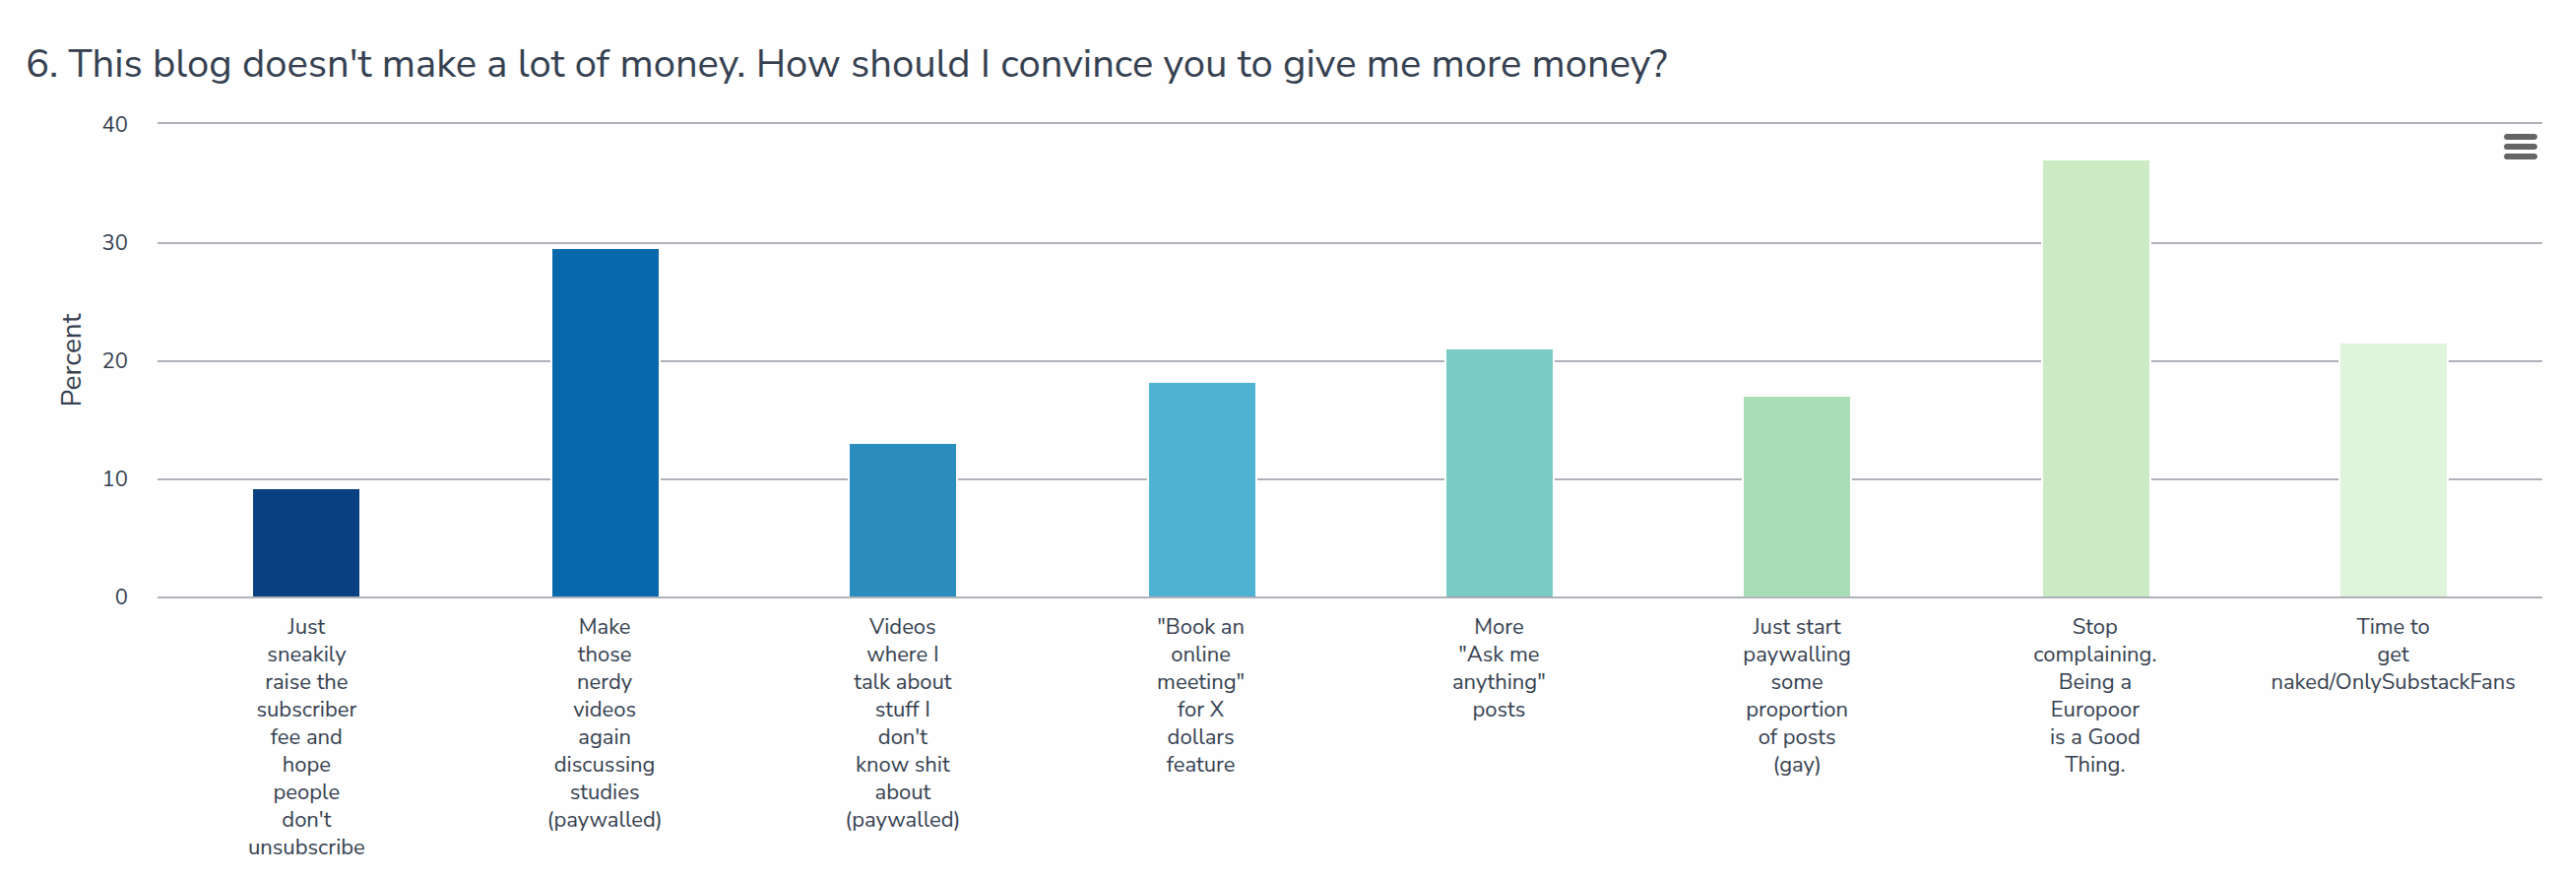
The most common category was that poverty is virtue (if you are in Europe), however, disregarding that, the videos were in fact the most requested offer, so I will have to make good of it in the near future. I am also sorry to report that I will not be opening an OnlySubstackFans account (well, unless you pay very well).
When did people start reading the blog?:
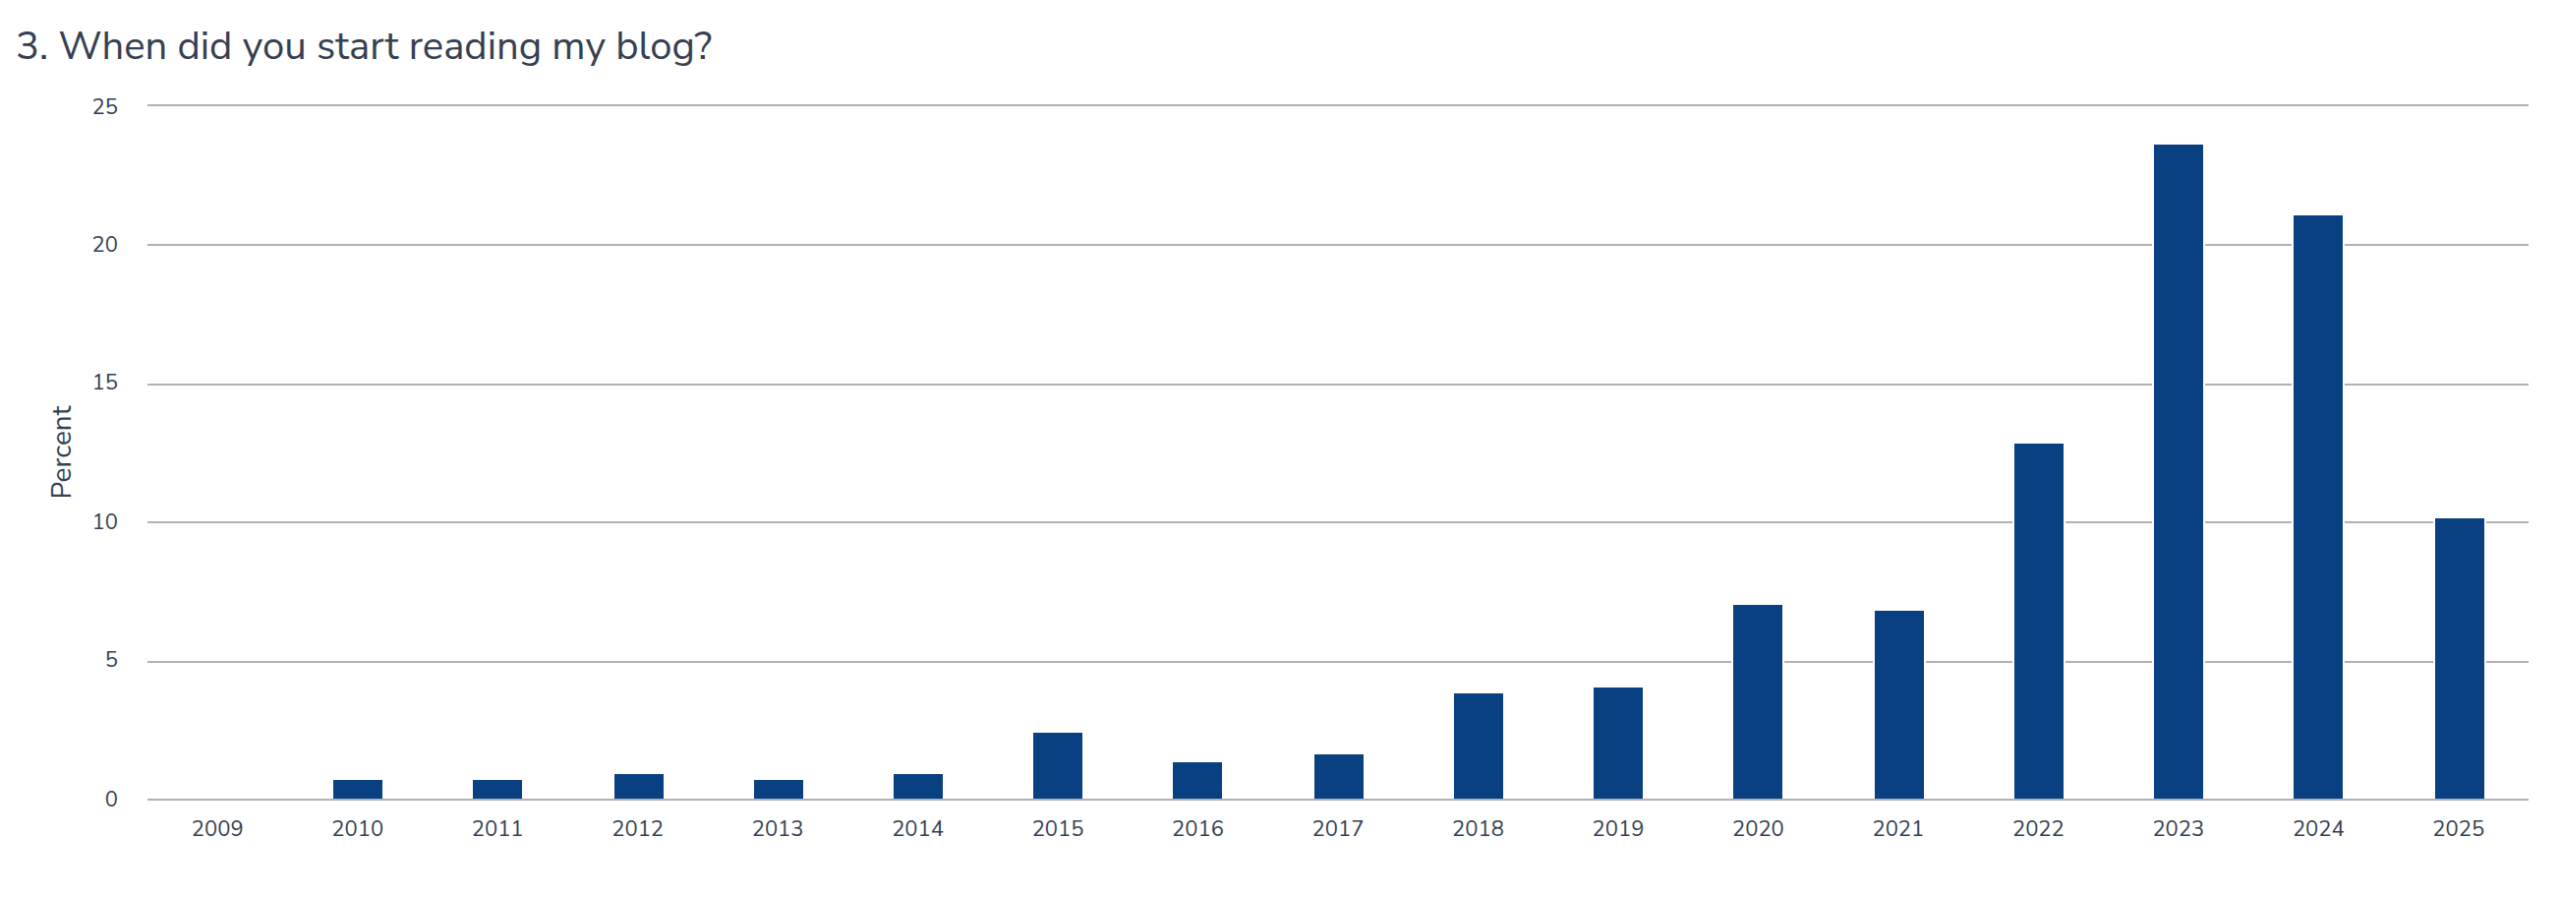
Most readers are fairly recent (welcome). This is a consequence of the growth rate being pretty linear. It would have to be superlinear for most readers to be in the last 2 categories in each survey.
One thing about writing a lot -- I write about 100 posts a year -- is that one may be running out of ideas, and the quality will deteriorate. So has it?:
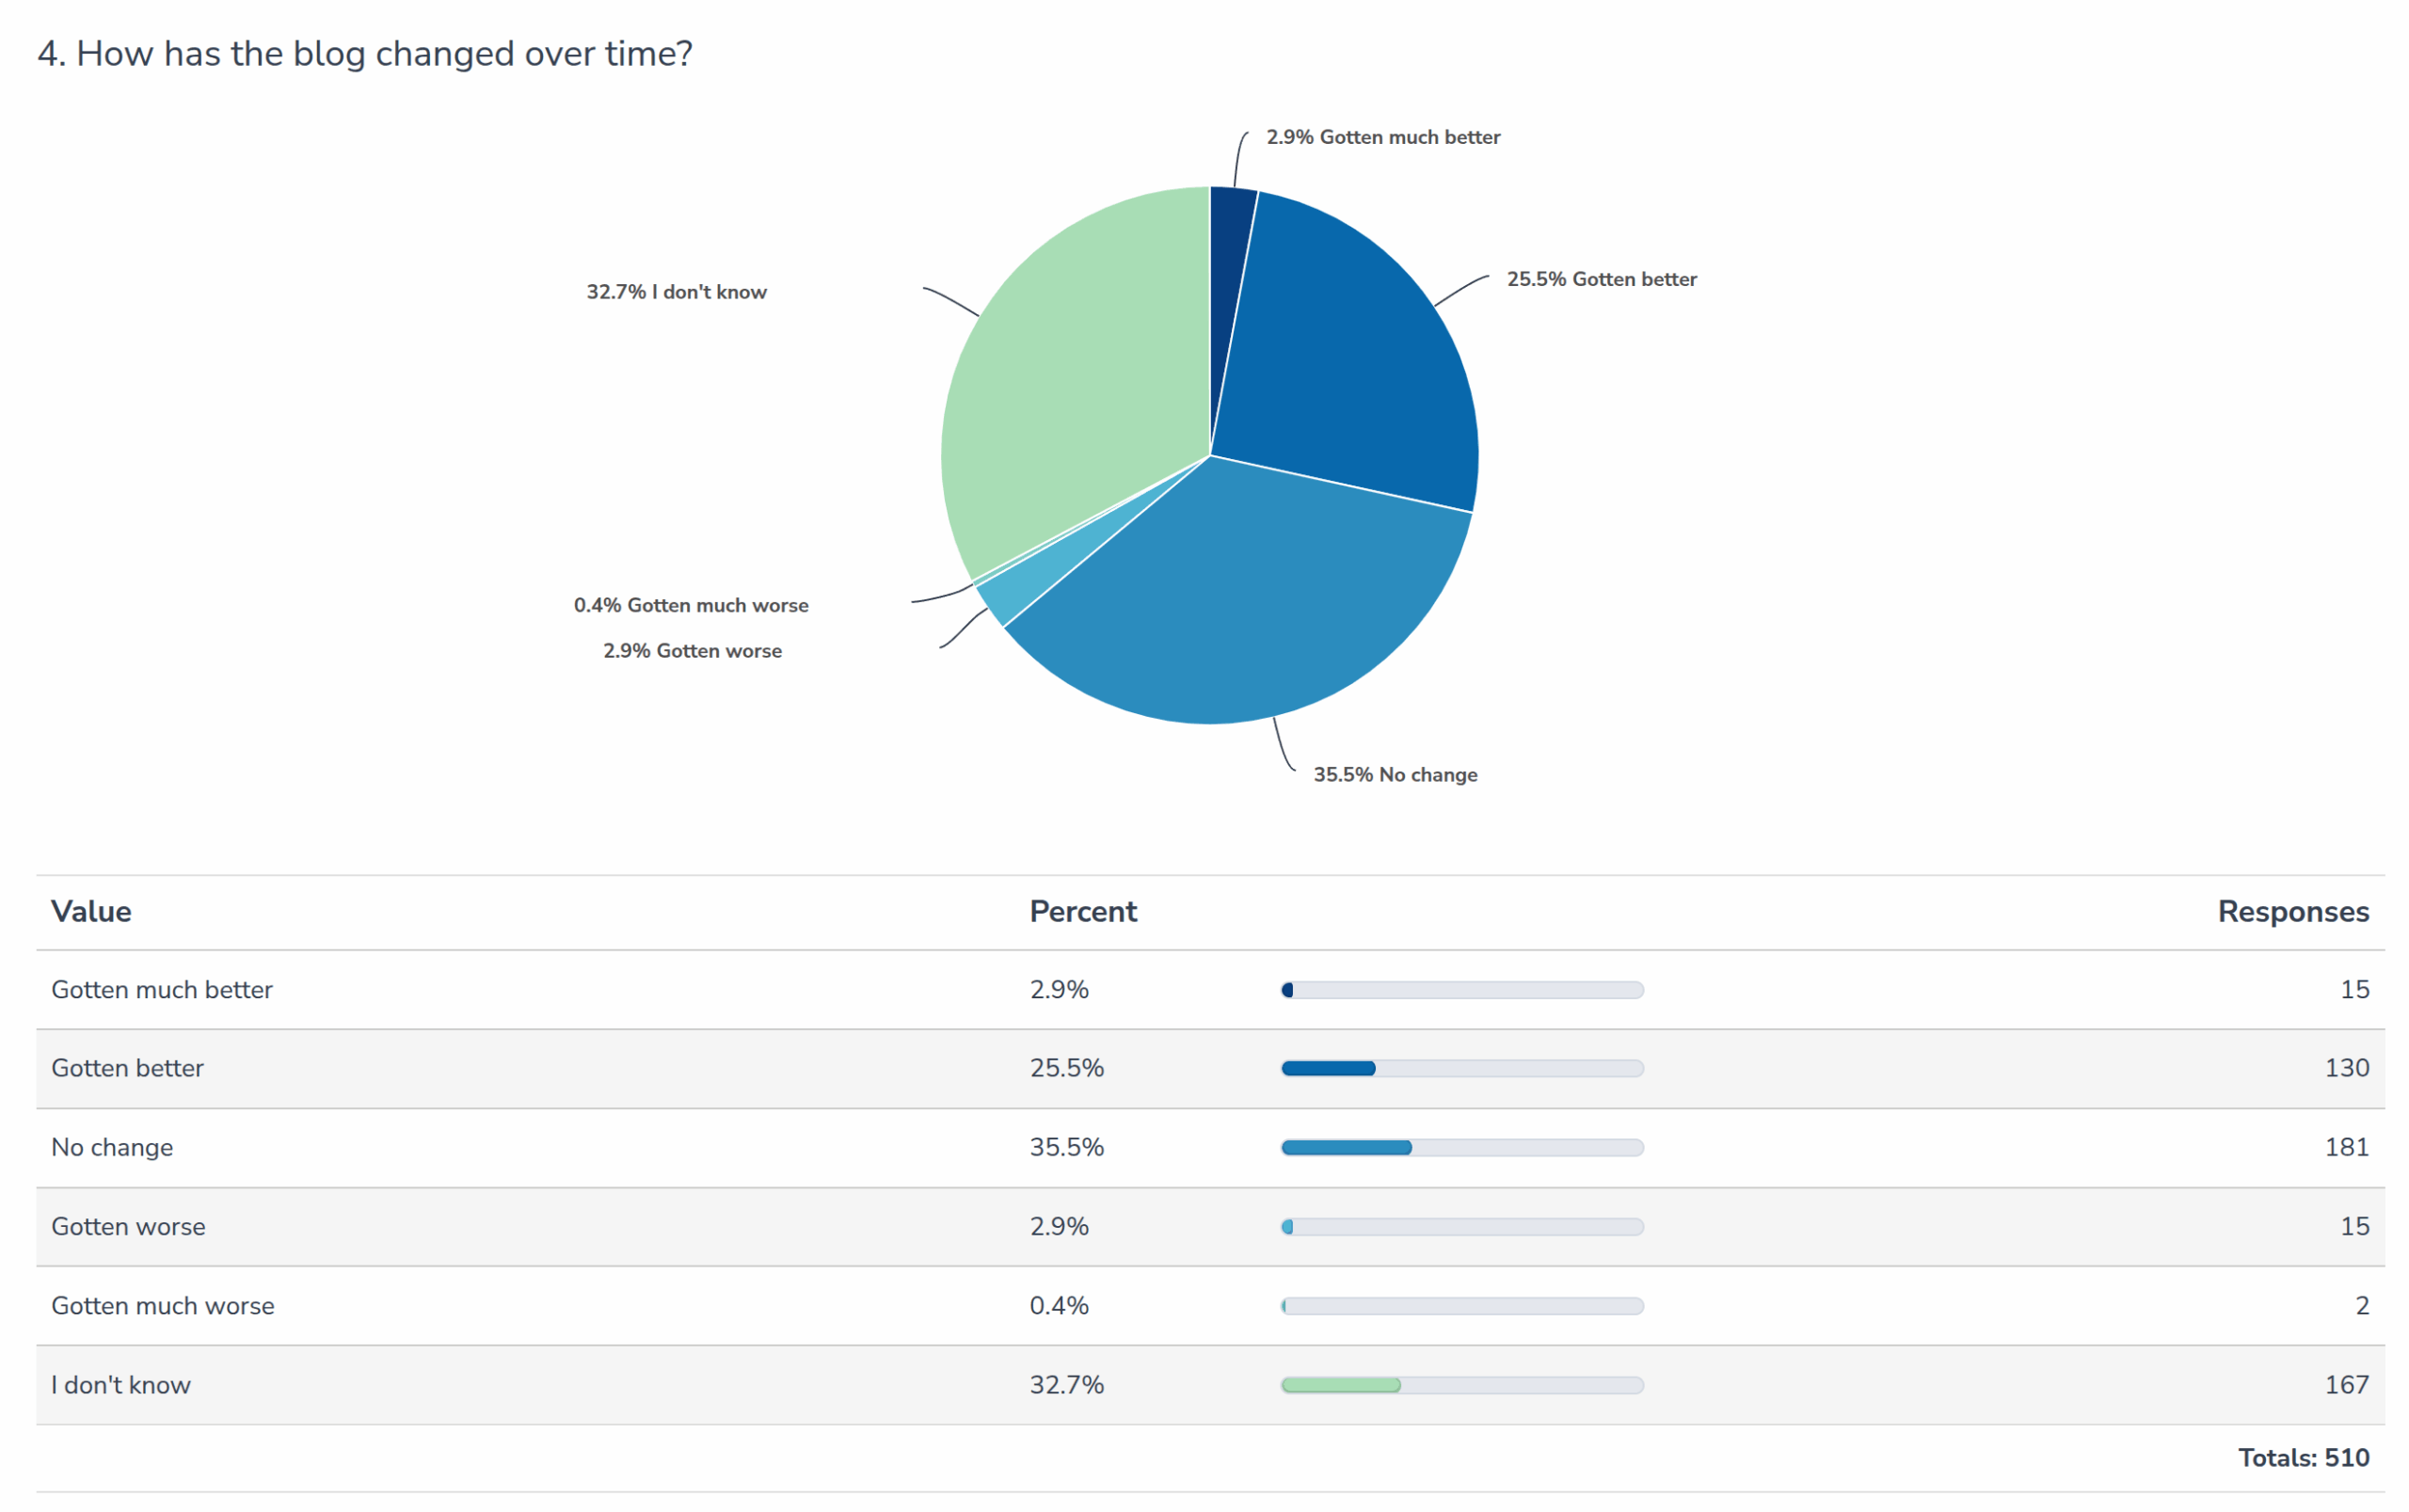
Phew, it seems not. 3.3% of subjects thought it got worse over time, while ~28% thought it got better.
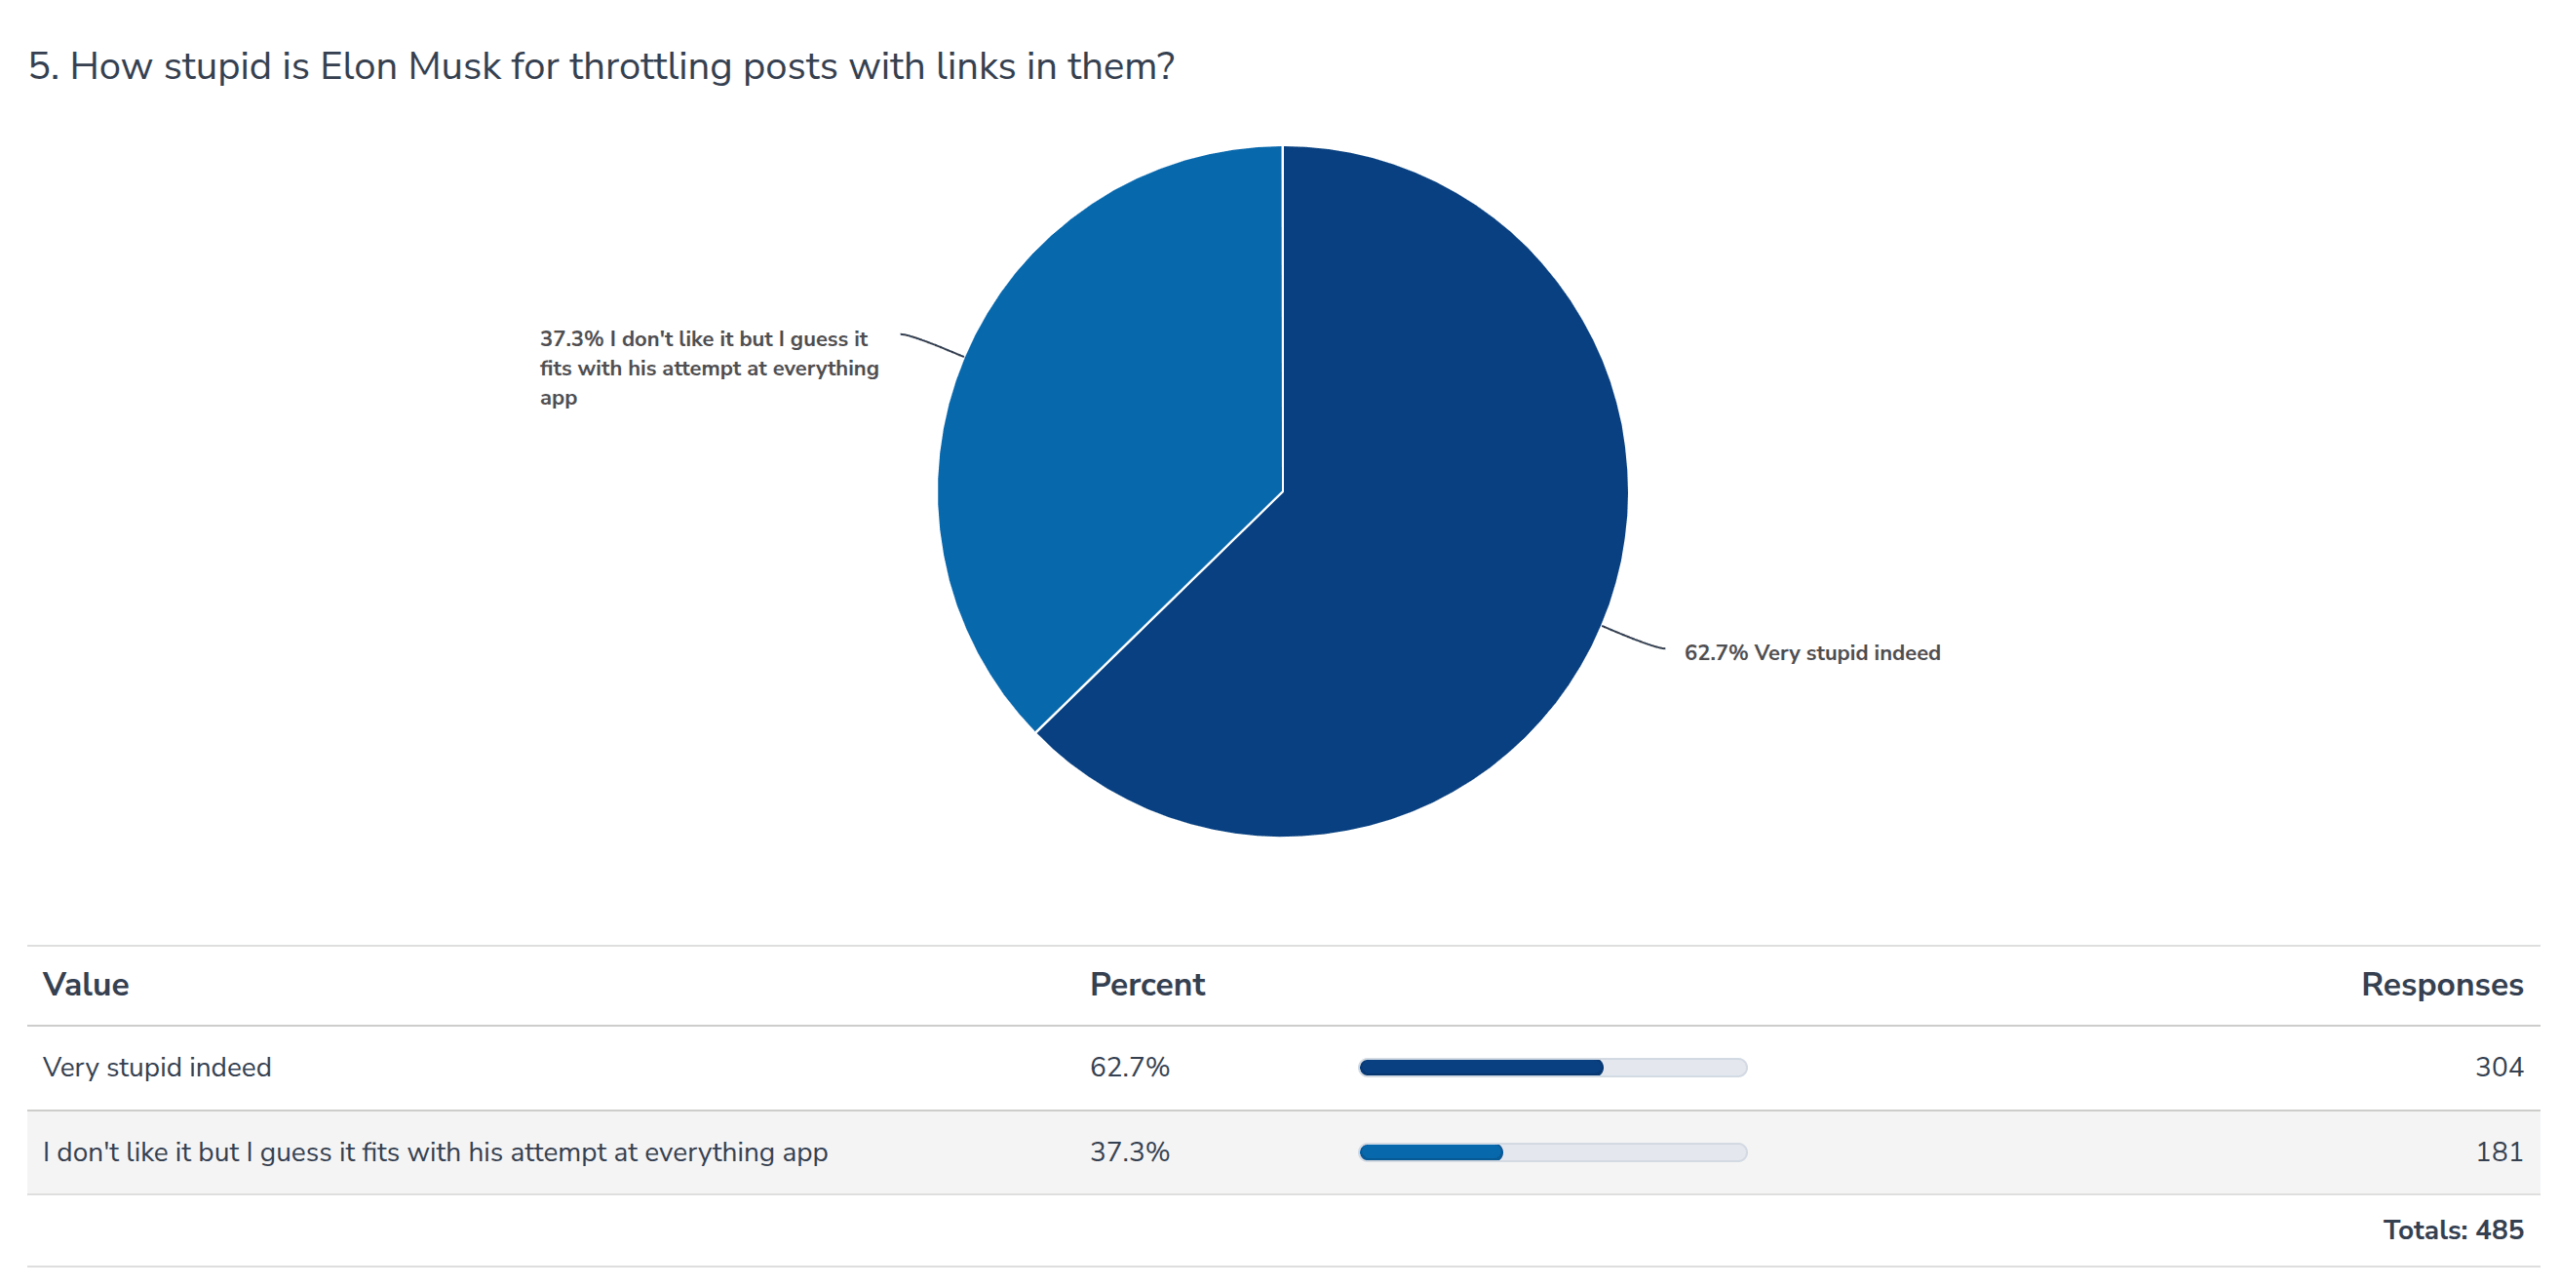
Moving on to important matters: Xitter is the global social media for intellectual discussion. So when the owner of this platform decides to penalize posts with outgoing links, this harms other platforms such as Substack. I think conversion rates from X to Substack have been worsening as a result, so I asked what you thought of this:
So what about politics? Well, the simple method is having people place themselves on the political compass:
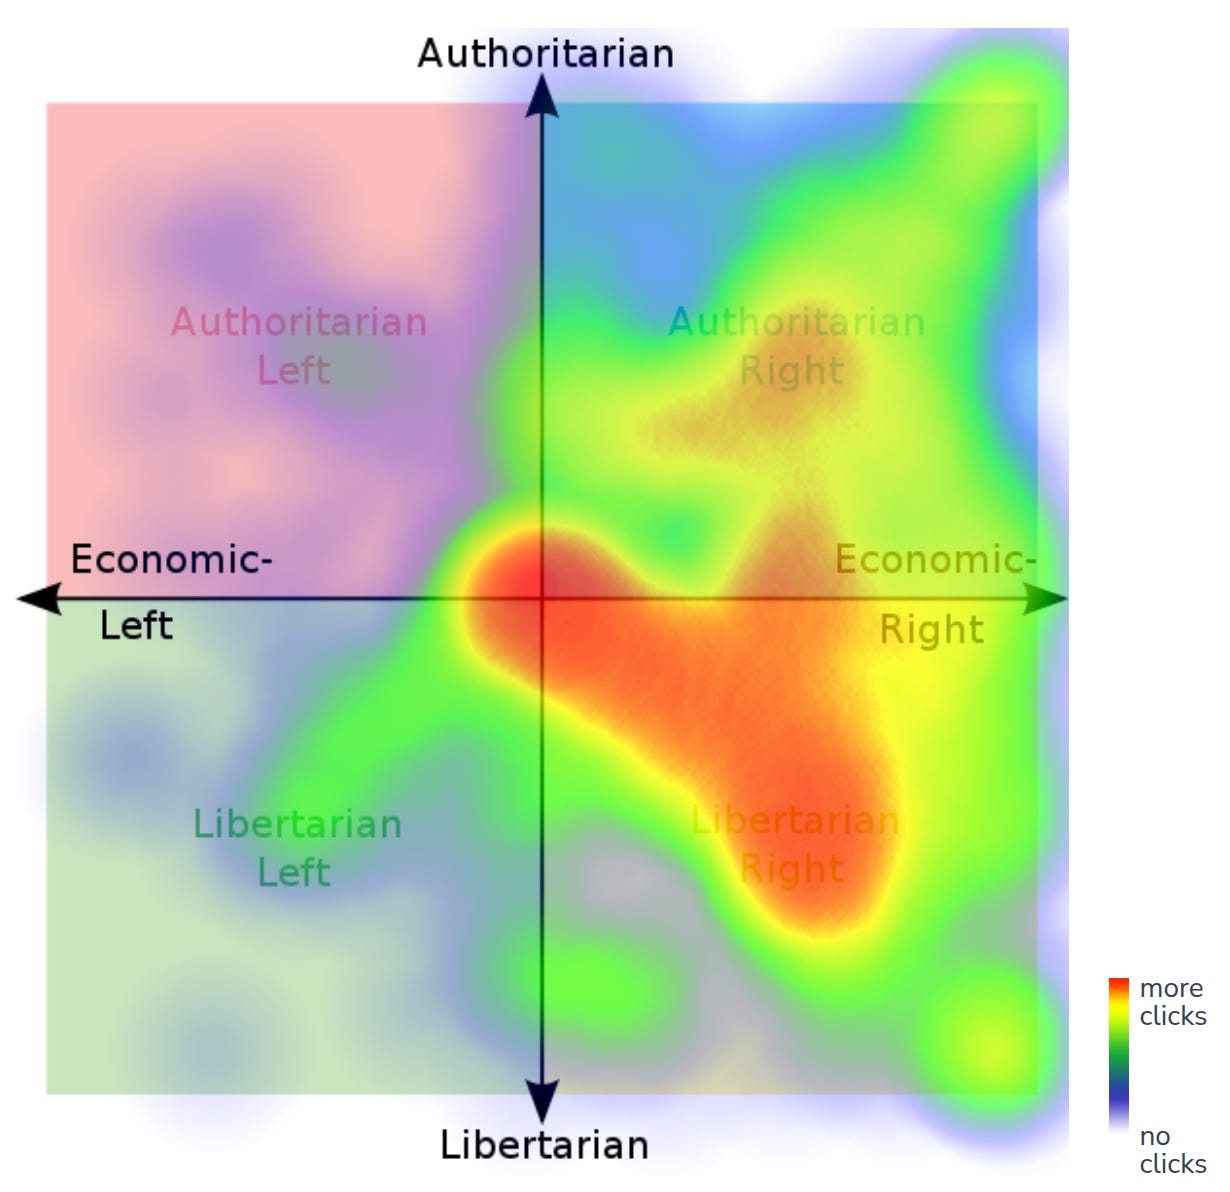
There is a decent spread of opinion but mostly leaning to the libertarian right. This is not surprisingly my own position. Social homophily also works alone.
Alternatively, we can look at labels. Many will object that their special snowflakeness cannot be captured by a mere 2-d matrix. And they are probably right to some extent, so here's some labels instead:
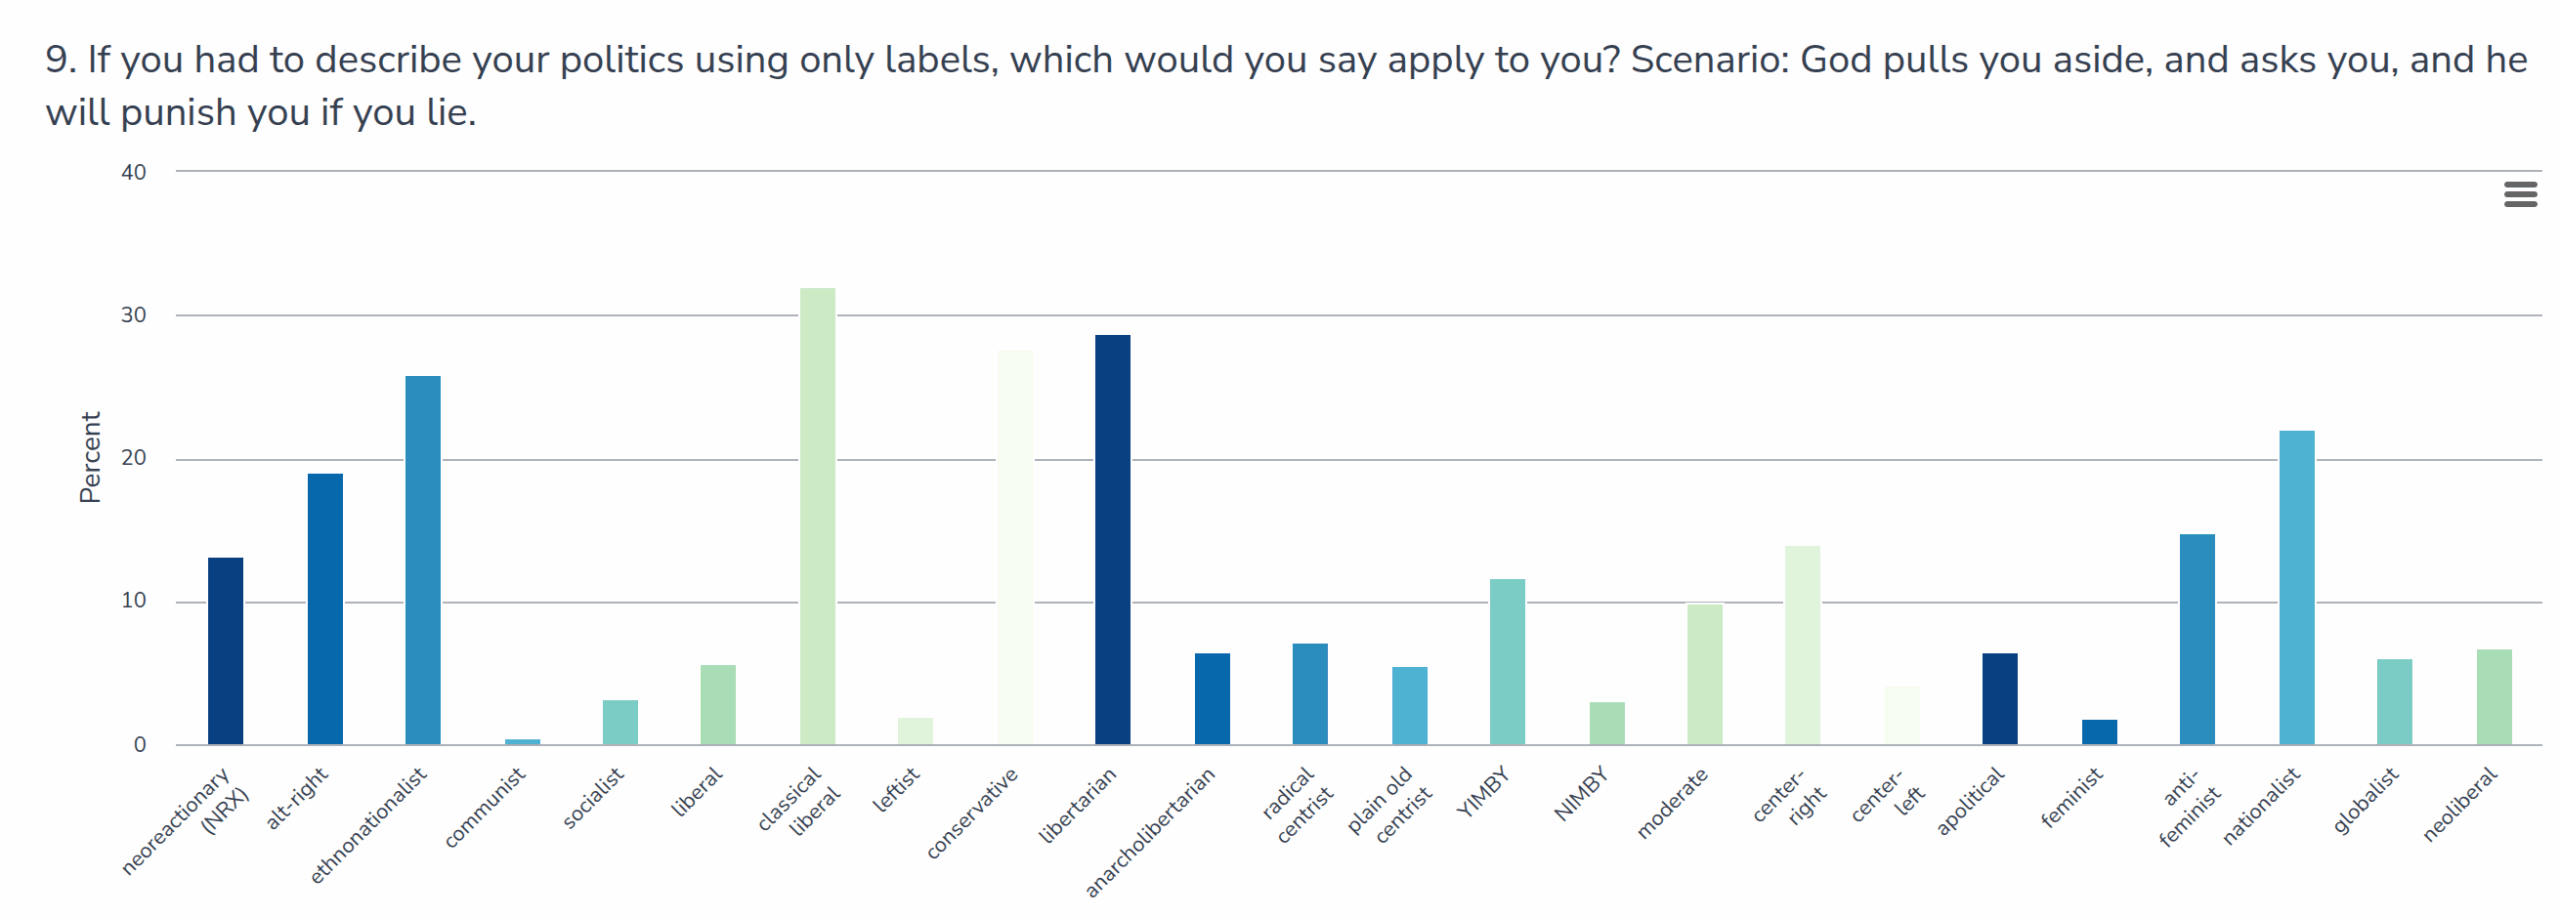
Looking just at the labels, we see that classical liberal and libertarian are in the lead, with ethno-nationalist and nationalist being the follow-ups. This year I included the often hated, but hard to find a representative of, neoliberal label. It seems 7% of you have decided to embrace this label, whatever it exactly means.
More interesting than the yes/no for each label is how they relate. 517 people chose at least one of these, which I will use as inclusion criterion (to avoid missing data subjects who selected nothing and thus will form a fake-cluster). Correlations among binary variables can be done using the ordinary method (Pearson) but this results in much lower values due to bias. For this reason, a special method is used that estimates what the correlation would have been because the two variables if they had been measured using normally distributed measures instead (tetrachoric, an anachronism because this is an old obscure mathematical method):
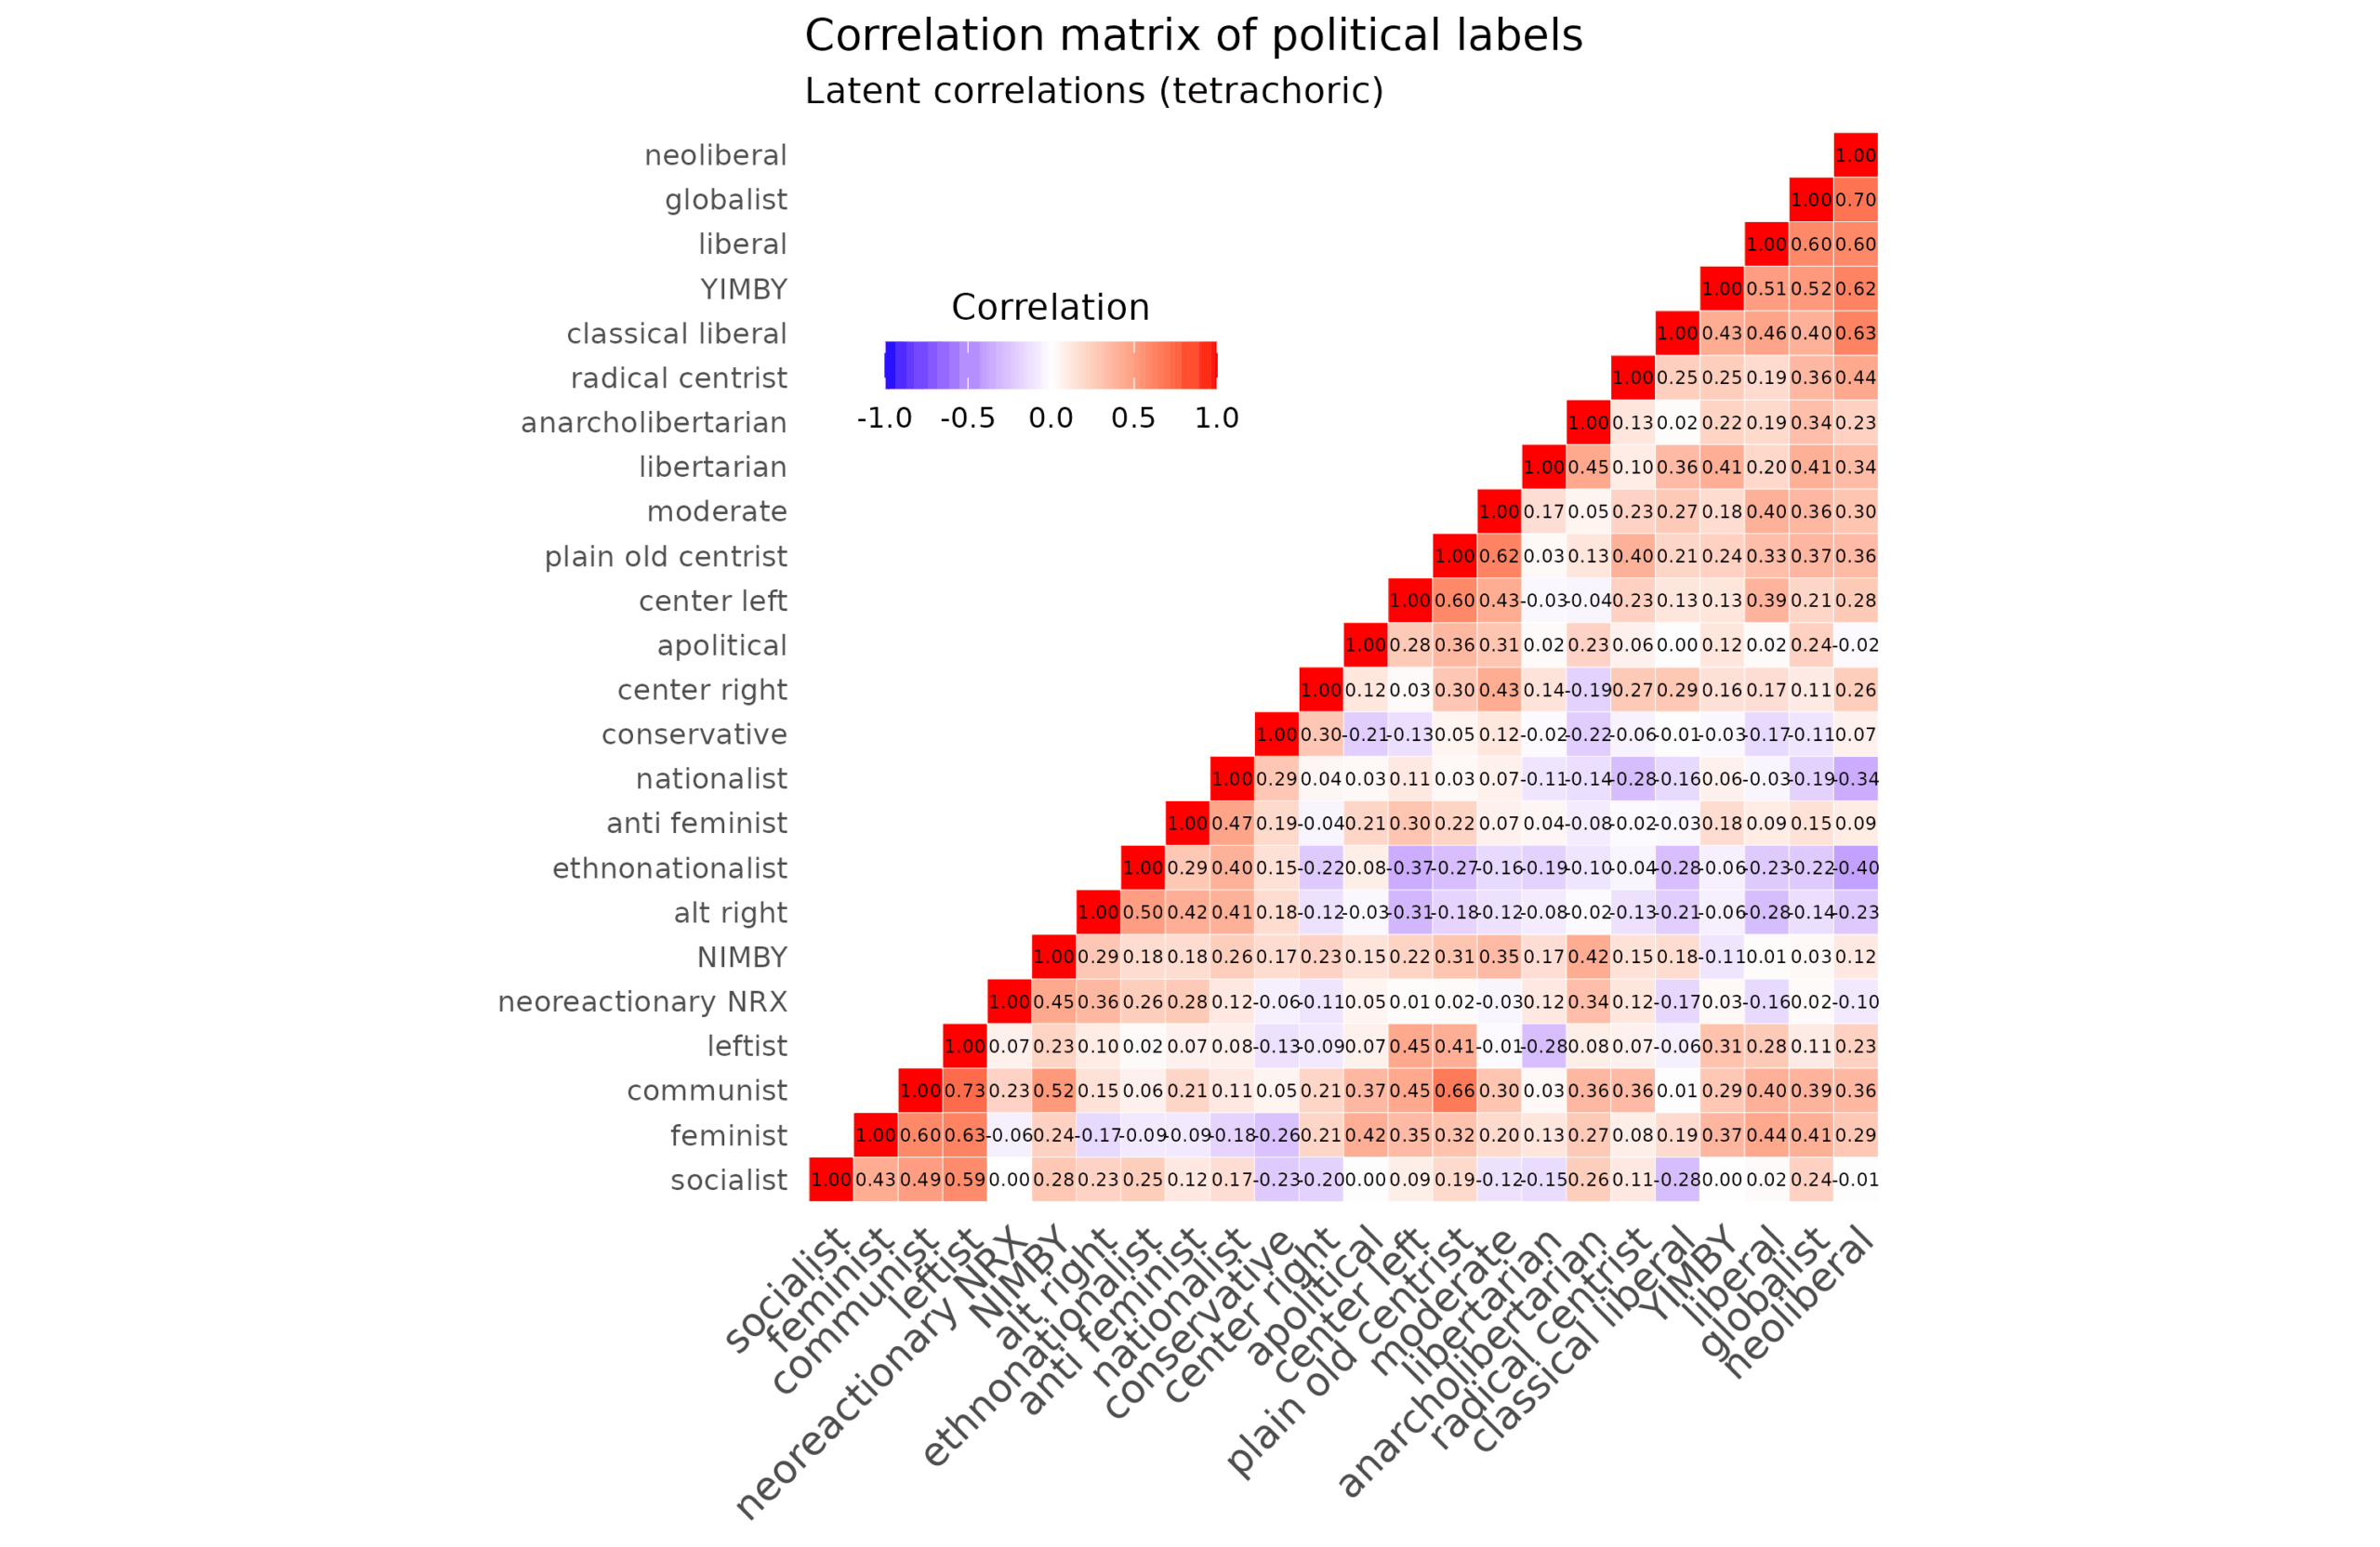
There are a lot of correlations as expected. To make sense of these, we can factor analyze the correlation matrix:
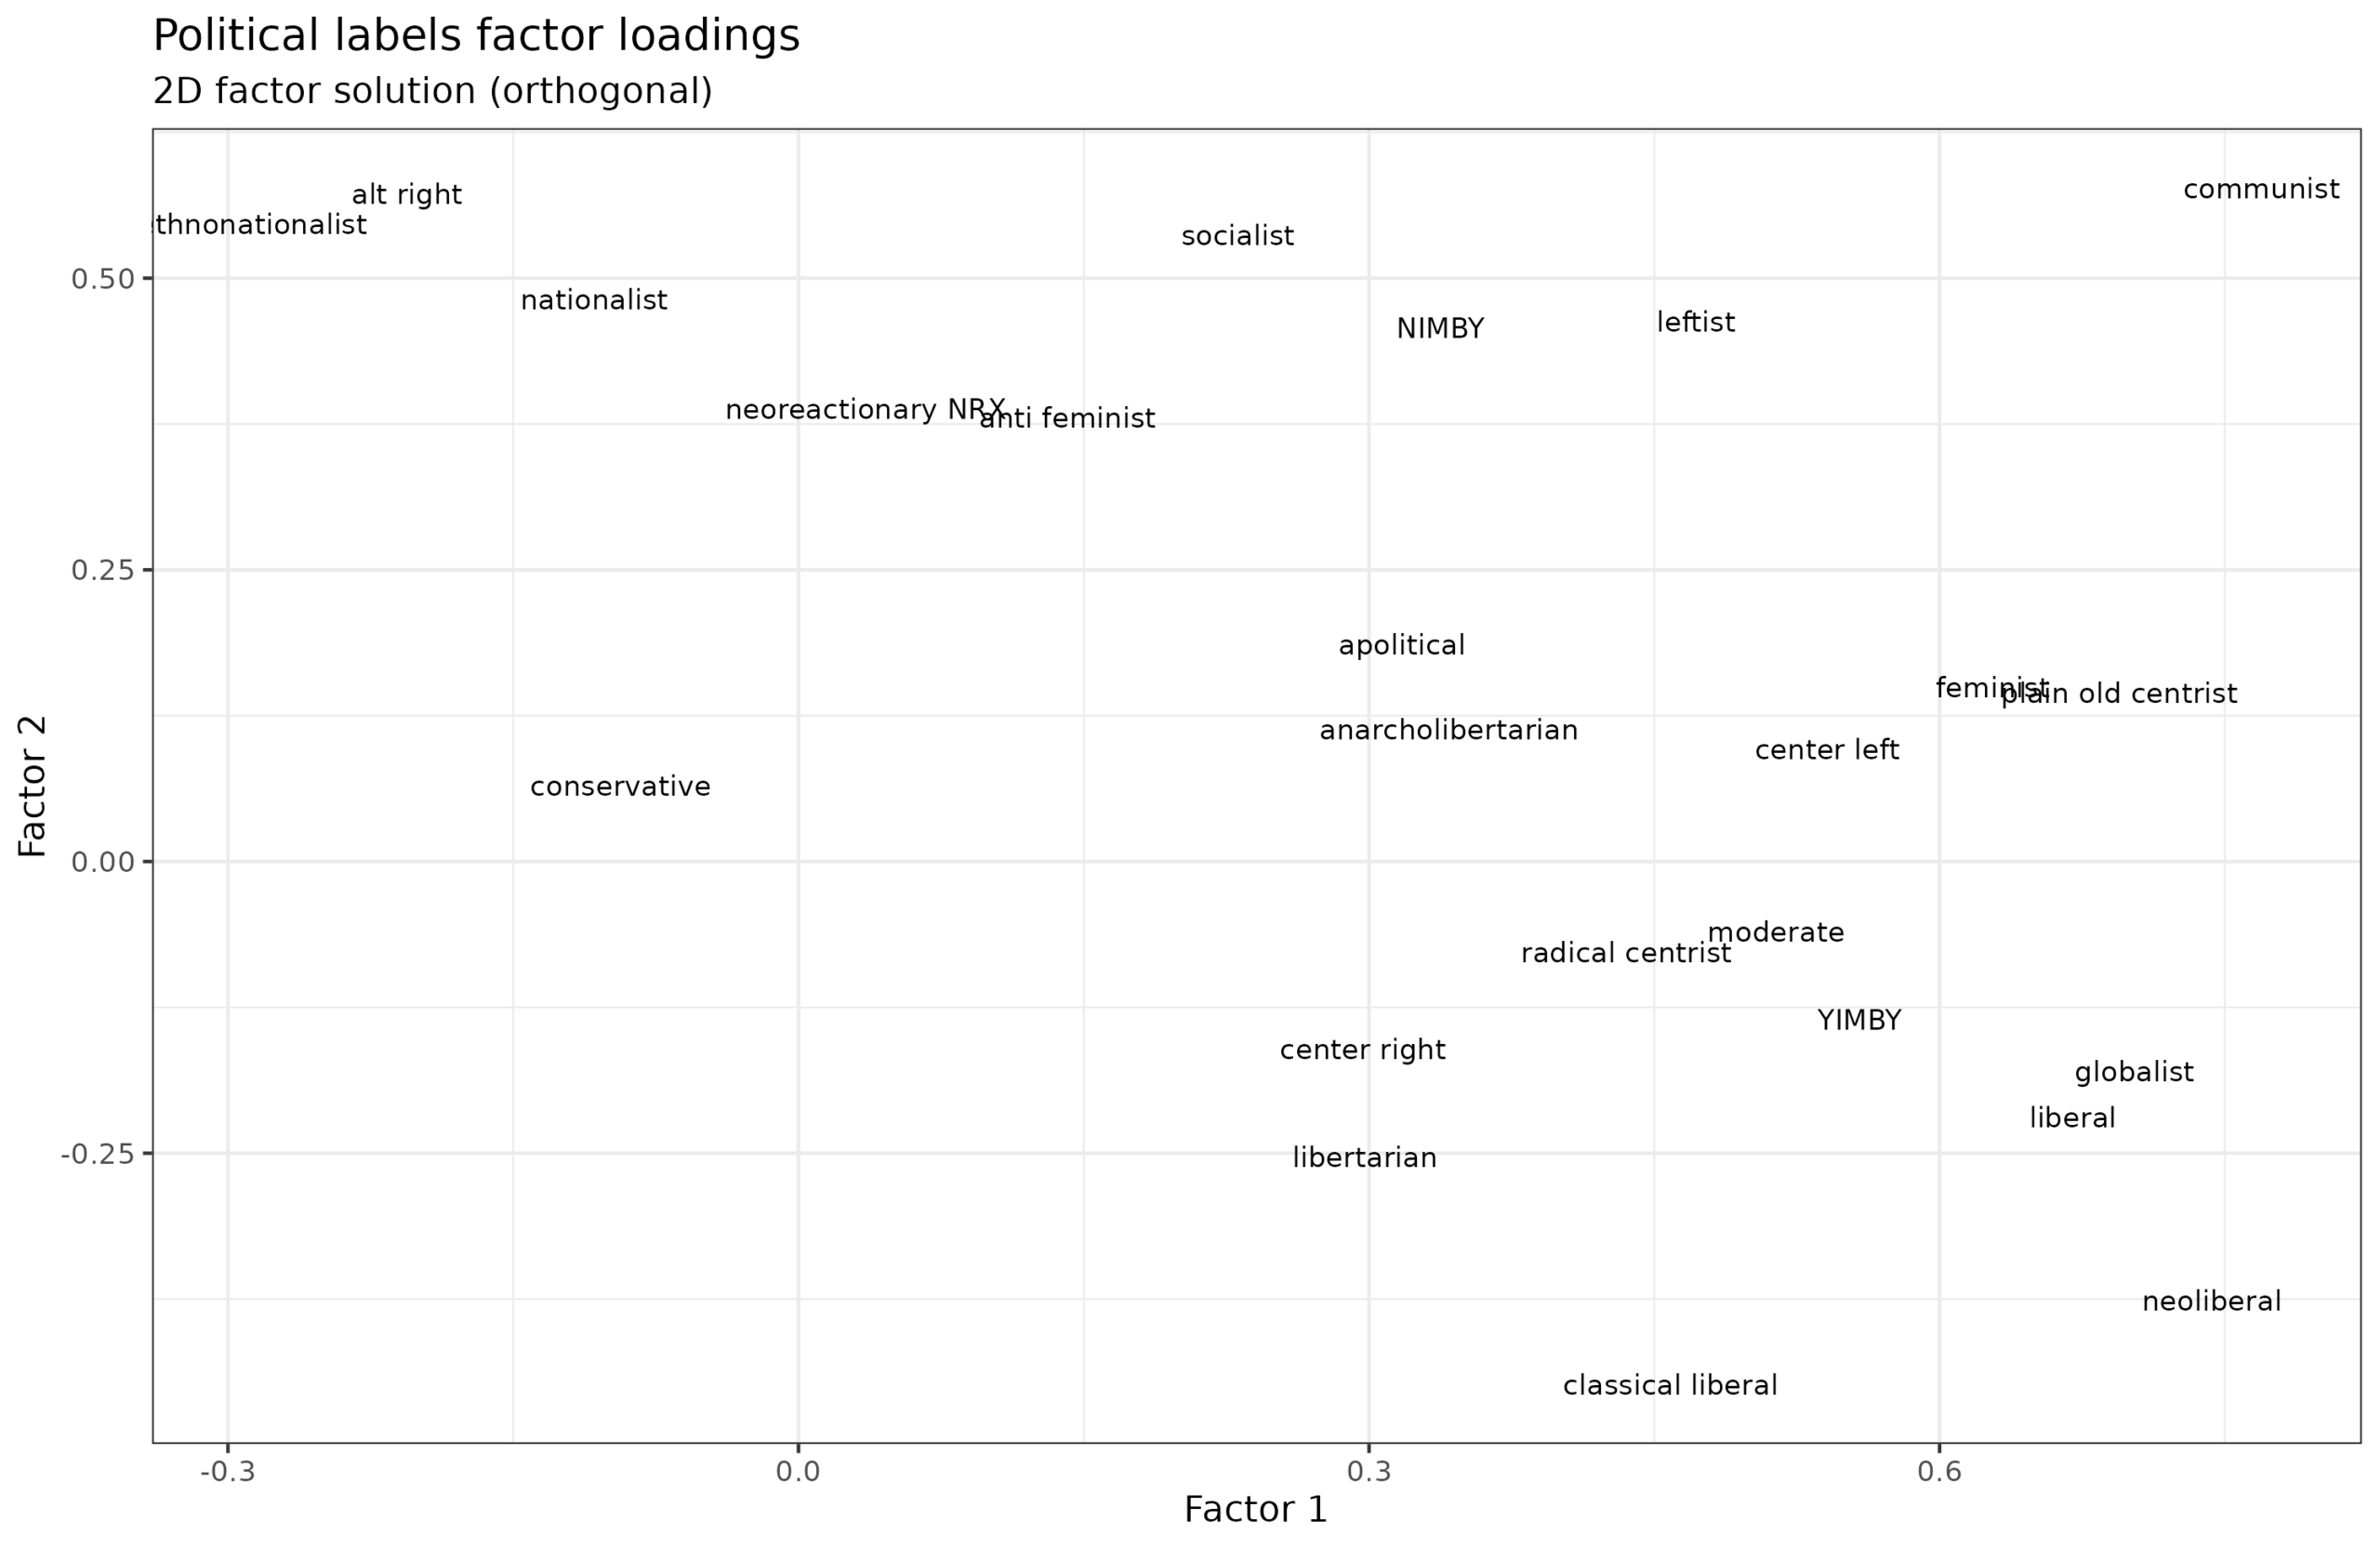
Theoretically, this figure shows us the relative placements of the political labels. Judging from center-right, moderate, center-left, and communist, it looks like top-right corner is leftism, top-left corner is nationalism, bottom-right are the globalists/anywheres. These estimates aren't terribly precise due to the relatively small overlap between rare labels.
Aside from labelling themselves, subjects also ranked a number of entities or people. I tried to keep this manageable while also inclusive. It may have failed at both, but in any case, it looks like this:
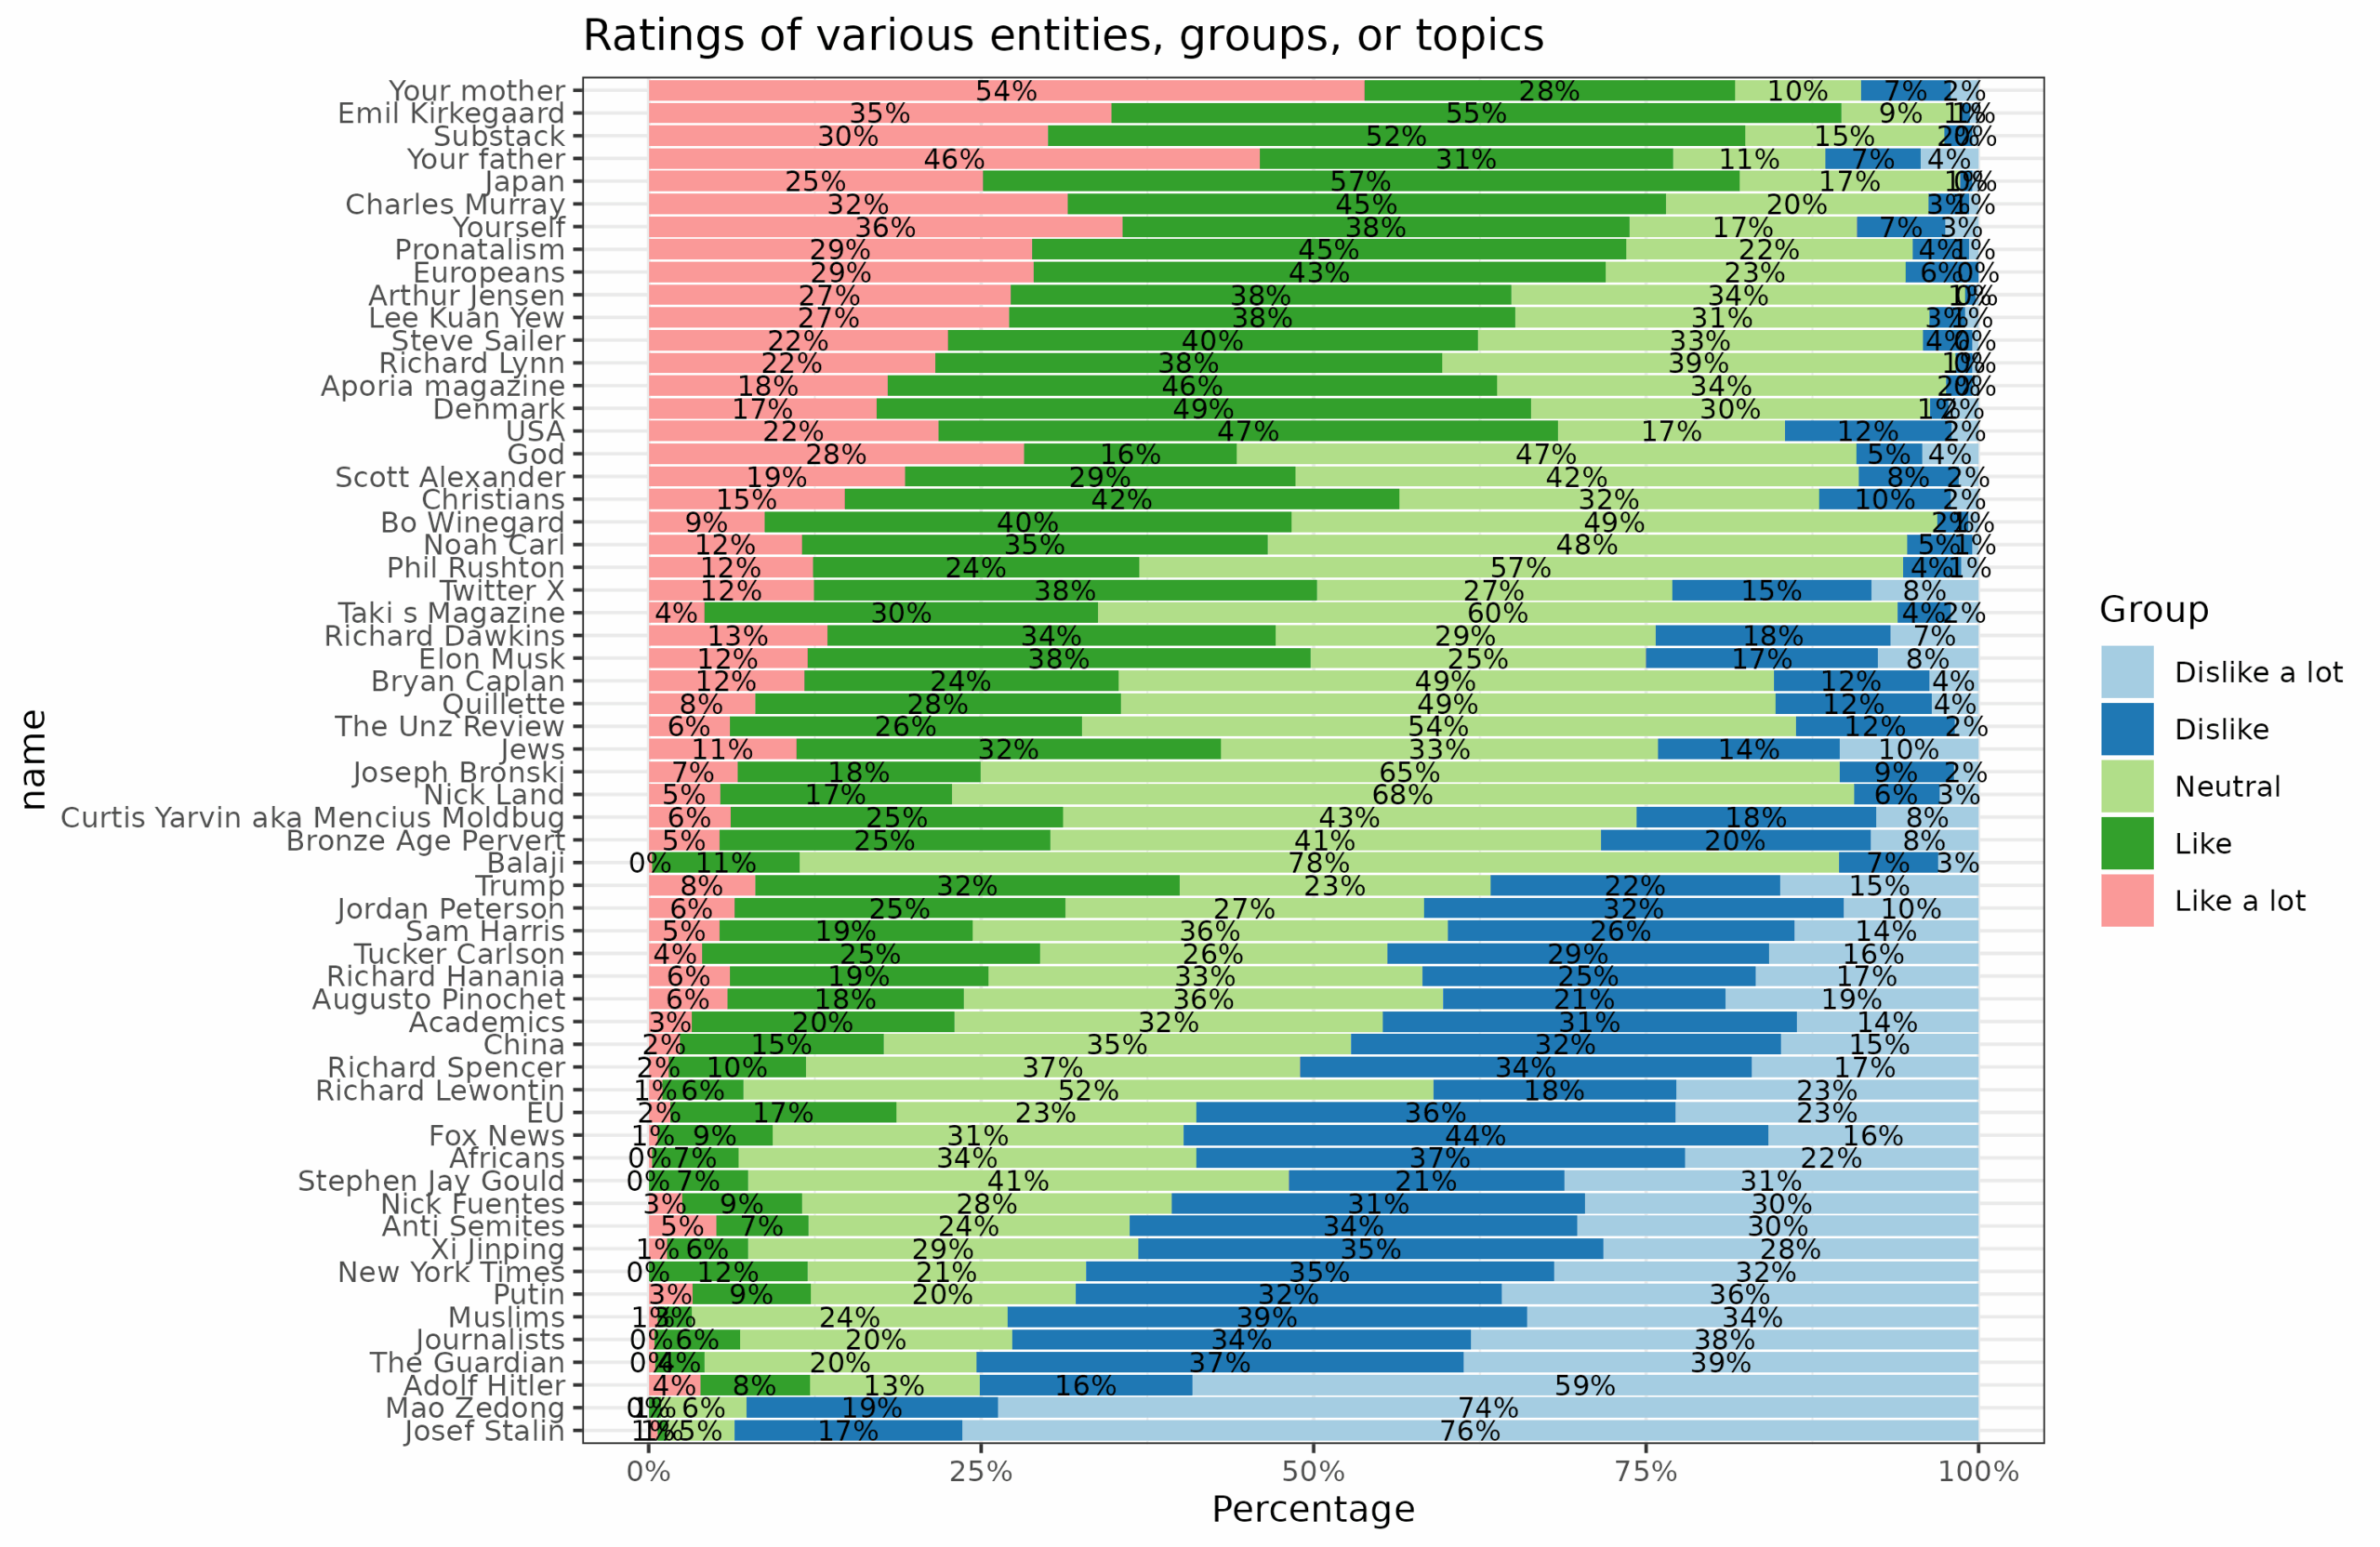
I am happy to report that this year people like their mother more than they like me. The dictators are still in the bottom, along with other trouble makers (journalists, Muslims, left-wing media). Readers are clearly not typical American Republican types since Fox News is also rated quite low. Elon Musk has a fairly decent middle position. His popularity varies widely by country:
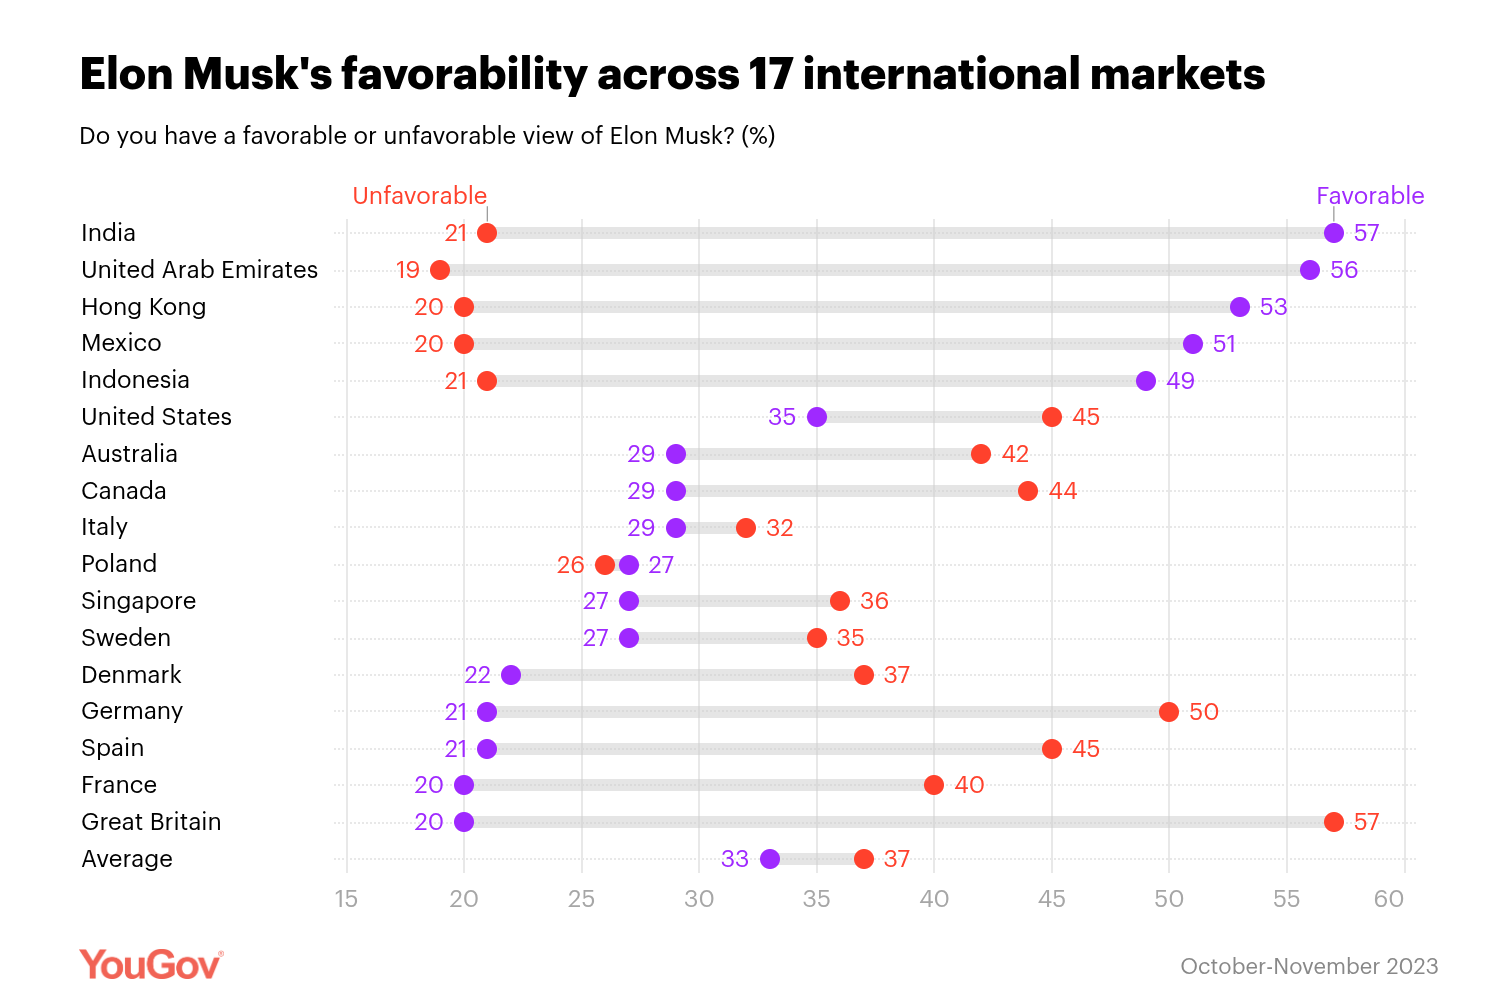
Unfortunately for him, perhaps, he is most popular in the third world, and unpopular in the West, except for Poland and Italy.
Like the political labels, we can factor analyze the ratings into 2 orthogonal dimensions to see 'what goes together' in that space:
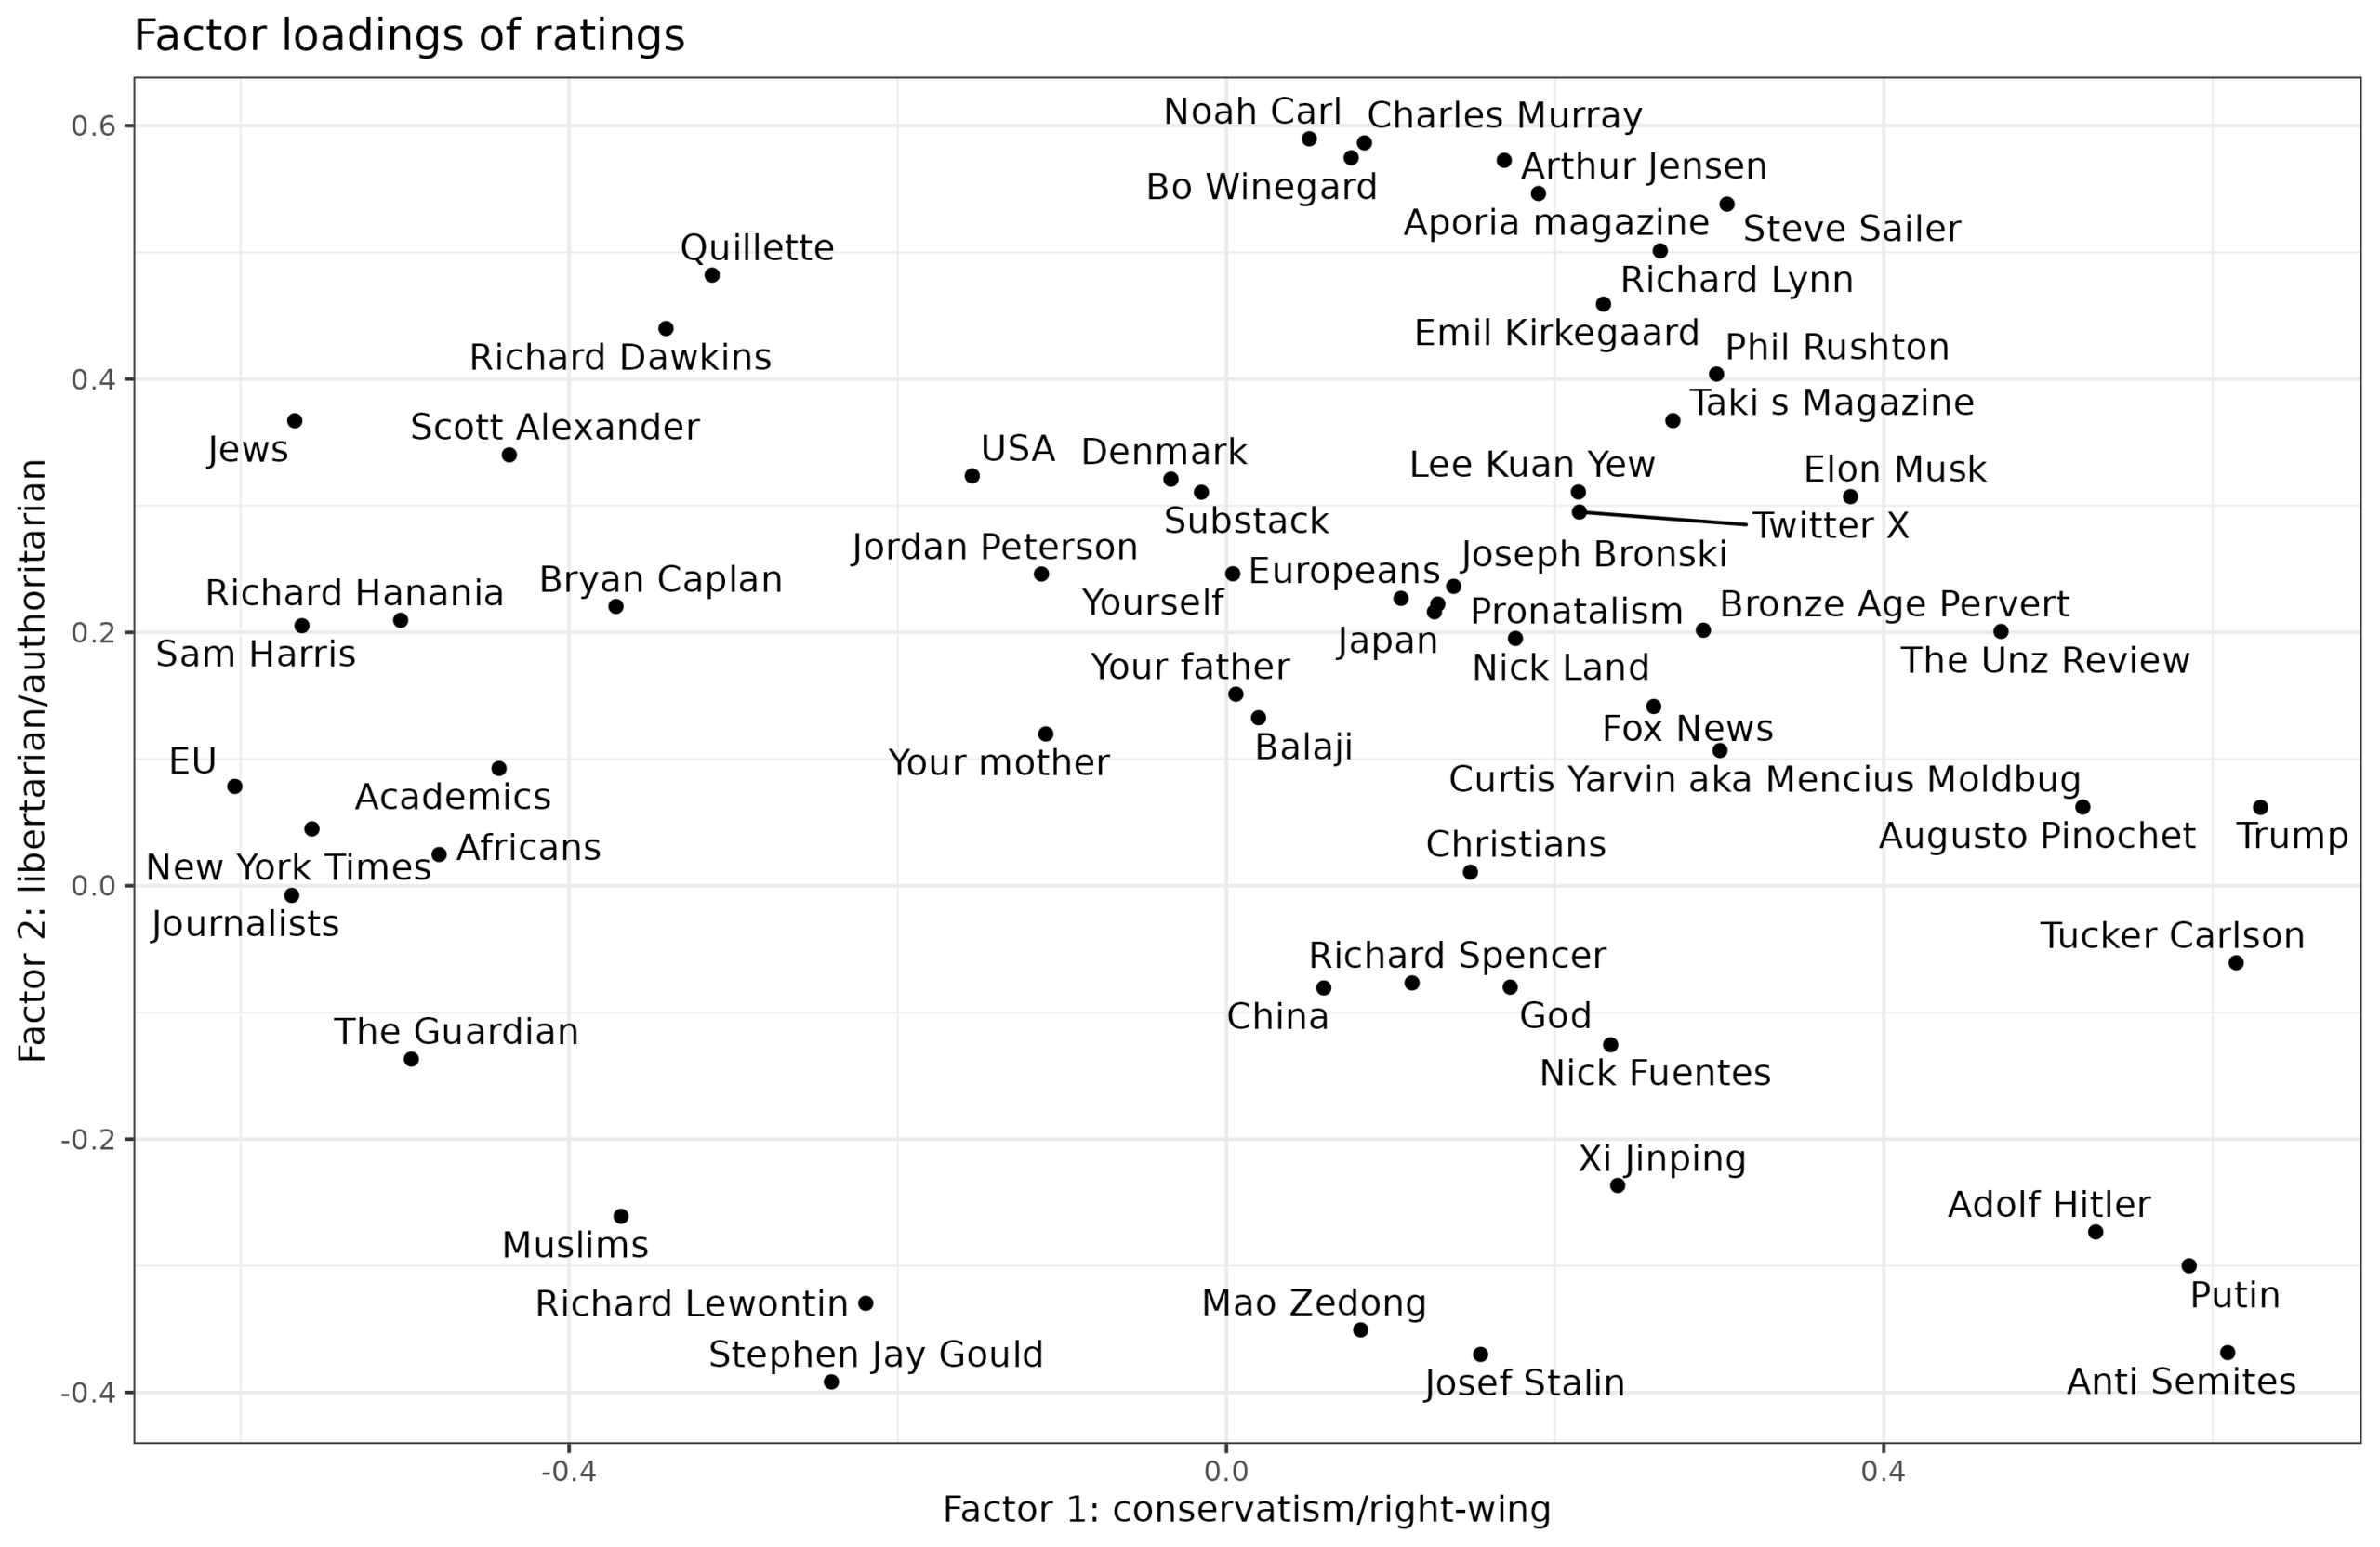
The axis labels are made by me and are only suggestive. Clearly, the right-wing people are in the right side. On the other hand, the left side has a big mix of people. Some of these are obviously left-wing (academics, journalists, media), but there's also open borders types (Hanania, Caplan, S. Harris), and groups the left likes or who like the left (Jews, Africans, Muslims). More interesting next year would be to ask for big Twitter accounts, so that we can finally get a real map of who goes with whom. Some of the above are on Twitter, but many are also not, and it excludes many large accounts.
Finally, there were also some regular statements to agree with or not:
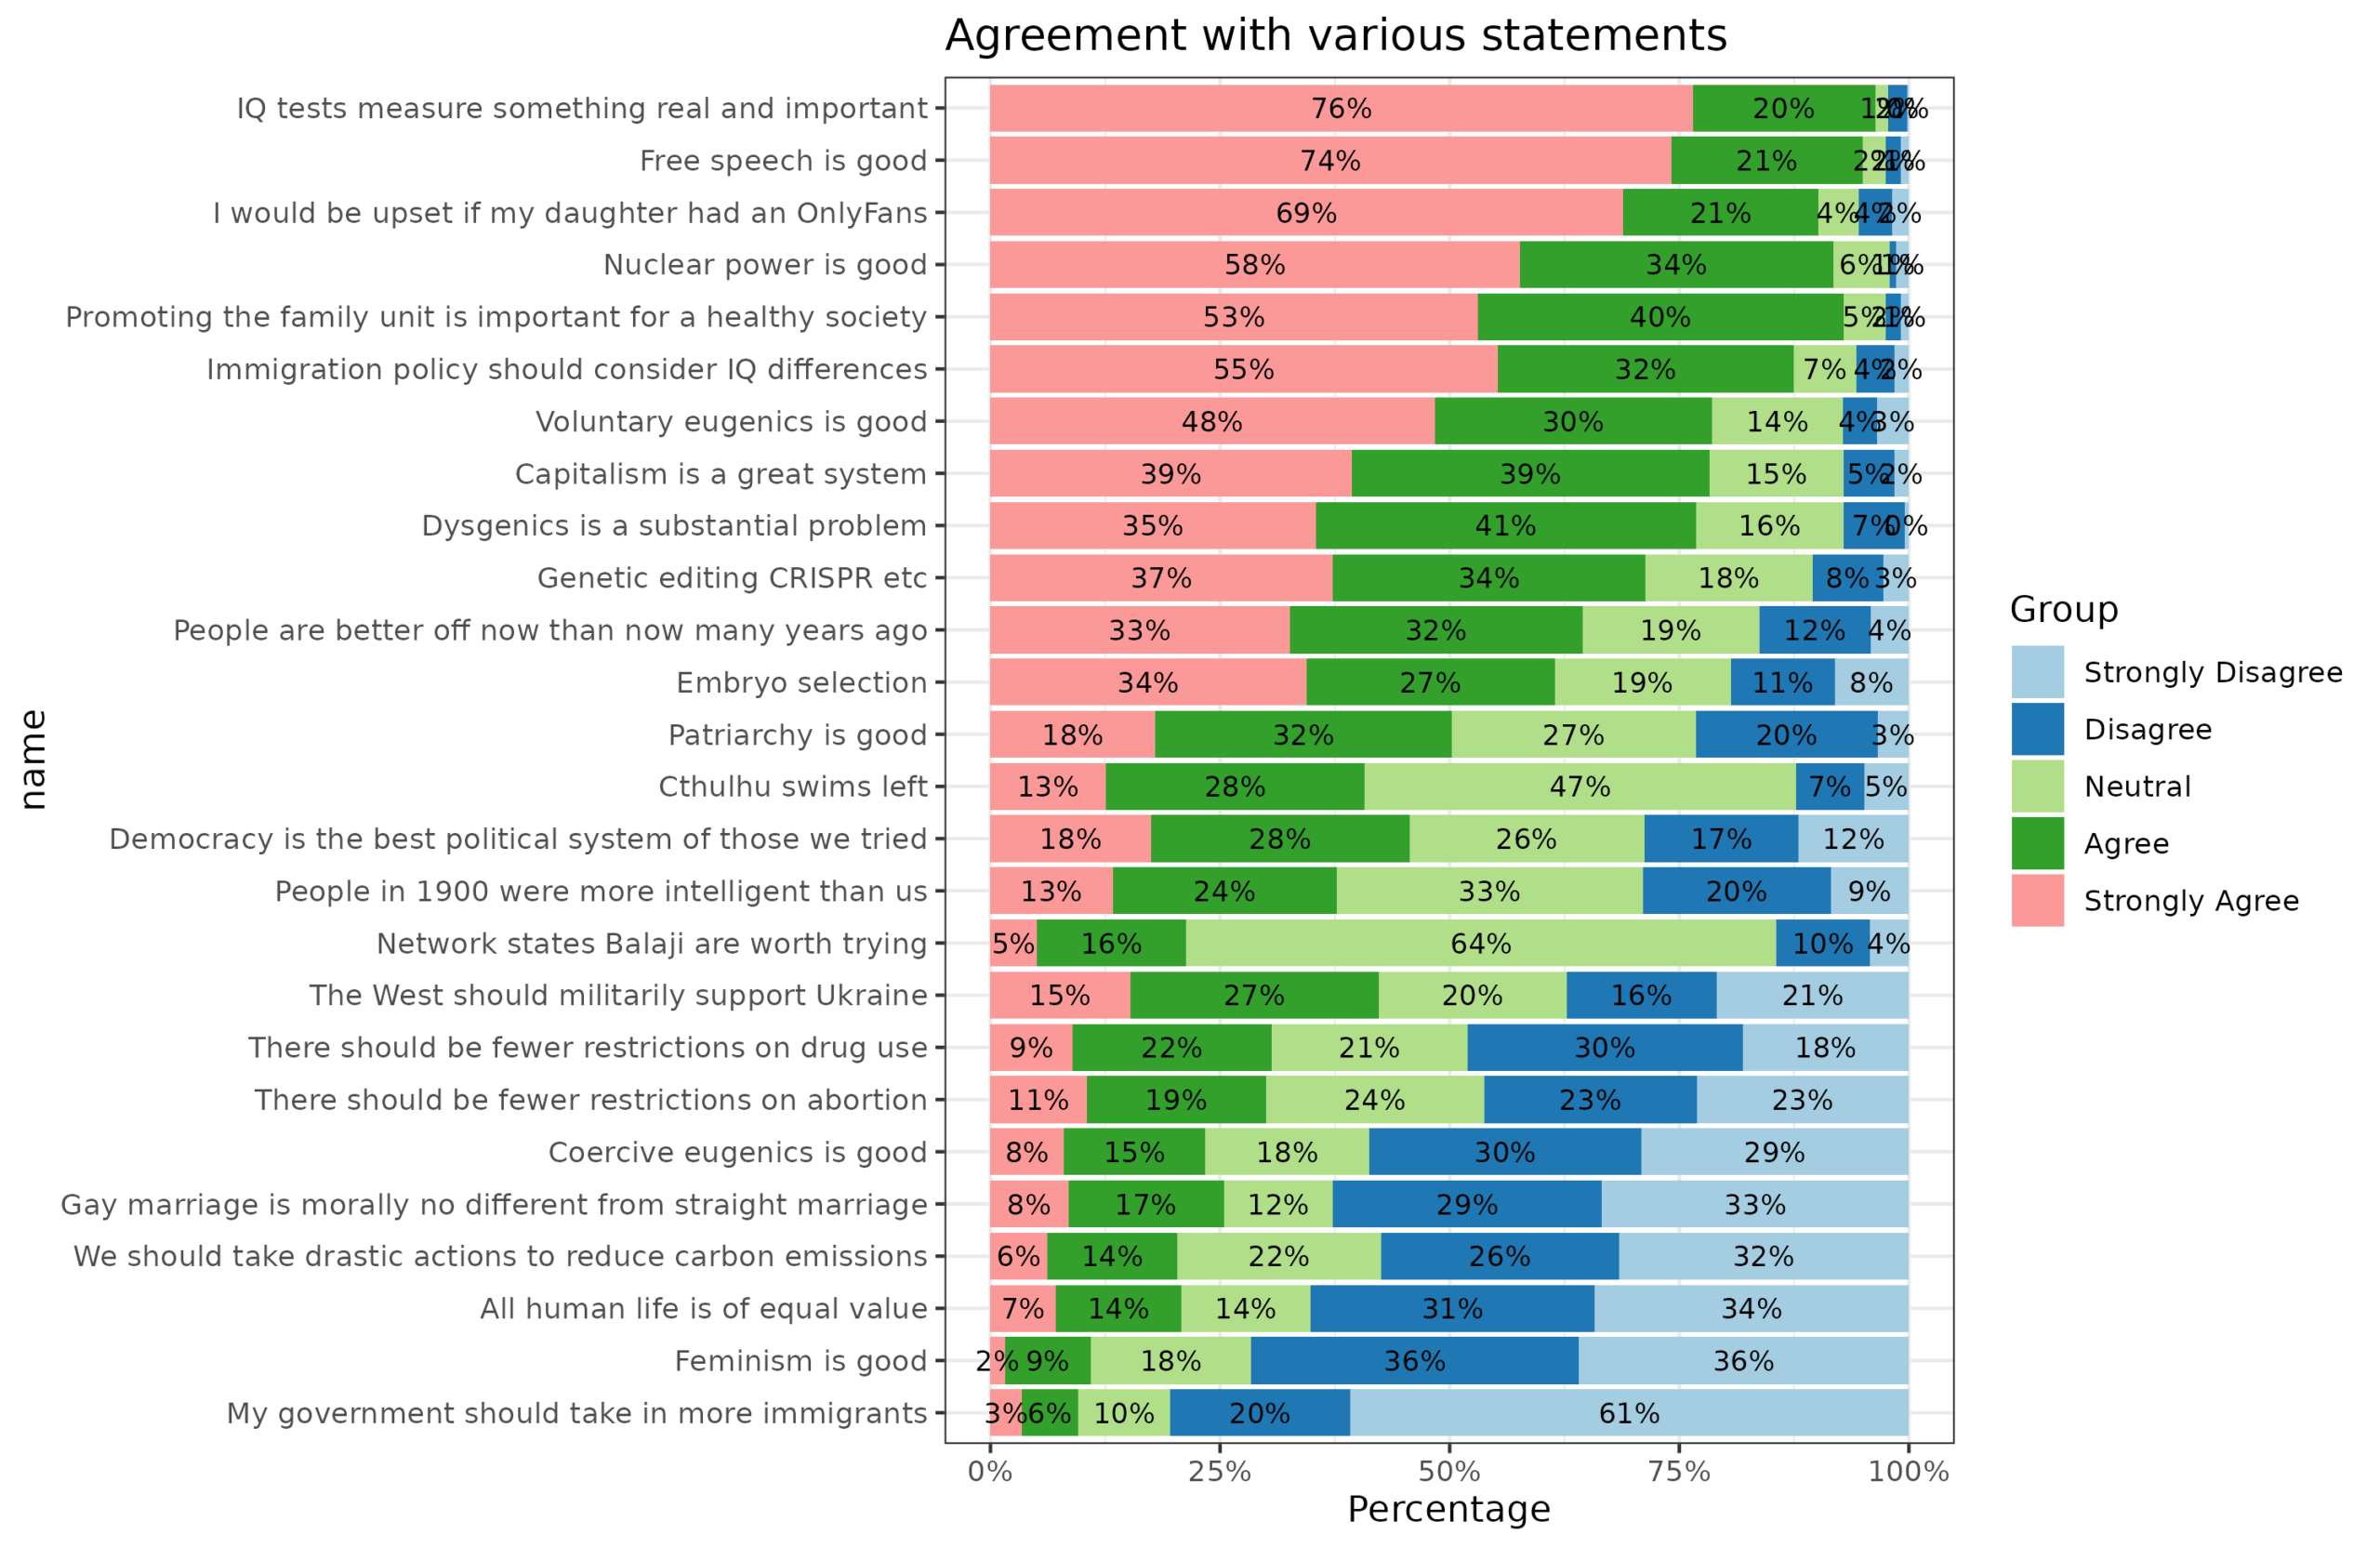
Overall, the views are pretty close to my own with some exceptions (I am more pro trying out network states somewhere, and embryo selection). And again, we can make a 2-d figure of which statements go together:
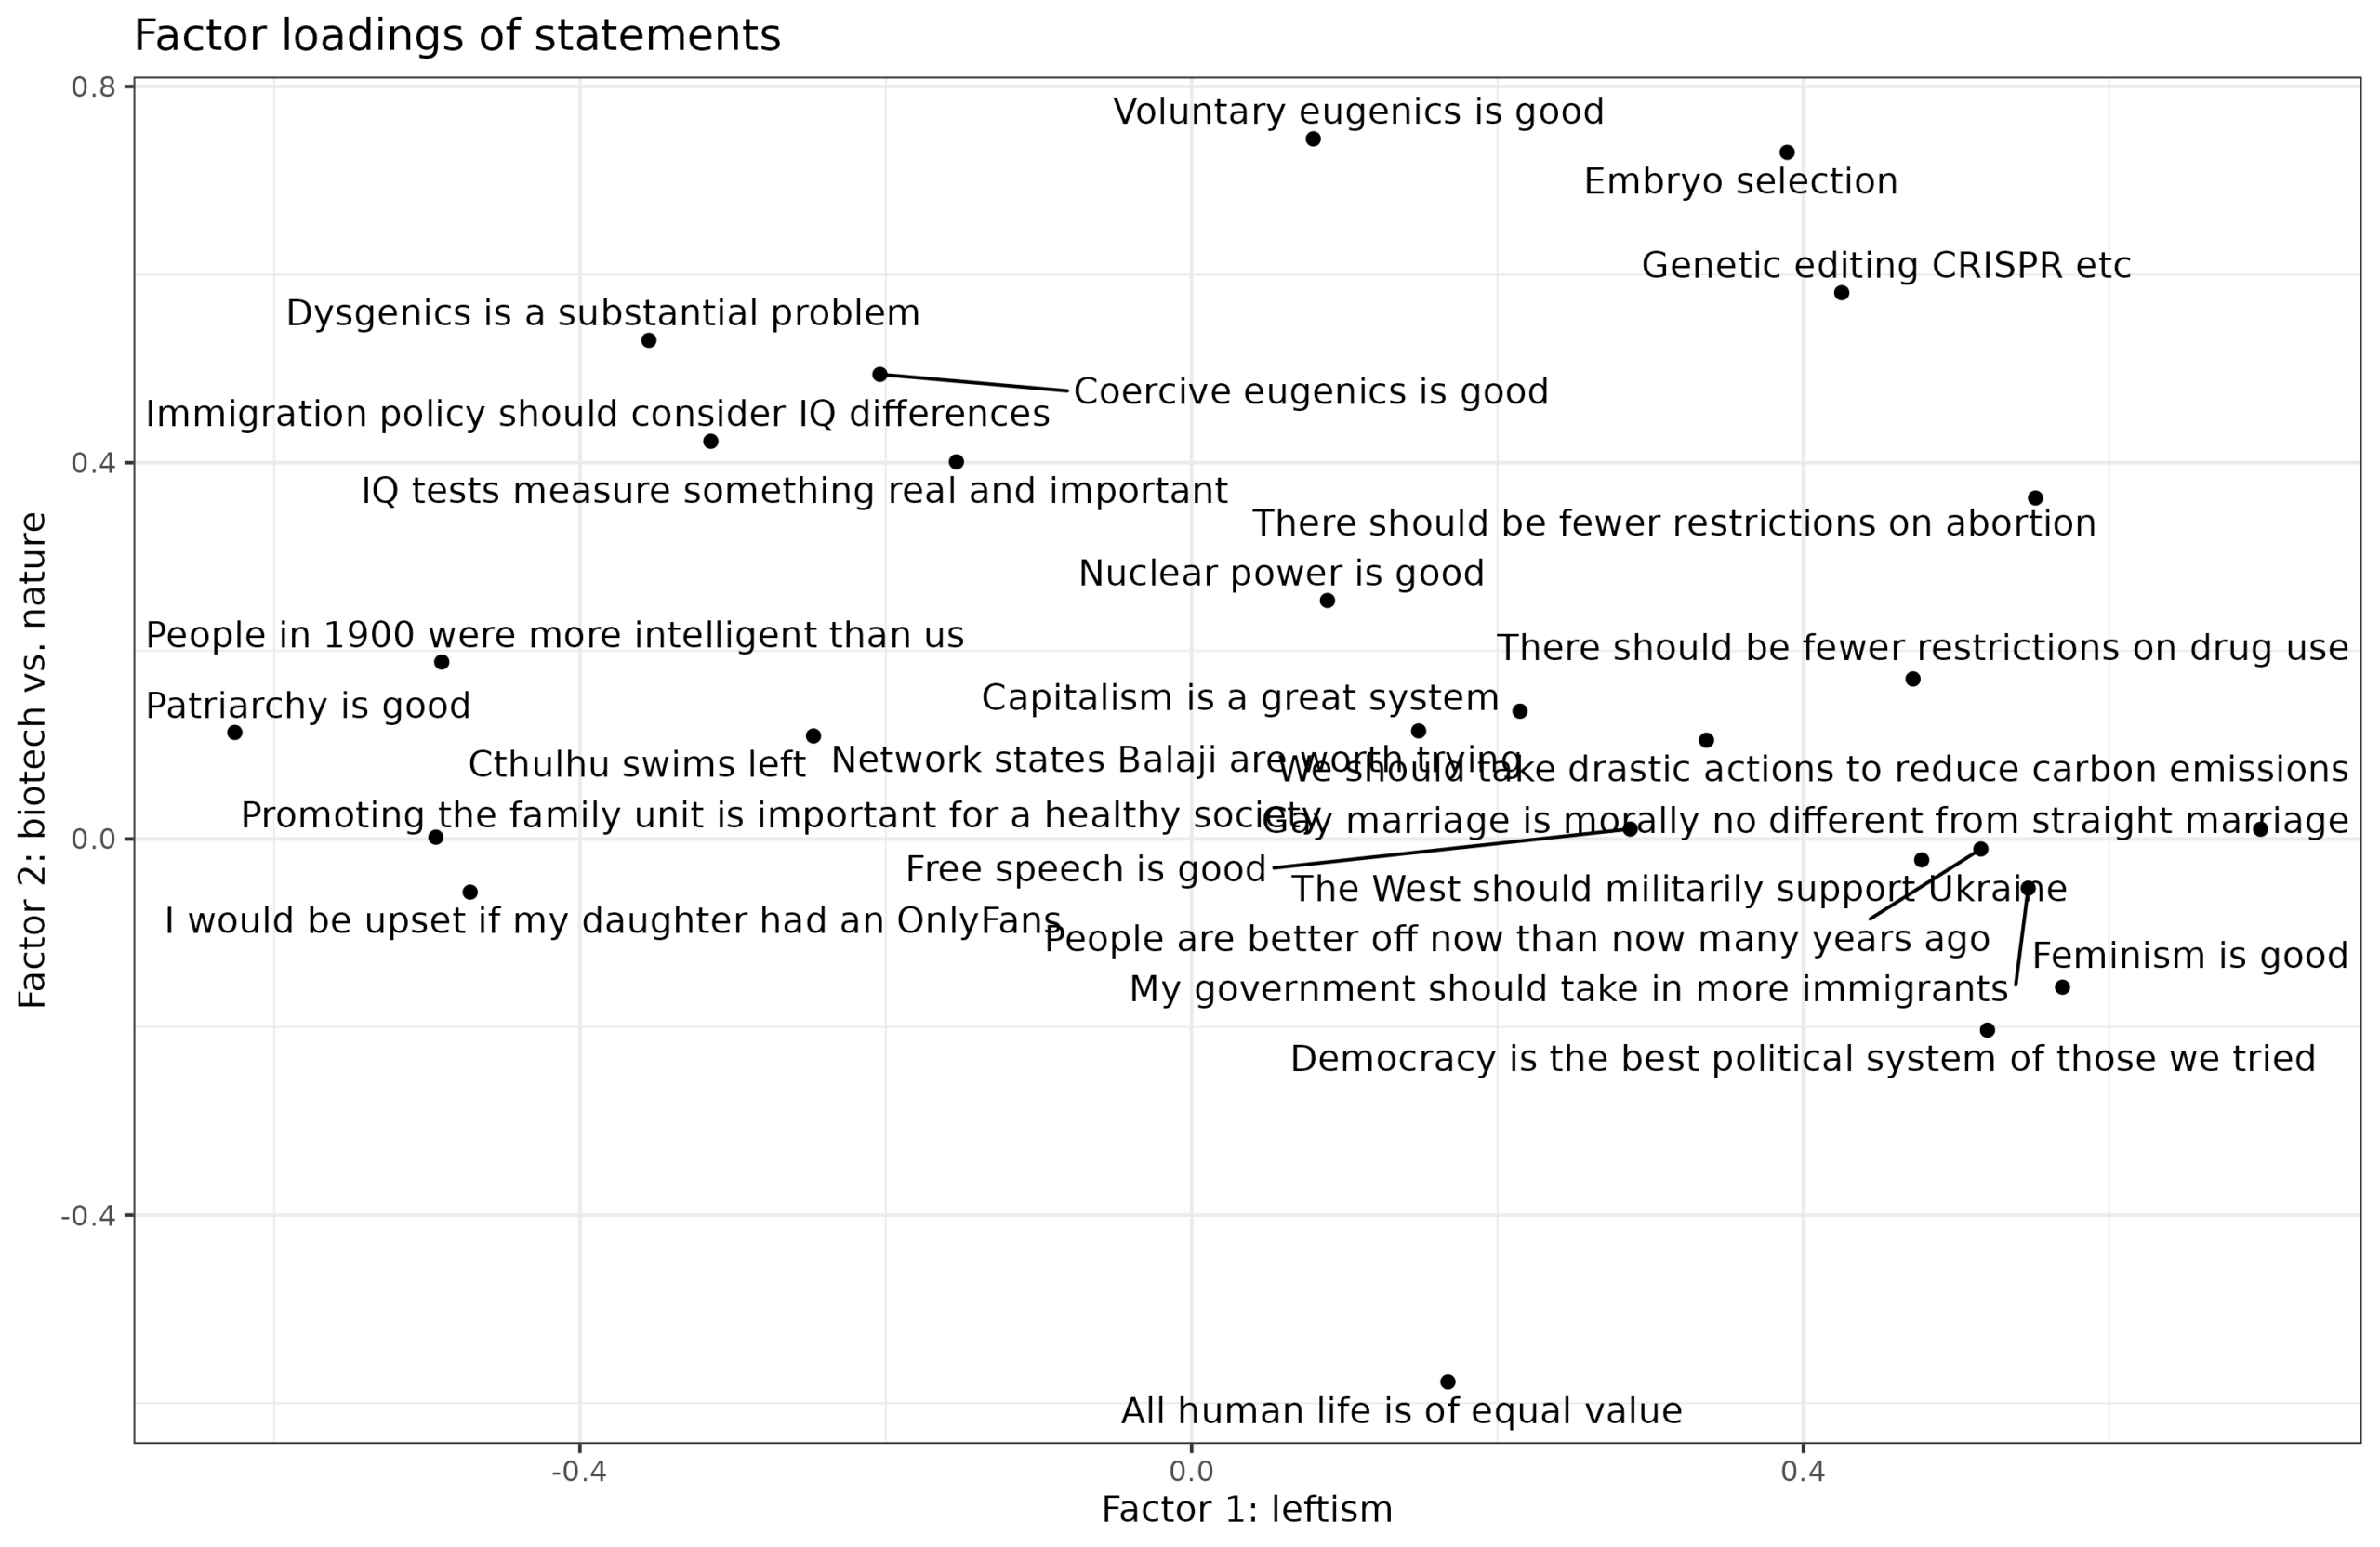
Dimension 1 seems to be leftism, and dimension 2 is perhaps biotech? It's hard to say. This isn't necessarily the best way to summarize the data in 2-dimensions, just one way that optimally explains the correlations with the restriction that there must only be 2 dimensions and they must not be correlated.
There's some more detailed questions about some of these, e.g. mutational load:
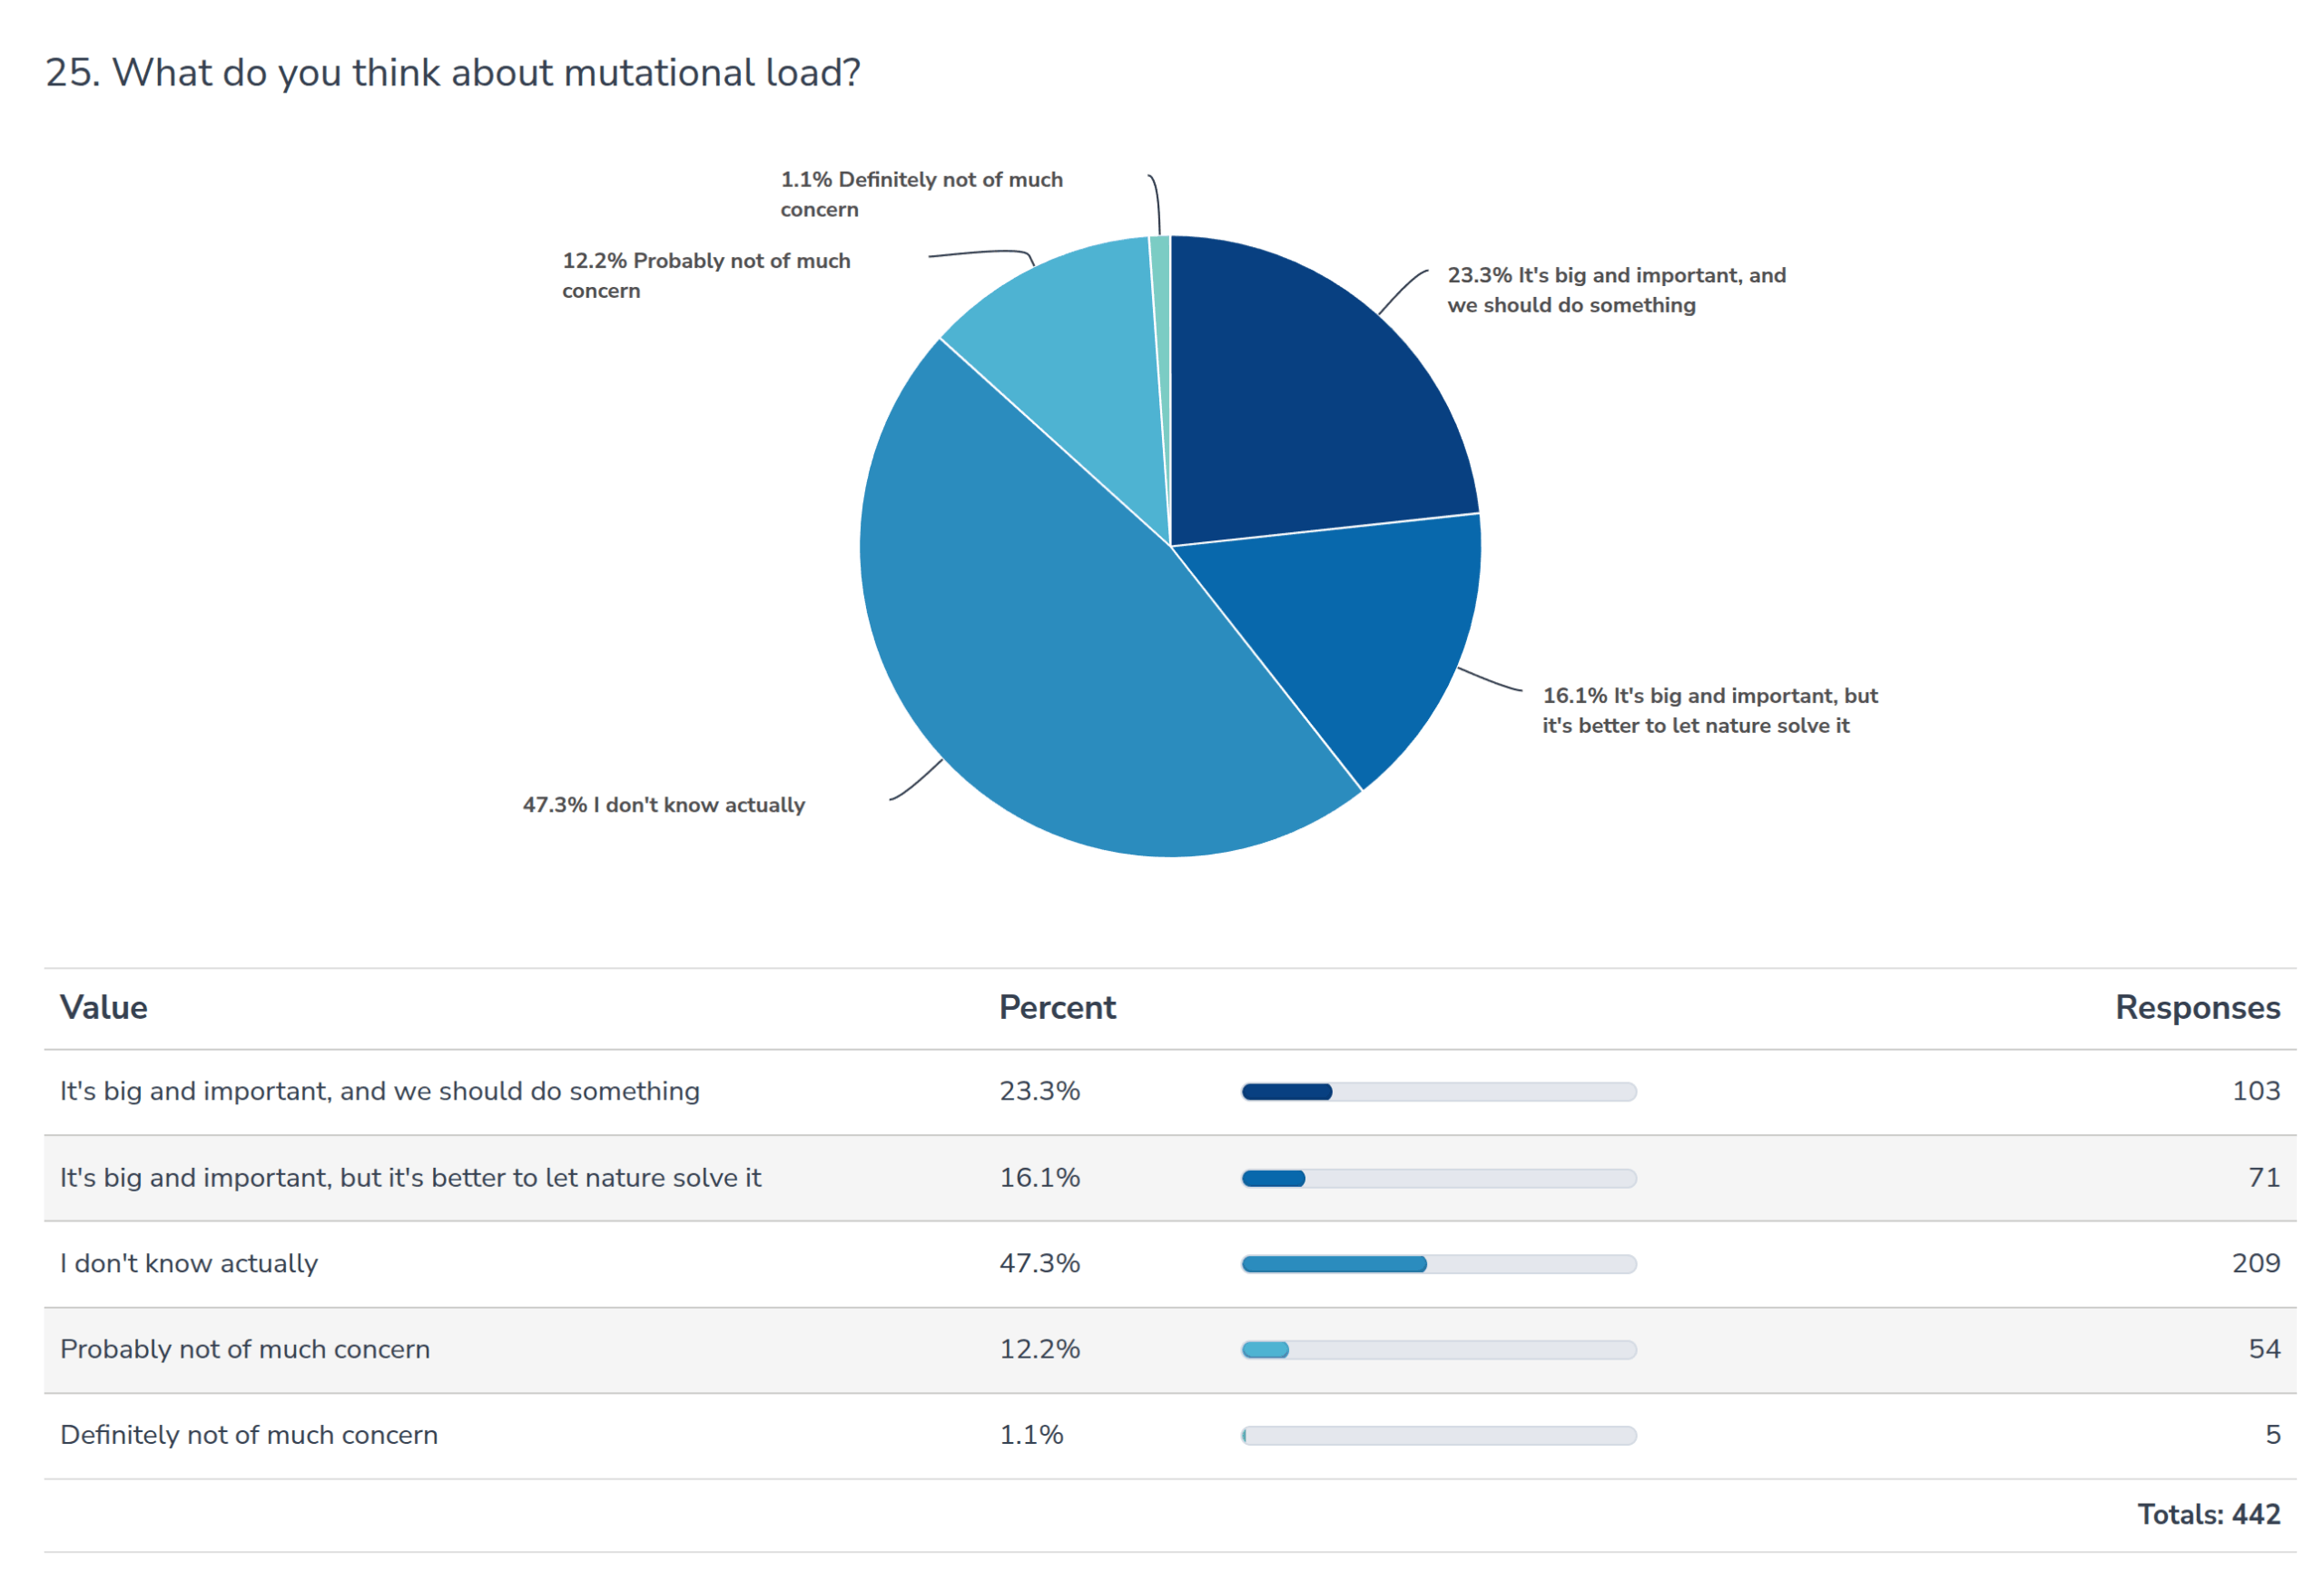
Bronski has been promoting this for a while, so I was curious to see what the readers thought. Apparently, agnosticism is the most common view, whereas my view is only at 12%.
Finally, I was curious to see which of the 7 cardinal sins people thought was the worst:
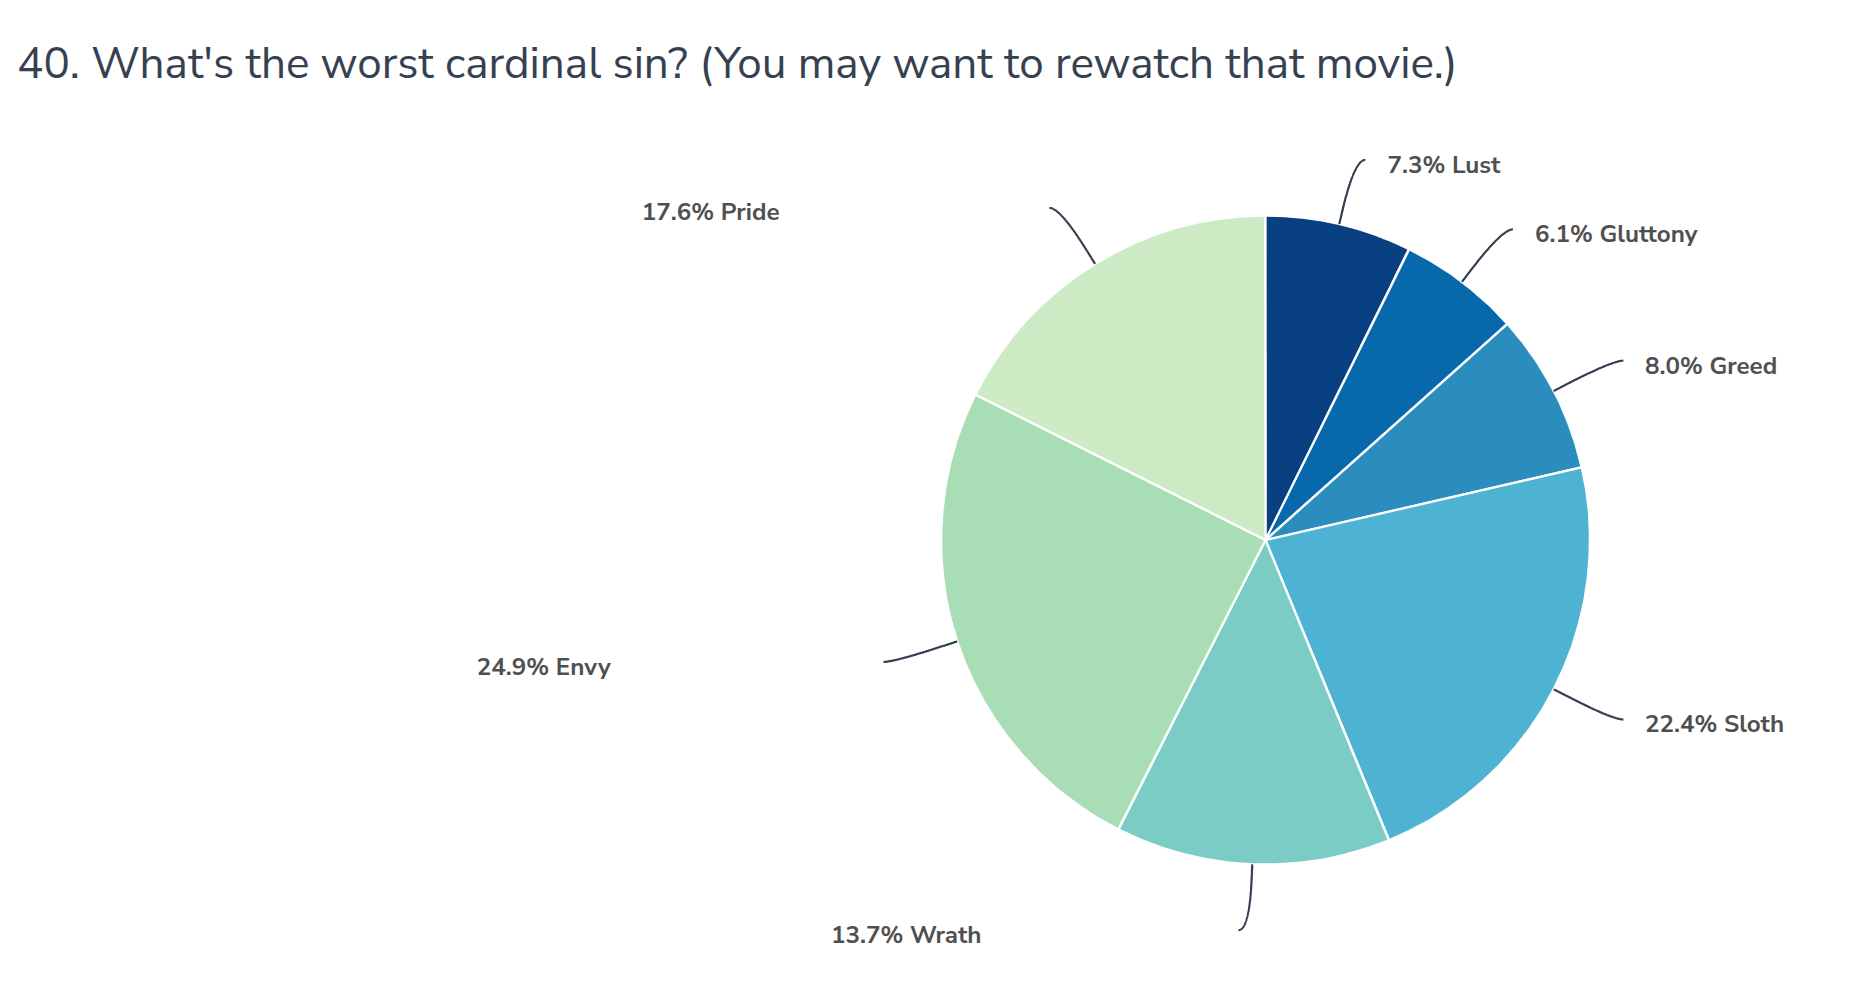
I tend to think it's sloth, which was the second most popular option after envy. Apparently, not that many people think gluttony is a big deal. Maybe because half the subjects were Americans.
There were also the questions about psychology, but they weren't too interesting because the results were about the same as last time, and requires some data cleaning. TL;DR:
Mean IQ is 120-130 (many maxed out the tests I linked), openness very high.
Most common mental problems. ADHD, autism, depression, anxiety (each about 12%).
2/3 were happy or very happy, mean neuroticism on the low side.
Agreeableness slightly below average.
Extroversion below average.
Conscientiousness slightly above average.
Some highlights from the public comments and my comments below:
Your truly HBD Marxist. Thanks one year more. I recommend Stephen K. Sanderson, The Evolution of Human Sociability: A Darwinian Conflict Perspective.
Will do
Emil is secretly in love with an African Jew.
I regret to inform you that the fiancee tested 0% for both
I would like to see more content on the topic of executive function/cognitive control.
It's mostly just intelligence, but I guess ADHD has some independent correlation with it.
"The Outsiders", an old Gift of Fire article, radically changed my life for the better. Also, please maintain a page of recommended/requested psychometric tests, so that next survey we can have already tested ourselves and have answers ready.
Could do
Thinking IQ was in any way relevant to Nazi acquittals at Nuremberg is real stupid.
Someone emailed me the amusing finding, even if it is particularly good statistically, it does suggest one look into the question of whether intelligence predicts better legal outcomes (more likely acquittal, or lower sentence)
Your blog is very unusual for being an incredible magnet for both EHC and evil evil rightoids
OK Karlin
Everything is better with some cows around
Agreed
Start livestreaming—people have questions. Ever since the Aristocrat left Jolly Heretic, we've had nothing educational to watch.
Is there some way to monetize this with Substack? Twitter maybe
As odd as Hanania is, he has historically been right that anti-intellectualism undermines important successes of the right. Both on Immigration and Economy the level of sycophancy has harmed outcomes. With the left they are not strict enough on who immigrates and their productivity, and on the right they are at least notionally interested but fail to understand second order impacts or believe outright lies, like climate change not being real. You can't avoid excess low quality immigration and not tackle climate change.
I think it's the weird coalition in the US. Religious right + libertarians/taxes too high + anti-woke. These people aren't natural allies, and the right is not as good at getting them together as the left is with muslims and communists etc.
This survey could be more organized. Some questions are irrelevant or badly done.
Definitely, but it is mostly for fun and most questions are skippable.
I don't think you'll make this one public
Well
The data without the private parts (IPs, GPS, private comments etc.) are here, and my analysis code and results are here. The figures not seen in the code were copied from the survey software's auto-generated report.
High openness quite puzzles me. You find it here, but also with the quite conformist humanities and arts people. It doesn't seem to tell much about of what sort the preference for novelty is, not if it is knowledge based or notion based, not if it actively pursued by exploratory behaviour or just a more passive receptivity/ infectability for novelty in the close environment. There seems to be a clear correlation with achievement. But being high in openness is also quite flattering and one might want to have that trait. I wonder what would happen if the big five questionnaires were inversed so that each question would be substituted with its "shadow question", asking for the dark aspect of the trait. "Dark" is maybe sufficiently dark if it is non-conventional: Asking the humanities and arts people if they would read a blog about race intelligence differences, the results would be different than asking for "trying something totally unfamiliar is exciting to me".
🧲💯🚀