
Sibling admixture regression in Mexico
New kickass study by Wang et al

A week ago, a landmark study dropped:
Wang, S., Berumen, J., Vergara-Lope, A., Baca, P., Barrera, E., Rivas, F., ... & Visscher, P. M. (2025). Direct effect of genetic ancestry on complex traits in a Mexican population. medRxiv, 2025-09.
Human populations differ in disease prevalences and in average values of phenotypes, but the extent to which differences are caused by genetic or environmental factors is unknown for most complex traits. Comparing phenotypic means across populations is confounded by environmental differences and comparisons based on polygenic predictors can lead to biased inference1,2. Family-based analyses of genetically admixed individuals offer a powerful framework for disentangling the direct and associated effects of genetic ancestry on phenotypes. Here, we leverage genetic data from admixed adults in the Mexico City Prospective Study (MCPS)3,4 to estimate within-family ancestry effects5. We quantified associations between genetic ancestry and 15 complex traits among 52,583 unrelated individuals and in 39,714 relatives across 17,627 families. At the population level, relative to a European ancestry baseline, we estimate an effect of Indigenous American (IAM) ancestry of −1.98 standard deviations (P < 2×10-16) for height and a natural log-odds ratio (lnOR) of 1.73 (95% confidence interval [CI] 1.54-1.92) for type 2 diabetes (T2D, P < 2×10-16), and multiple associations with other traits and ancestries. We estimated a within-family direct effect of IAM of −1.51 standard deviations (P = 1.02×10⁻⁸) for height and lnOR of 5.13 (95% CI 2.48-7.78, P = 1.51×10⁻⁴) for risk of T2D. These direct effects are supported by between-ancestry differences in polygenic burden and evidence of selection at trait-associated loci. In contrast, we found no evidence for a direct effect of ancestry on educational attainment or other study traits despite large and significant associations at the population level, implying environmental causes or confounding. Overall, this study provides an experimental design to study between-ancestry genetic effects for complex traits and reports significant ancestry differences for height, T2D, and metabolic-related traits in a genetically diverse population from Mexico City.
It is not the first admixture study on socially valued traits (ours were, PNG, PNC, ABCD, and Warne's). It is not even the first sibling admixture study, though the first one used the more cryptic principal components approach. Nevertheless, it is a great step forward, so let's go into the details.
The admixture regression model is straightforward. If ancestries differ in allele frequencies that cause trait, and if there are many loci involved spread around the genome, then ancestry % of an individual should predict their outcomes linearly. We showed that this pattern is obtained for IQ, e.g., in PNC:
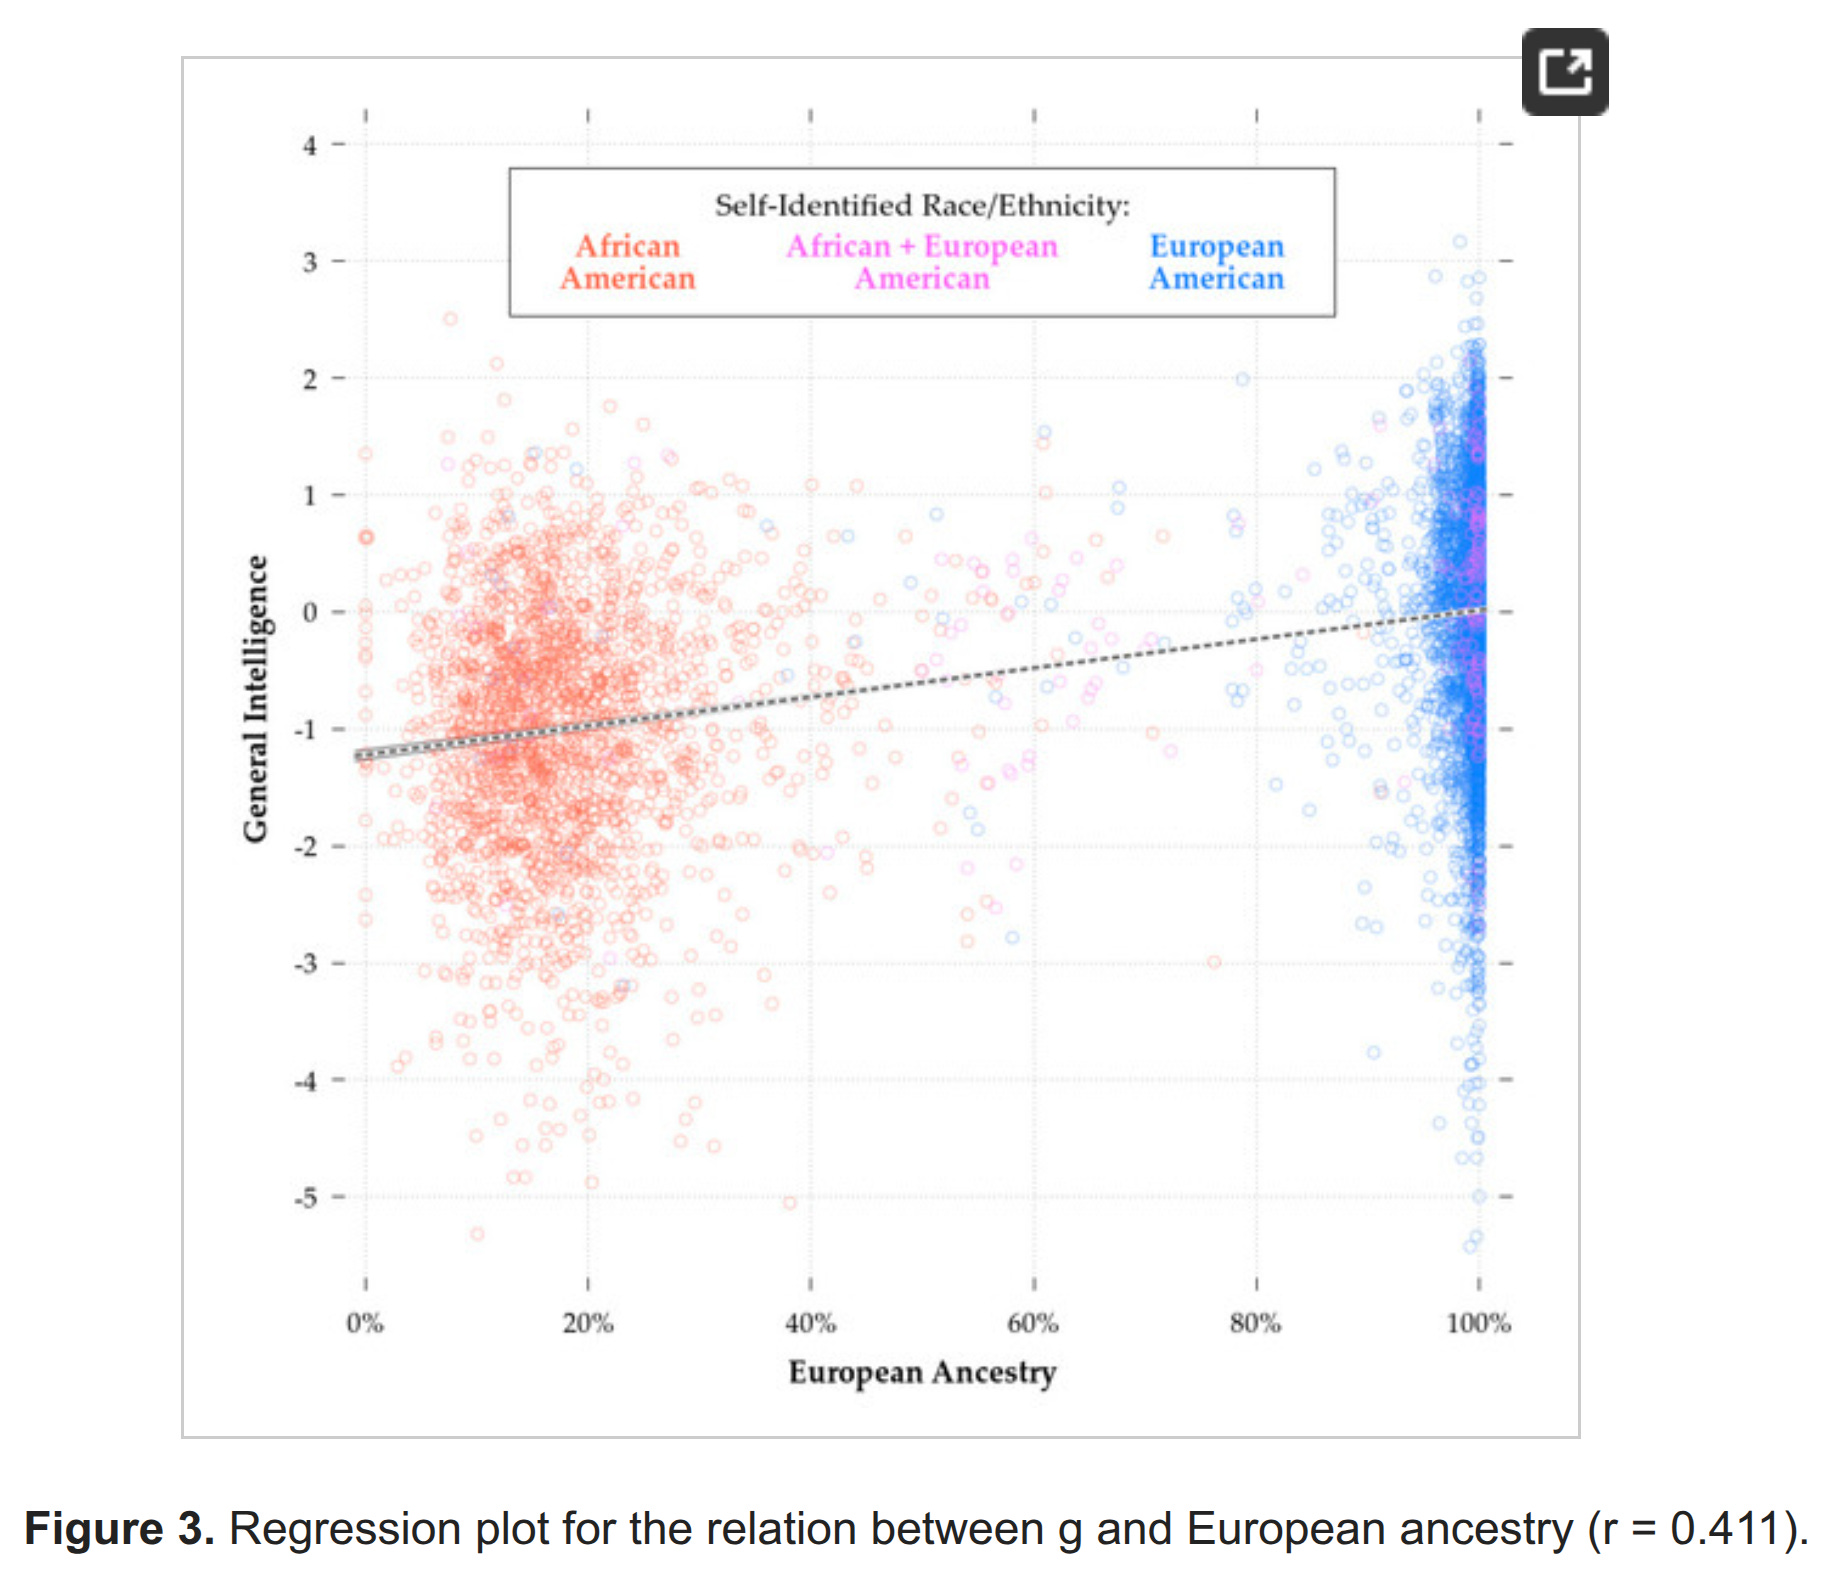
If one has enough cases, one can also limit the sample only to some admixed group, such as African Americans. We didn't publish that plot for PNC, but we did for ABCD:
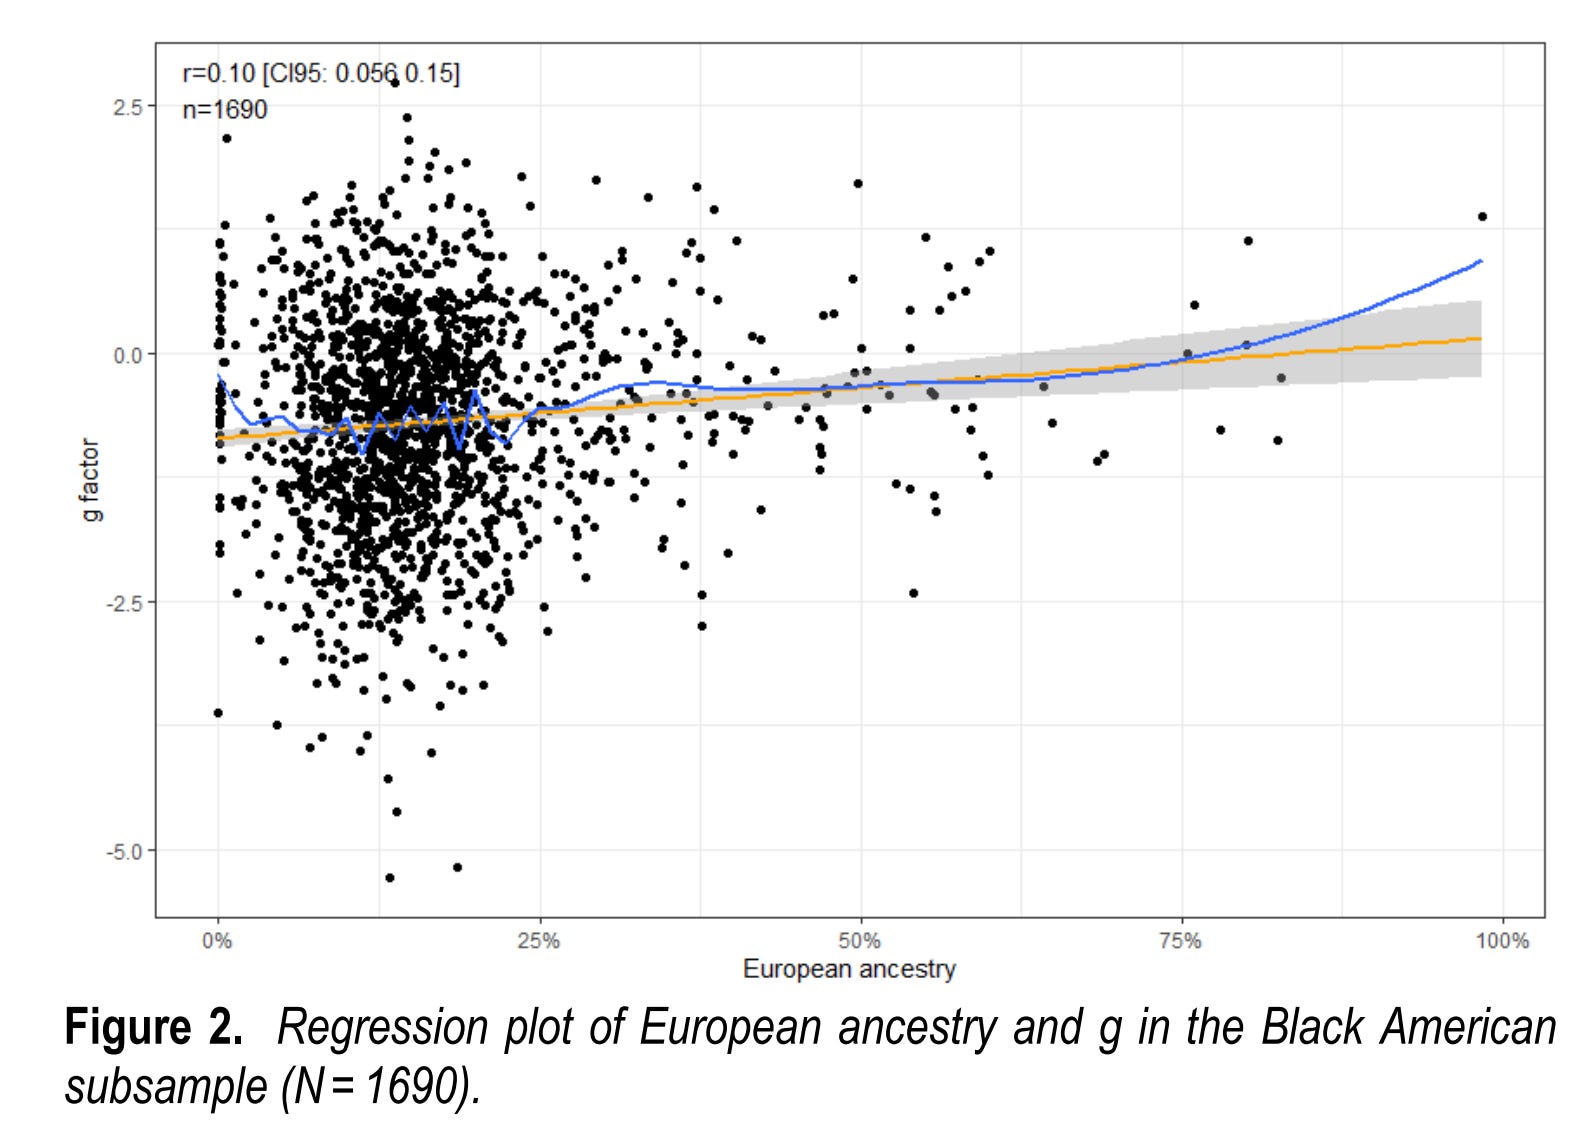
The key insight here is that the correlations are not important, the slopes are. The correlation will be smaller the smaller the amount of variation in the variables are, thus, subsetting by ancestry to makes it much smaller, but does not necessarily impact the slope. Here are estimates of the slope for European ancestry:
PING + African Americans subset: 1.60
PNC + African Americans subset: 0.78
PNC + African Americans subset + skin color PGS control: 0.83
PNC + African Americans subset + skin color PGS + parental SES: 0.67
PNC + African Americans + Whites subset: 1.23
PNC + African Americans + Whites subset + control social race: 0.75
PNC + African Americans + Whites subset + control social race + skin color PGS: 0.74
PNC + African Americans + Whites subset + control social race + skin color PGS + parental SES: 0.59
ABCD + African Americans subset: 1.07
ABCD + African Americans subset + control for skin color PGS + self-report discrimination + others: 1.08
ABCD + African Americans subset + control for skin color PGS + self-report discrimination + parental SES + others: 0.89
The values aren't exactly comparable due to differences in scale construction (IQ metric), and the standard errors for PING are quite large. Nevertheless, no matter what controls are included, a large effect of ancestry is found. This is also true if the Amerindian component is included (for Hispanics).
There is the nagging worry, of course, that maybe the controls aren't enough. Some unobserved or imperfectly observed control variables are missing. If they are very important, the main findings may be rendered unimportant (slope near 0). One approach to this potential confounding problem is that one can compare siblings that have all or most of these potential confounders in common ('shared environment'), growing up together in the same place to the same parents. As such, sibling regression could be used if one has enough siblings. The problem here is that siblings vary very little in ancestry, a few %points at most. As such, a staggering sample size is needed to obtain sufficient power. Visually, it could look like this:
Using siblings only, it is possible to estimate the slope of the red line, but it would require a very large enough because the expected correlation among siblings alone would be something like 0.02. If you plug that into a power calculator, it says you need ~20k pairs. Gwern did some simulations years ago to verify this.
The authors obtained such a dataset from Mexico. Mexico is great for admixture analysis because most people are mixed and thus contribute useful data to an analysis. This is in contrast to the UKBB and most American datasets which have large number of White siblings, but since essentially all of their ancestry is European, they don't contribute much to such an analysis. They report the amount of variation in Amerindian ancestry:
For IAM [Amerindian] ancestry, the between-family SD is 0.167 whereas the within-family SD is only 0.020.
Their between-family regressions found these results (in slopes):
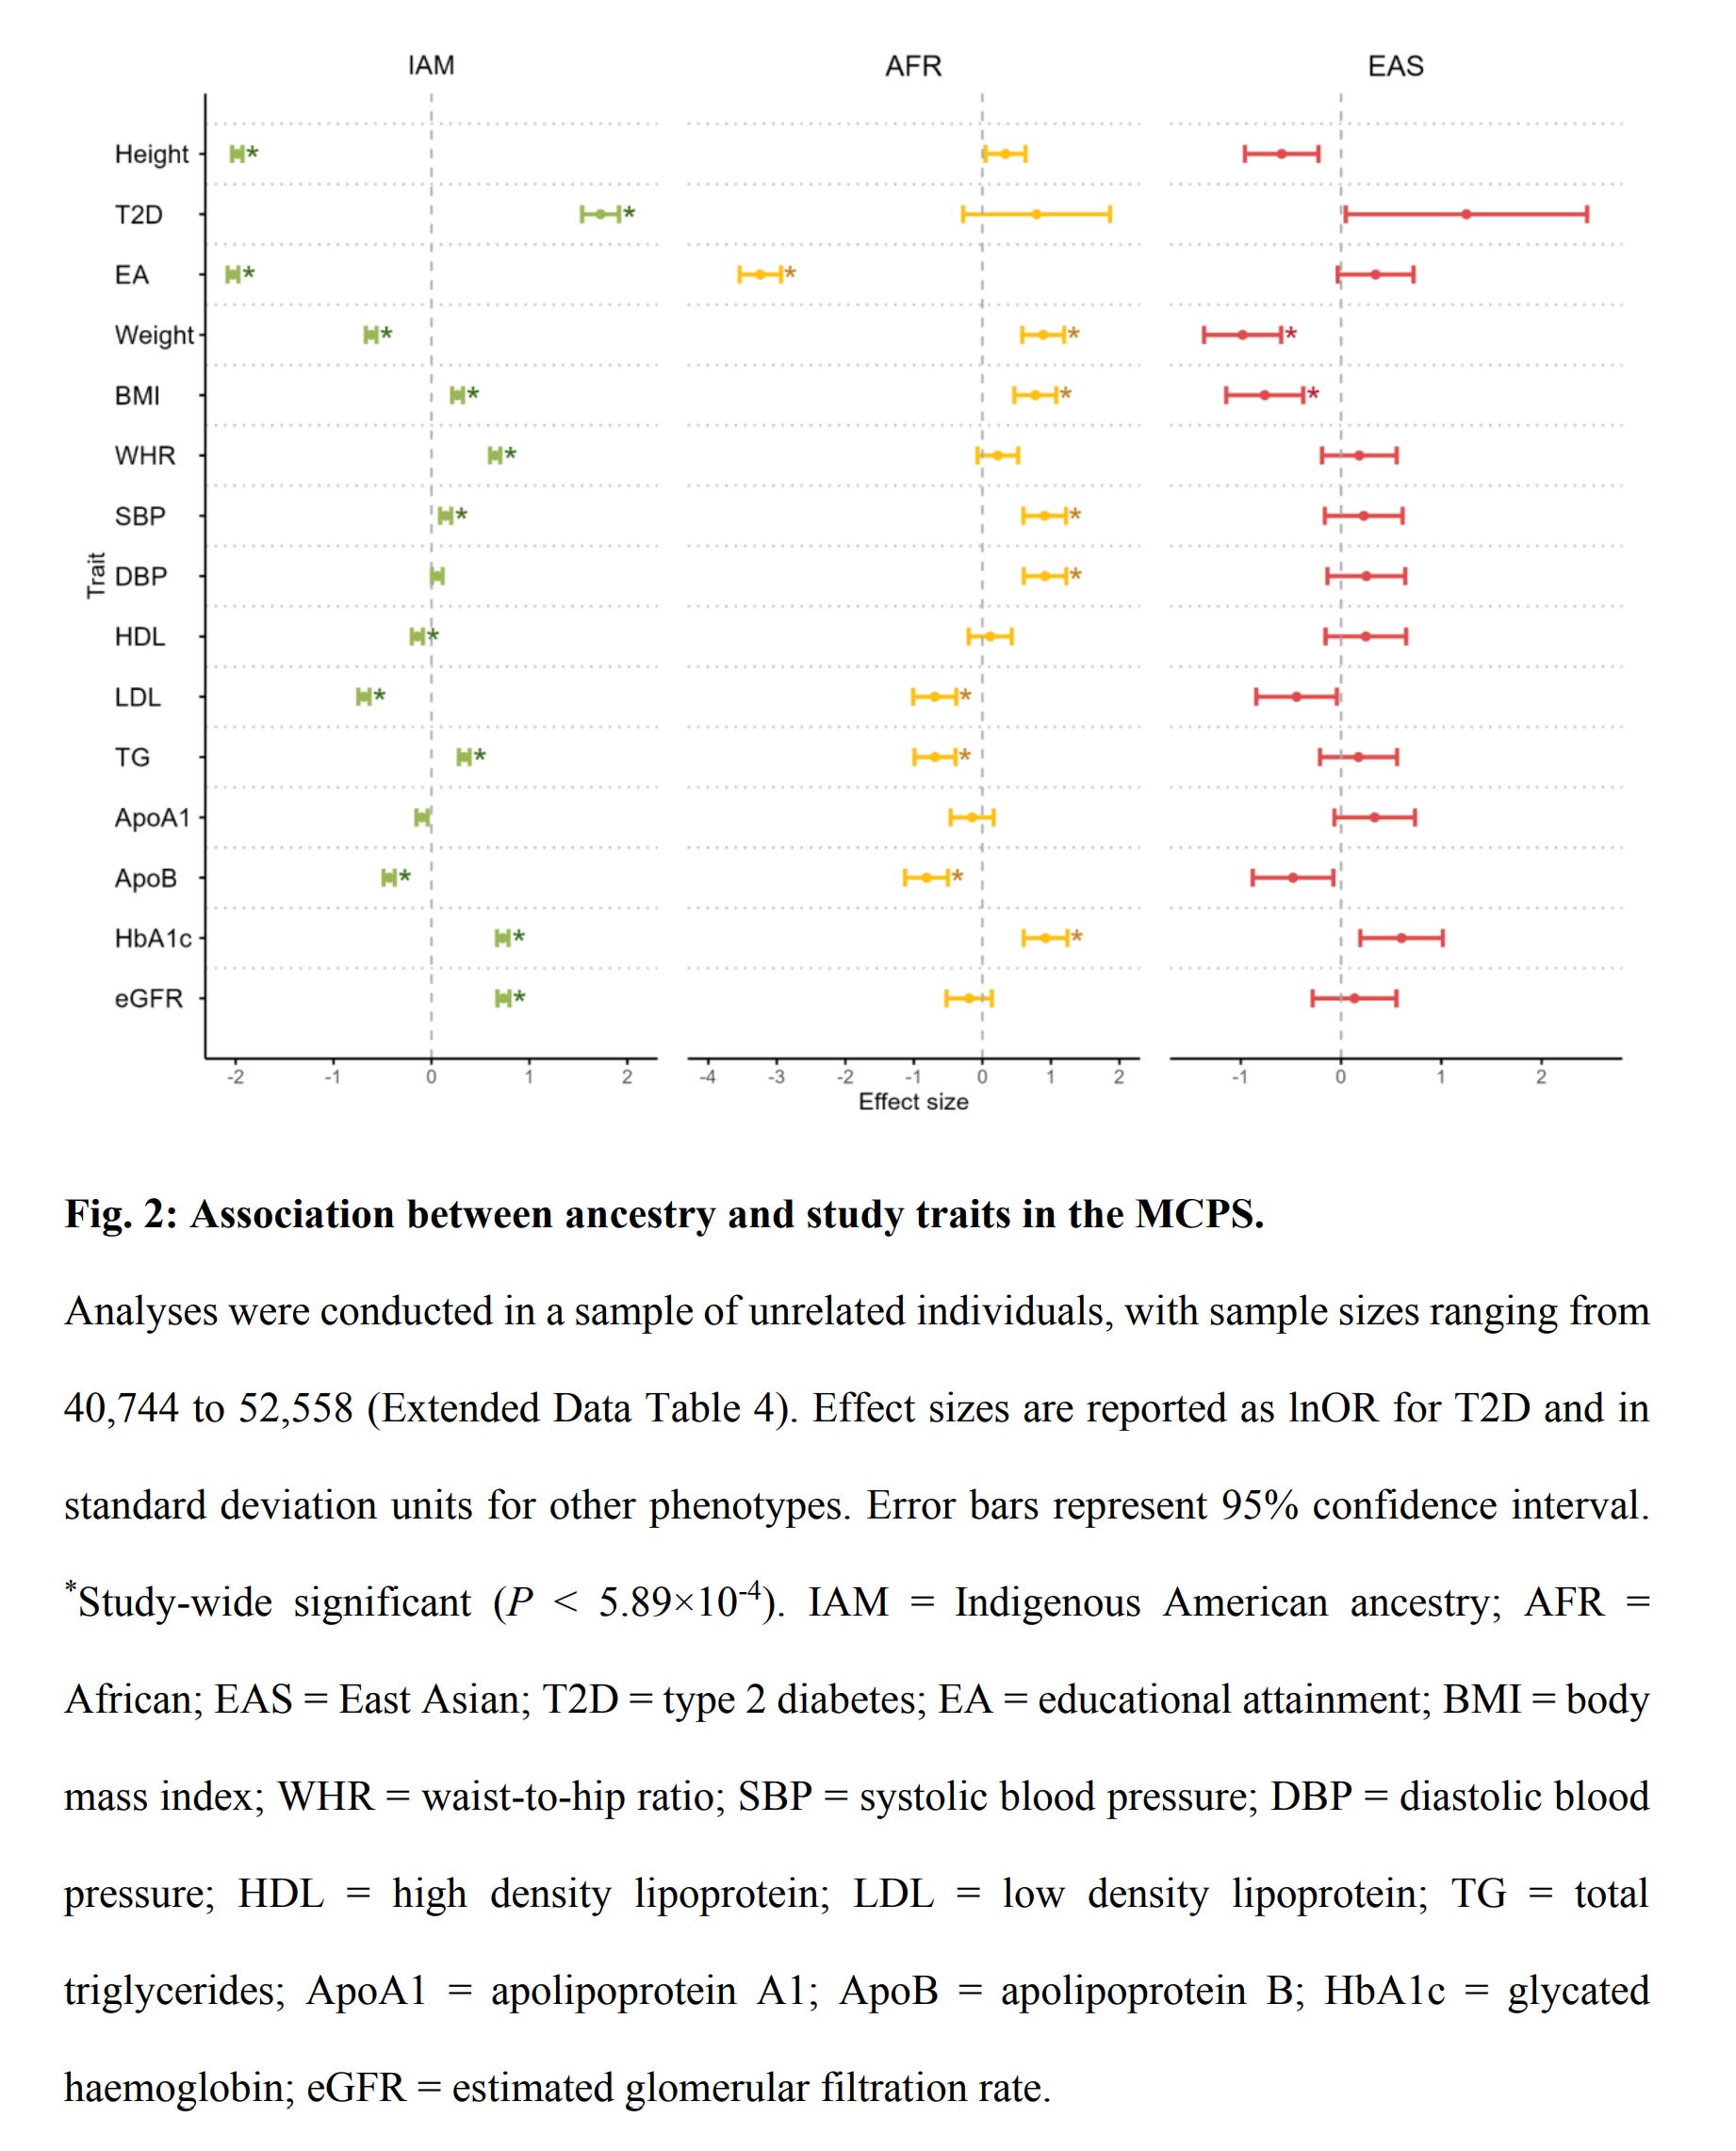
The most obvious effects are:
Height has an Amerindian slope of -2
Educational attainment of -2 for Amerindian and -3.3 for African
Type 2 diabetes of +1.8
There are many effects for the biomarkers, but they are of little interest to most people and mainly serve as example phenotypes. These results are in line with known group differences and previous results. Their analysis was underpowered for the within family comparisons (siblings) but large enough to see some results:
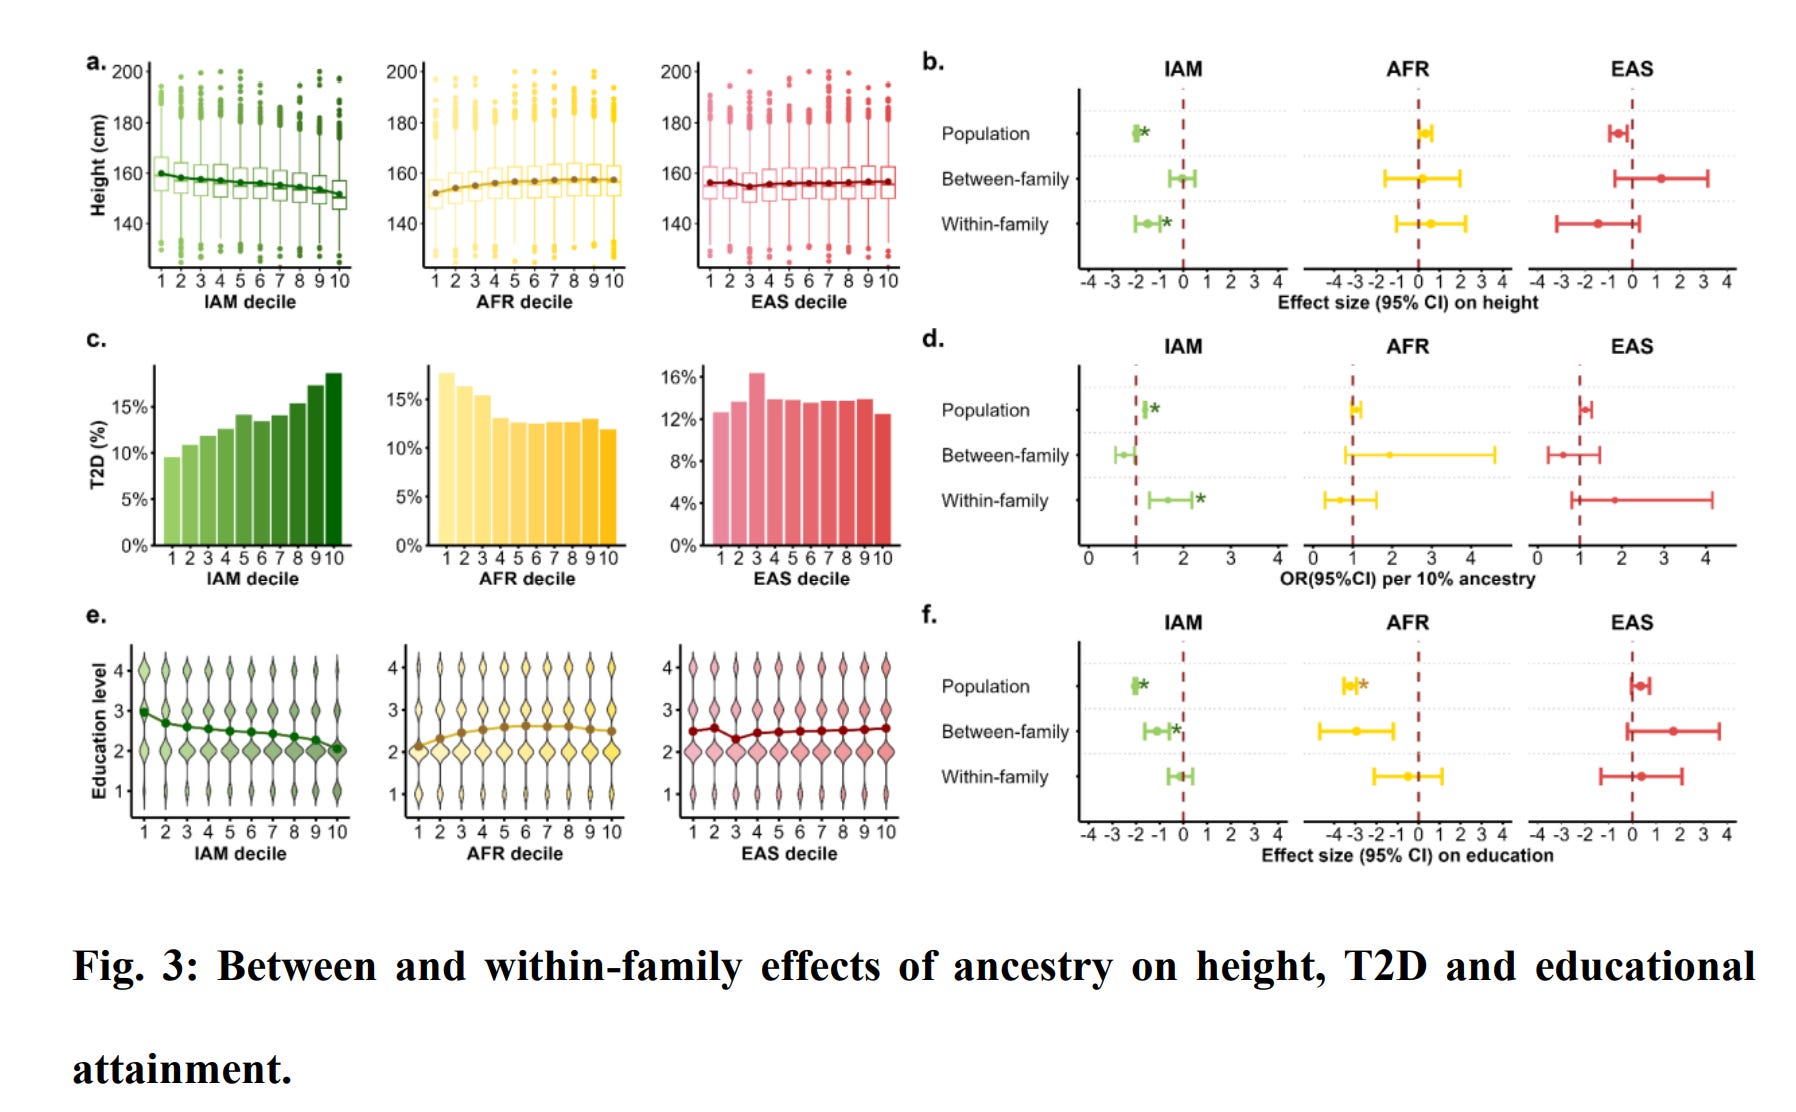
As the authors note:
For the 90 trait-ancestry combinations, we found three significant associations within families (Supplementary Table 3). There was a within family direct ancestry effect of IAM ancestry on height −1.51 SD (95% CI: [−2.02, −1.00], P = 1×10⁻⁸), whereas the between-family ancestry effect was not statistically significant (Fig. 3b), consistent with the population-level associations being driven by genetic effects, which are accounted for by the within-family effect. Similarly, we found a strong direct ancestry effect of IAM on T2D risk (lnOR = 5.13 [95% CI 2.48-7.78], P = 1.51×10⁻⁴). In contrast, the estimated direct ancestry effect for educational attainment was close to zero, despite a large and significant (β = −1.11, P = 2.51×10⁻⁵) between-family association (Fig. 3f).
So the height and T2D replicated within family, consistent with genetic causation, but not educational attainment. It thus appears genetic ancestry does not actually cause such differences among siblings. There are some oddities to this. The within family effect of ancestry on T2D is larger than the population effect (5.13 vs. 1.8). It's difficult to see how this could make causal sense.
To supplement their findings, they show that height and T2D polygenic scores differ by ancestry:
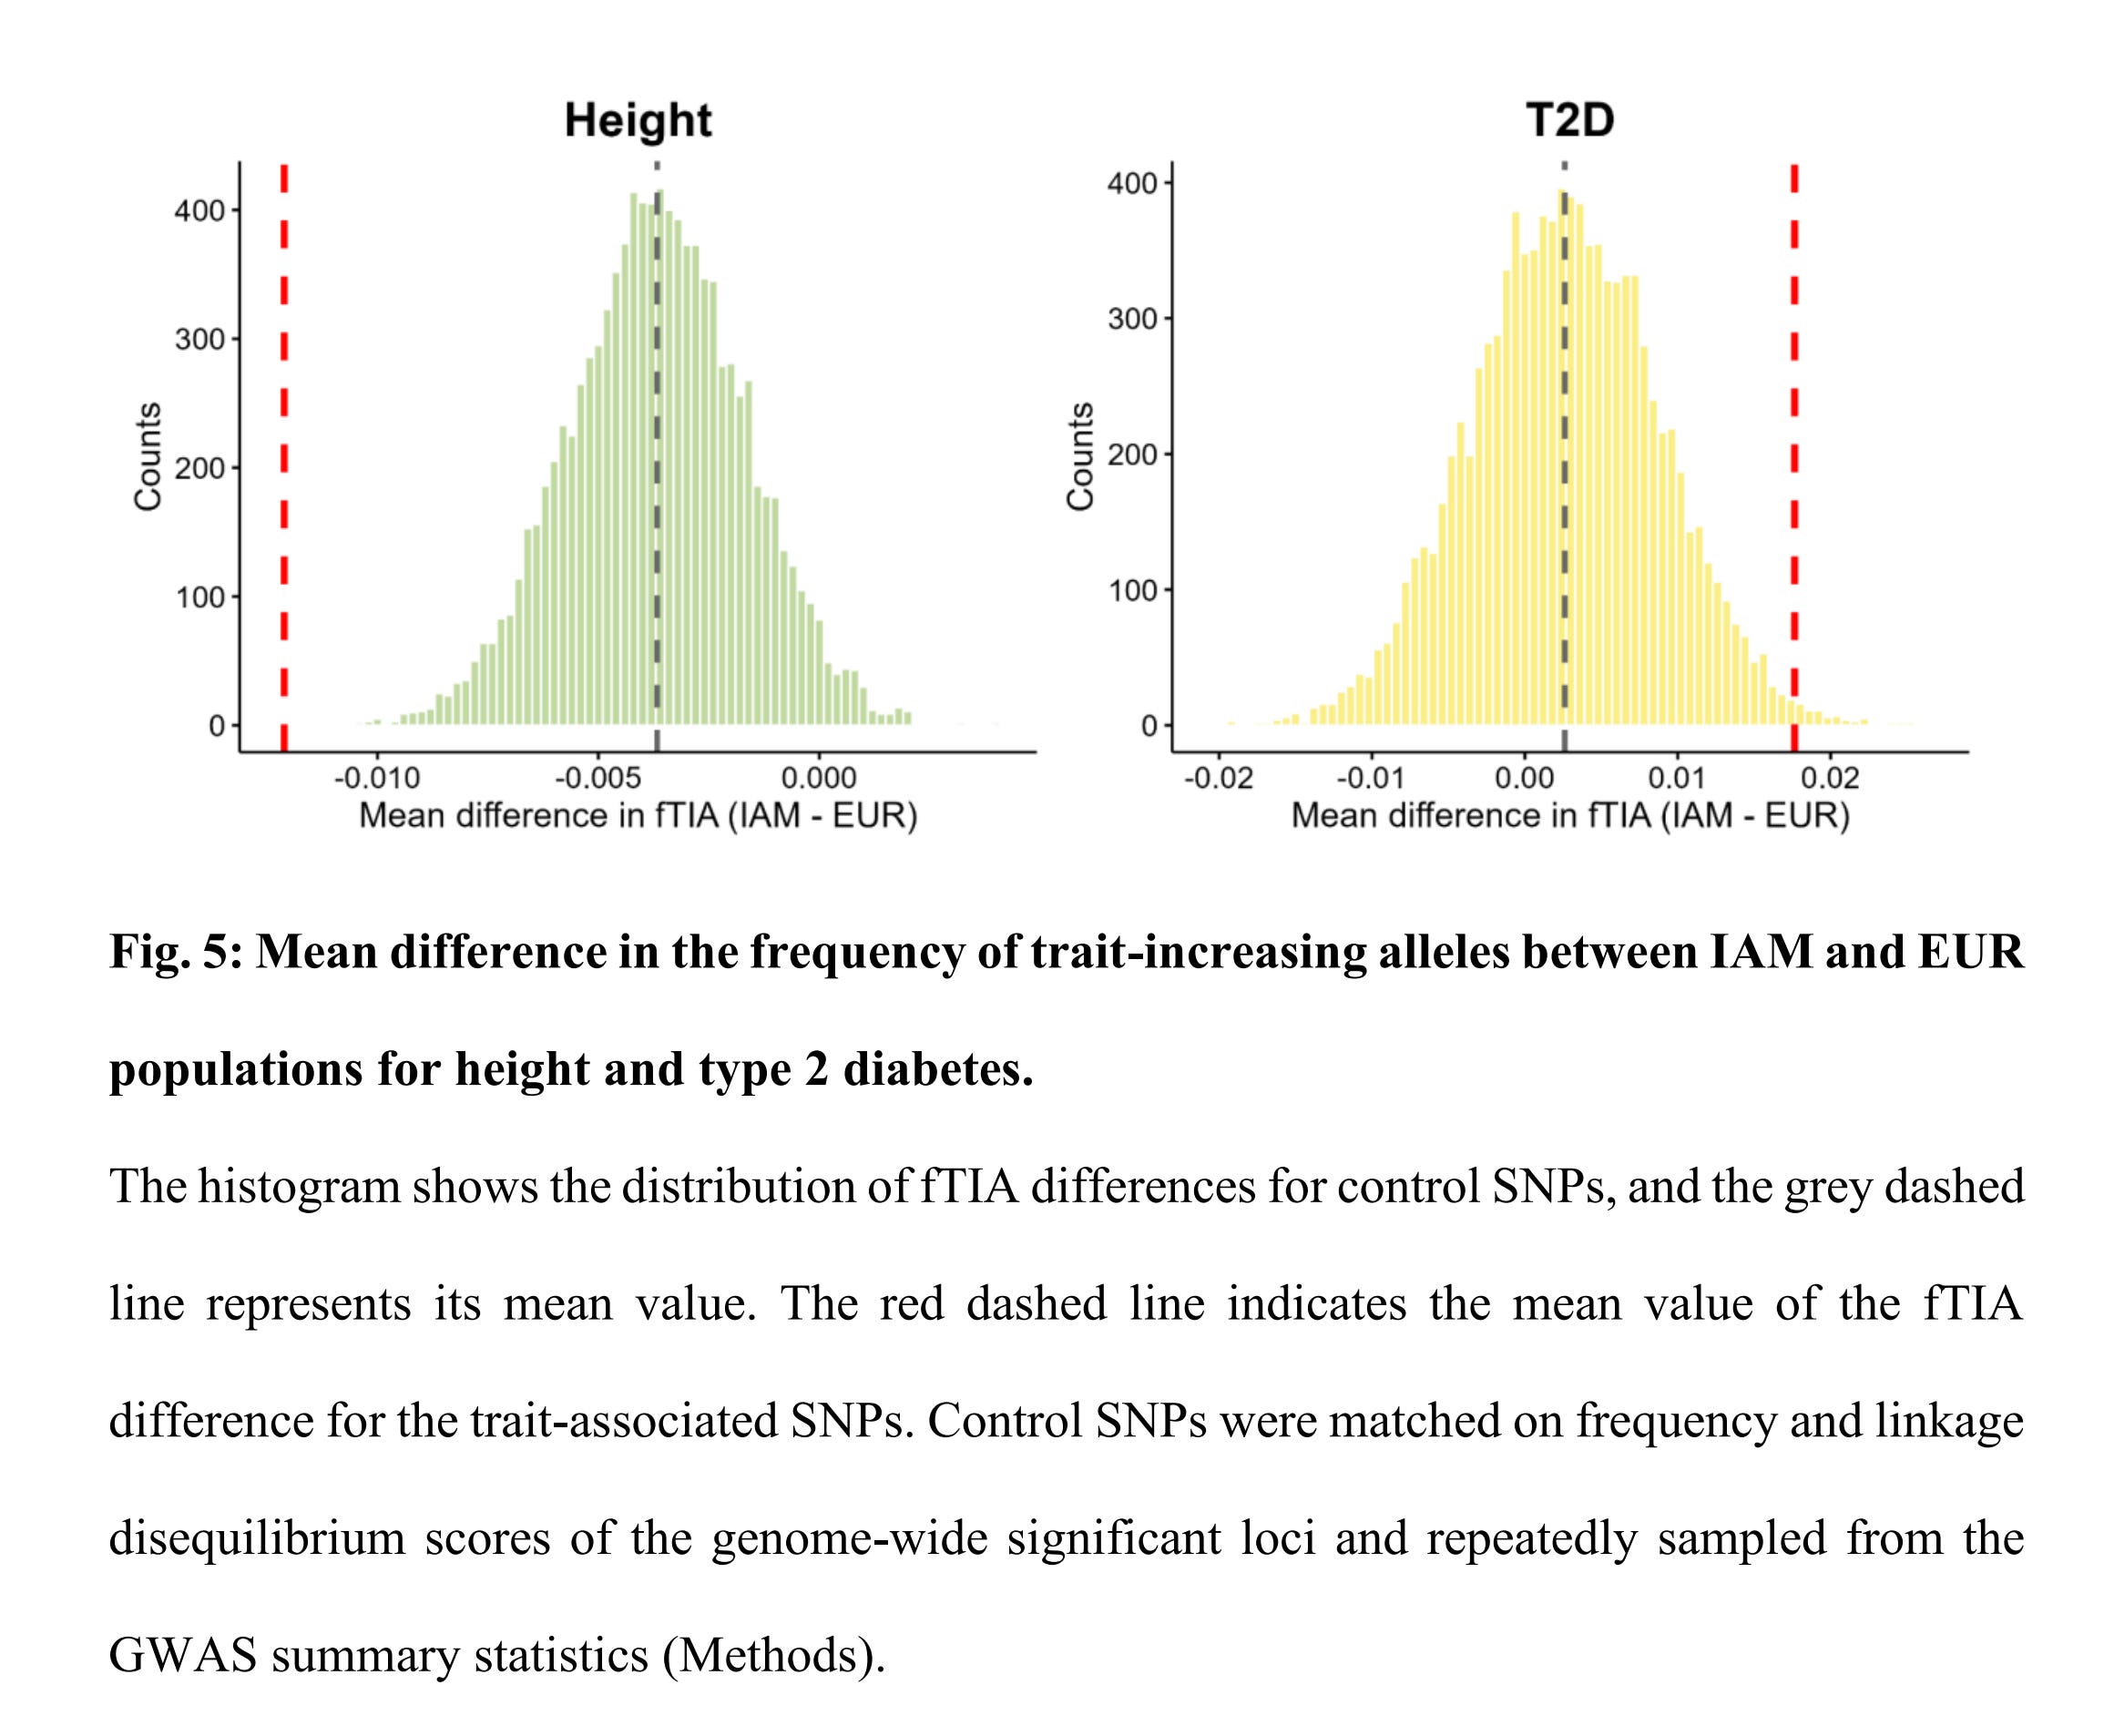
Strangely here is that they chose not to show that this is also true for educational attainment polygenic scores. The latter fact questions their null finding, as well as the usual assortment of indirect evidence that proponents of genetic models put forward (temporal and spatial stability, ecological correlations [climate], resistance to change/interventions, and so on).
Their supplements provide us with more useful information, such as the overall plot comparison of within and between slopes:
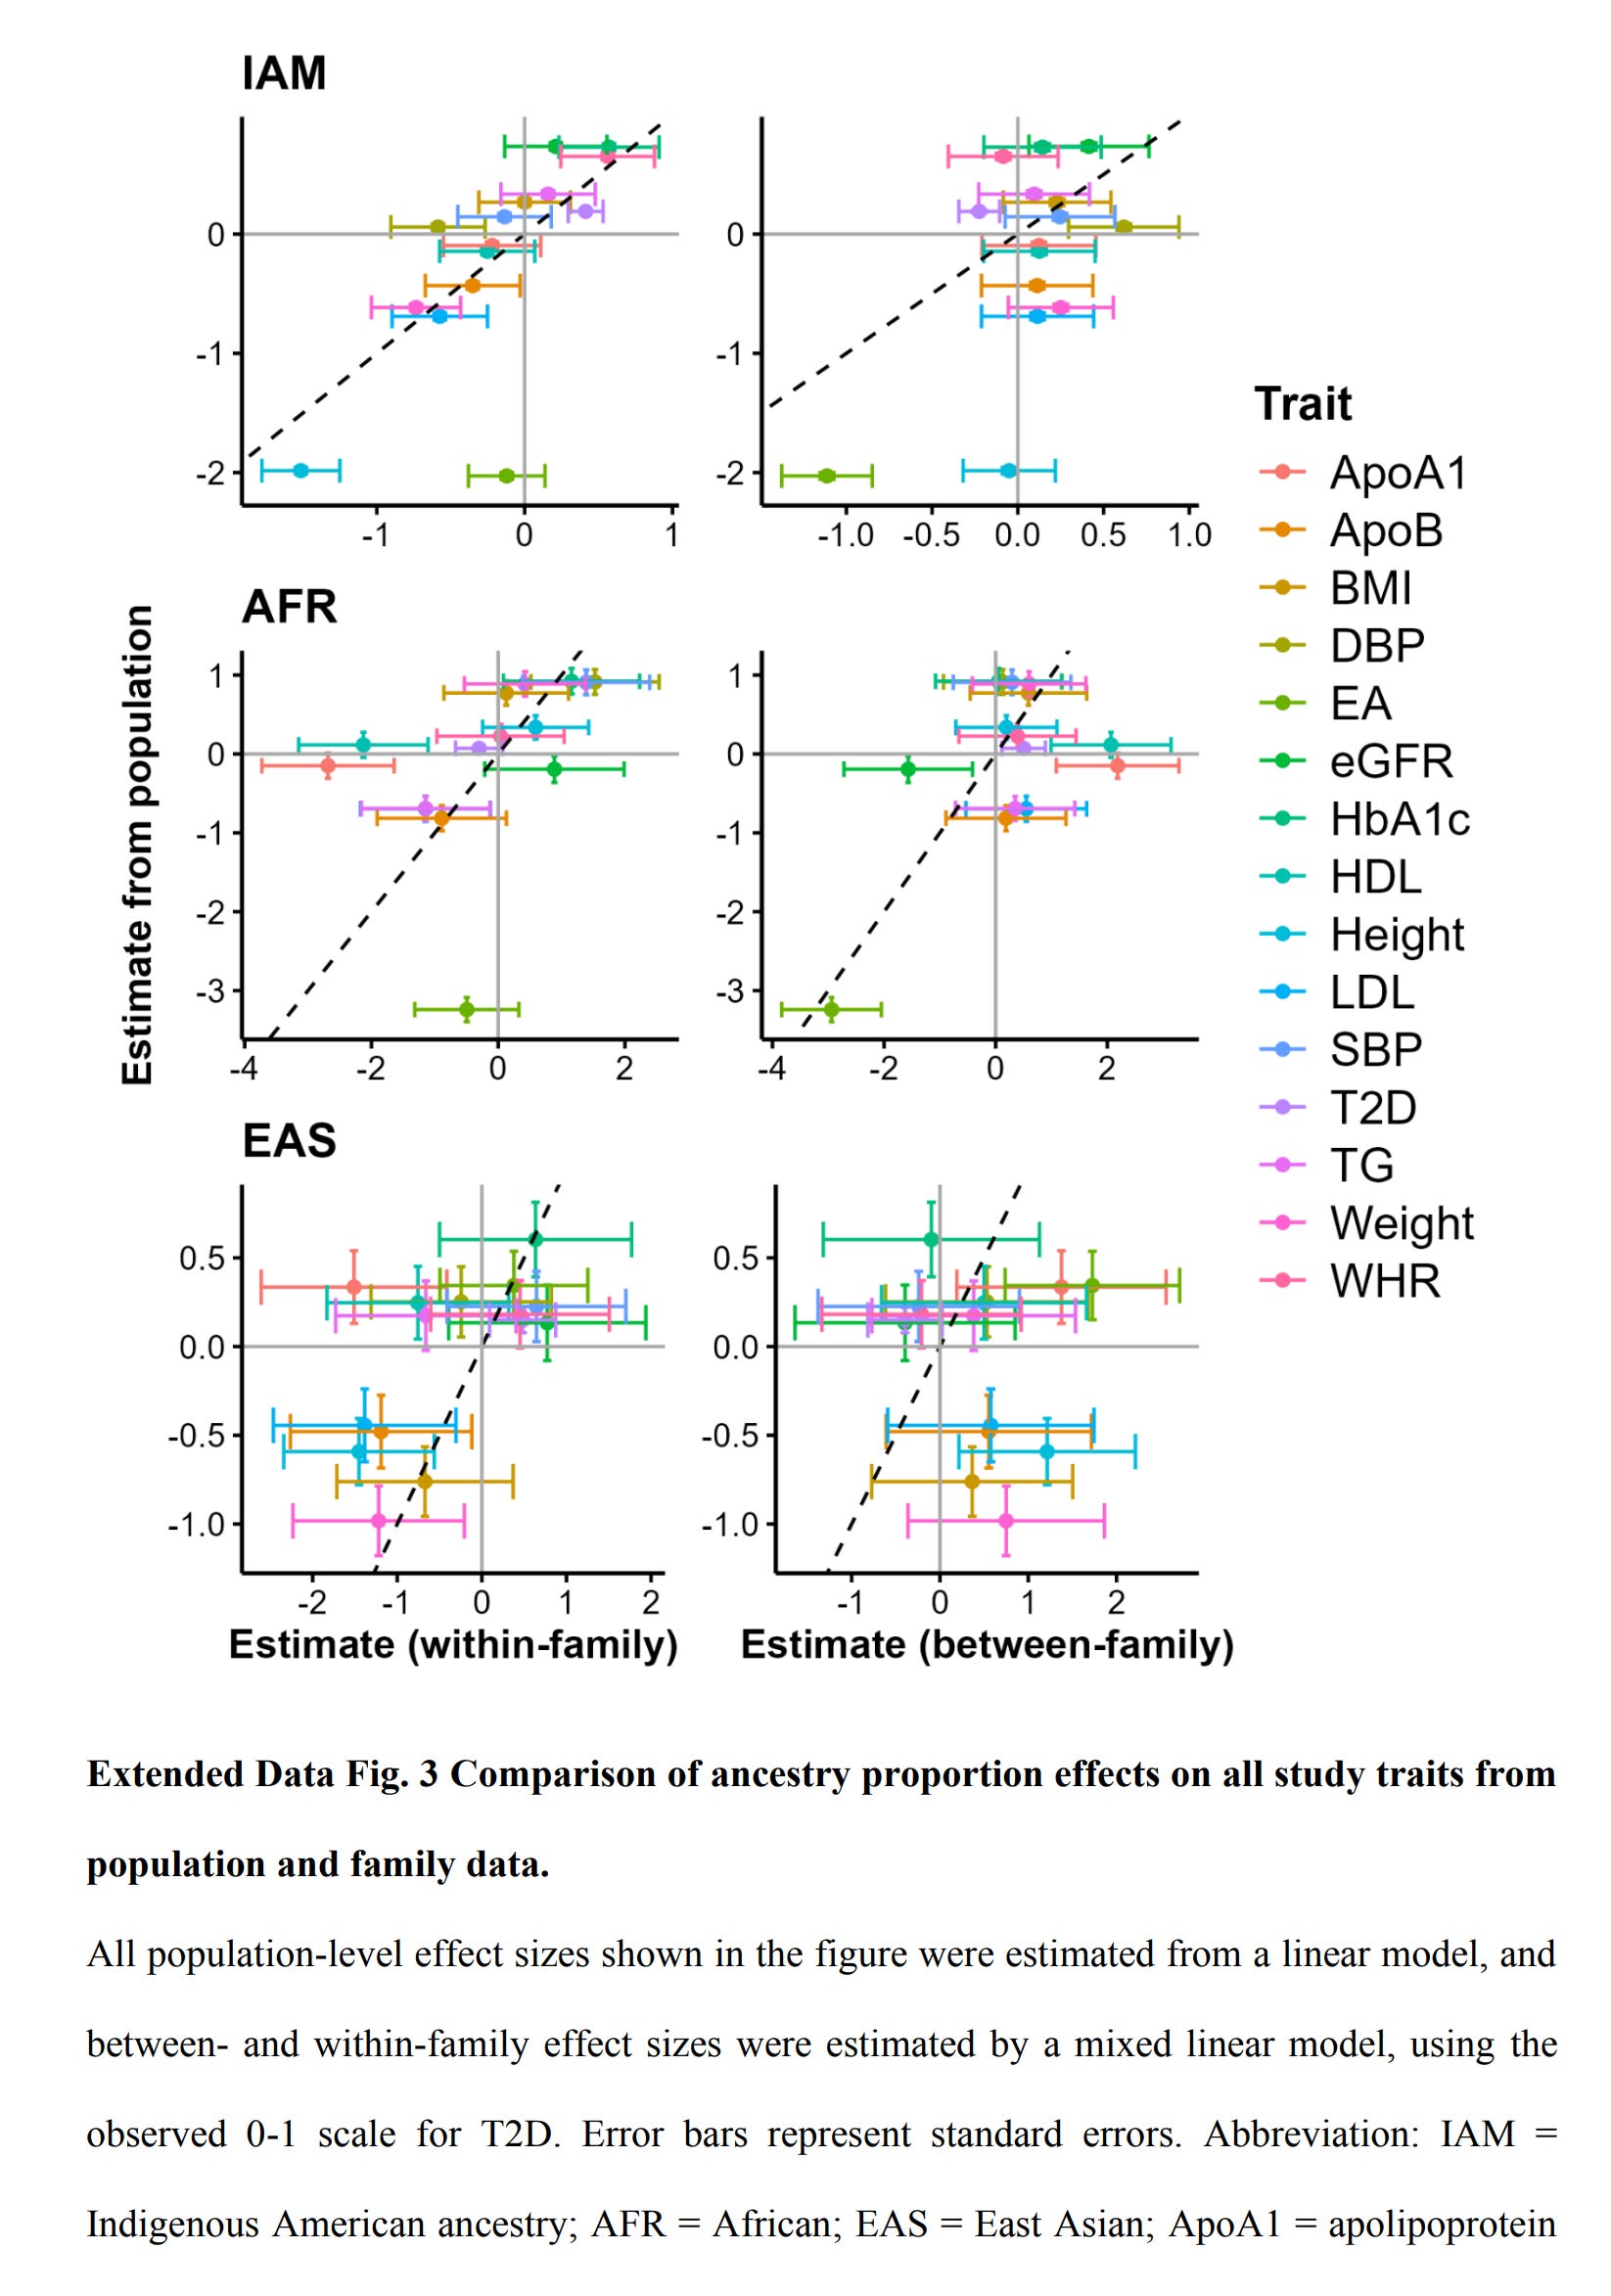
Note how EA sticks out in the plot, that is, the within and between effects are inconsistent. This leads us to the question of why? I mean, one obvious option is that hereditarians were wrong all along and Amerindian ancestry (in this case) doesn't actually cause differences in educational attainment or social status or intelligence. Another option is that there is something wrong with the data or methods. The fact that findings seem OK for height and T2D rules out general data worries. Their measurement of educational attainment seems fairly standard, even if somewhat poor:
Educational attainment was represented by a category variable education (4=university or high school, 3=middle school, 2=elementary, 1=illiterate or literate), which is treated as a continuous trait in the analysis. As a sensitivity analysis we also considered a more fine-grained measure of education using 14 categories (Supplementary Table 10). The inverse normal distribution function was used to derive category thresholds for the 14 categories from their cumulative probabilities, and the mean z-score for each category was calculated assuming an underlying normal distribution with multiple thresholds. This transformation placed the ordinal EA 14 categories on an underlying normal scale. The phenotypic correlation between the 1-4 and the 14-category z-score scale in the entire MCPS cohort was 0.94.
It also doesn't appear to be a sex or age confounding issue:
To make the effect scale comparable across phenotypes, continuous traits were adjusted for age and age2 and standardised (mean 0, SD 1) within each sex, and outliers were further excluded according to mean ± 5SD. Further adjustments were applied for specific traits: BMI was residualised in the standardization for WHR, and fasting duration was residualised for HDL, LDL, TG, ApoA1, and ApoB.
This is a pre-residualization approach, as opposed to included age and sex in the models (this was done for diabetes). The standard errors are small enough that it doesn't seem to be a power failure. Their supplements gives us some details on the regressions:
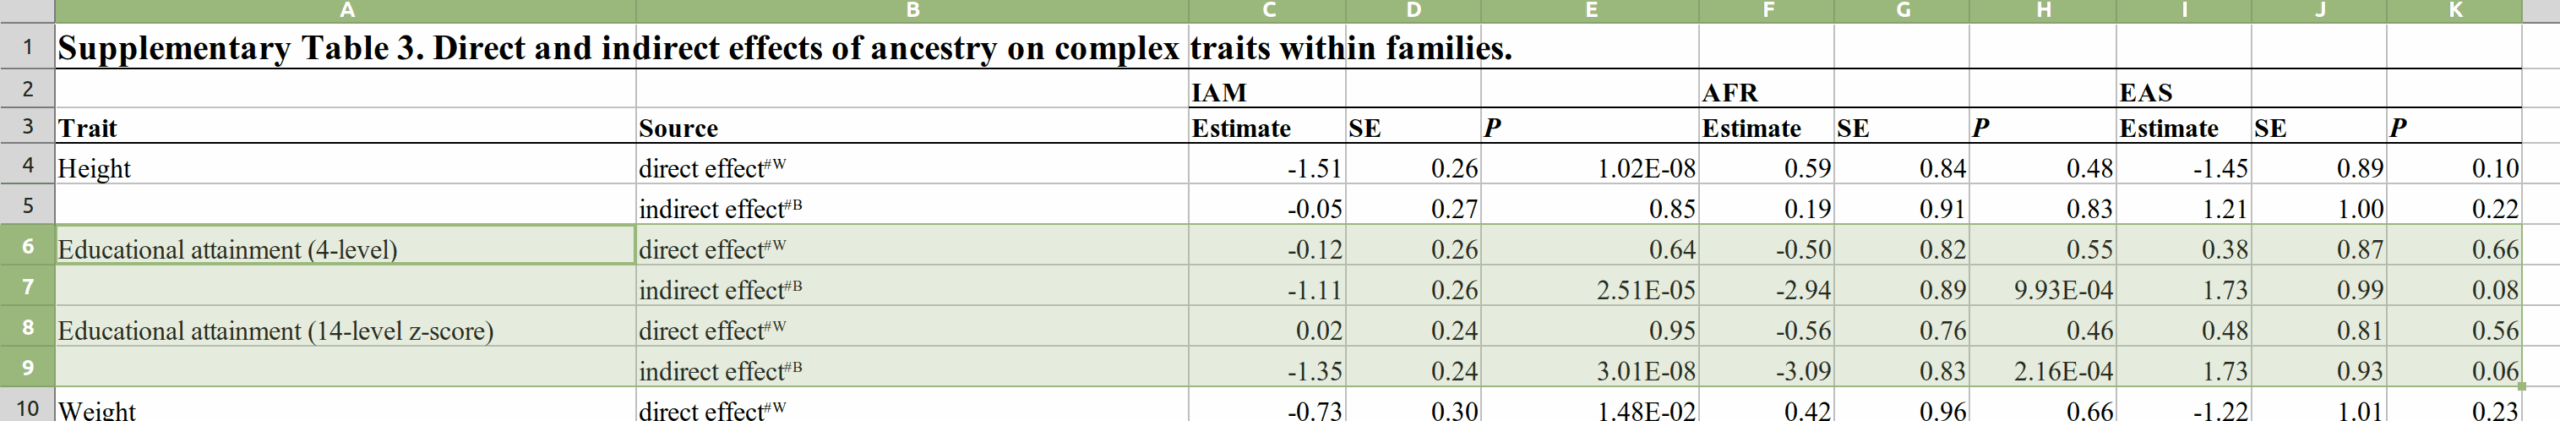
Of the 6 effects reported (2 different encodings), 5 of 6 are in the right direction per hereditarian models (EAS = East Asian, AFR = African). All of them are non-sig. The SEs reported (I don't trust these either) here are 0.26 for Amerindian ancestry, which would mean that the true effect size (slope) should lie between -0.50 and 0.54 95% of the time. Estimates around the upper bound here are congruent with sizable genetic causation of some social gaps in educational attainment. Recall from the list of slopes around that American results are generally around 1.0 for the slope (for IQ).
Another issue for the EA measure is that their sibling IBD regression likewise showed a negative non-sig. heritability:
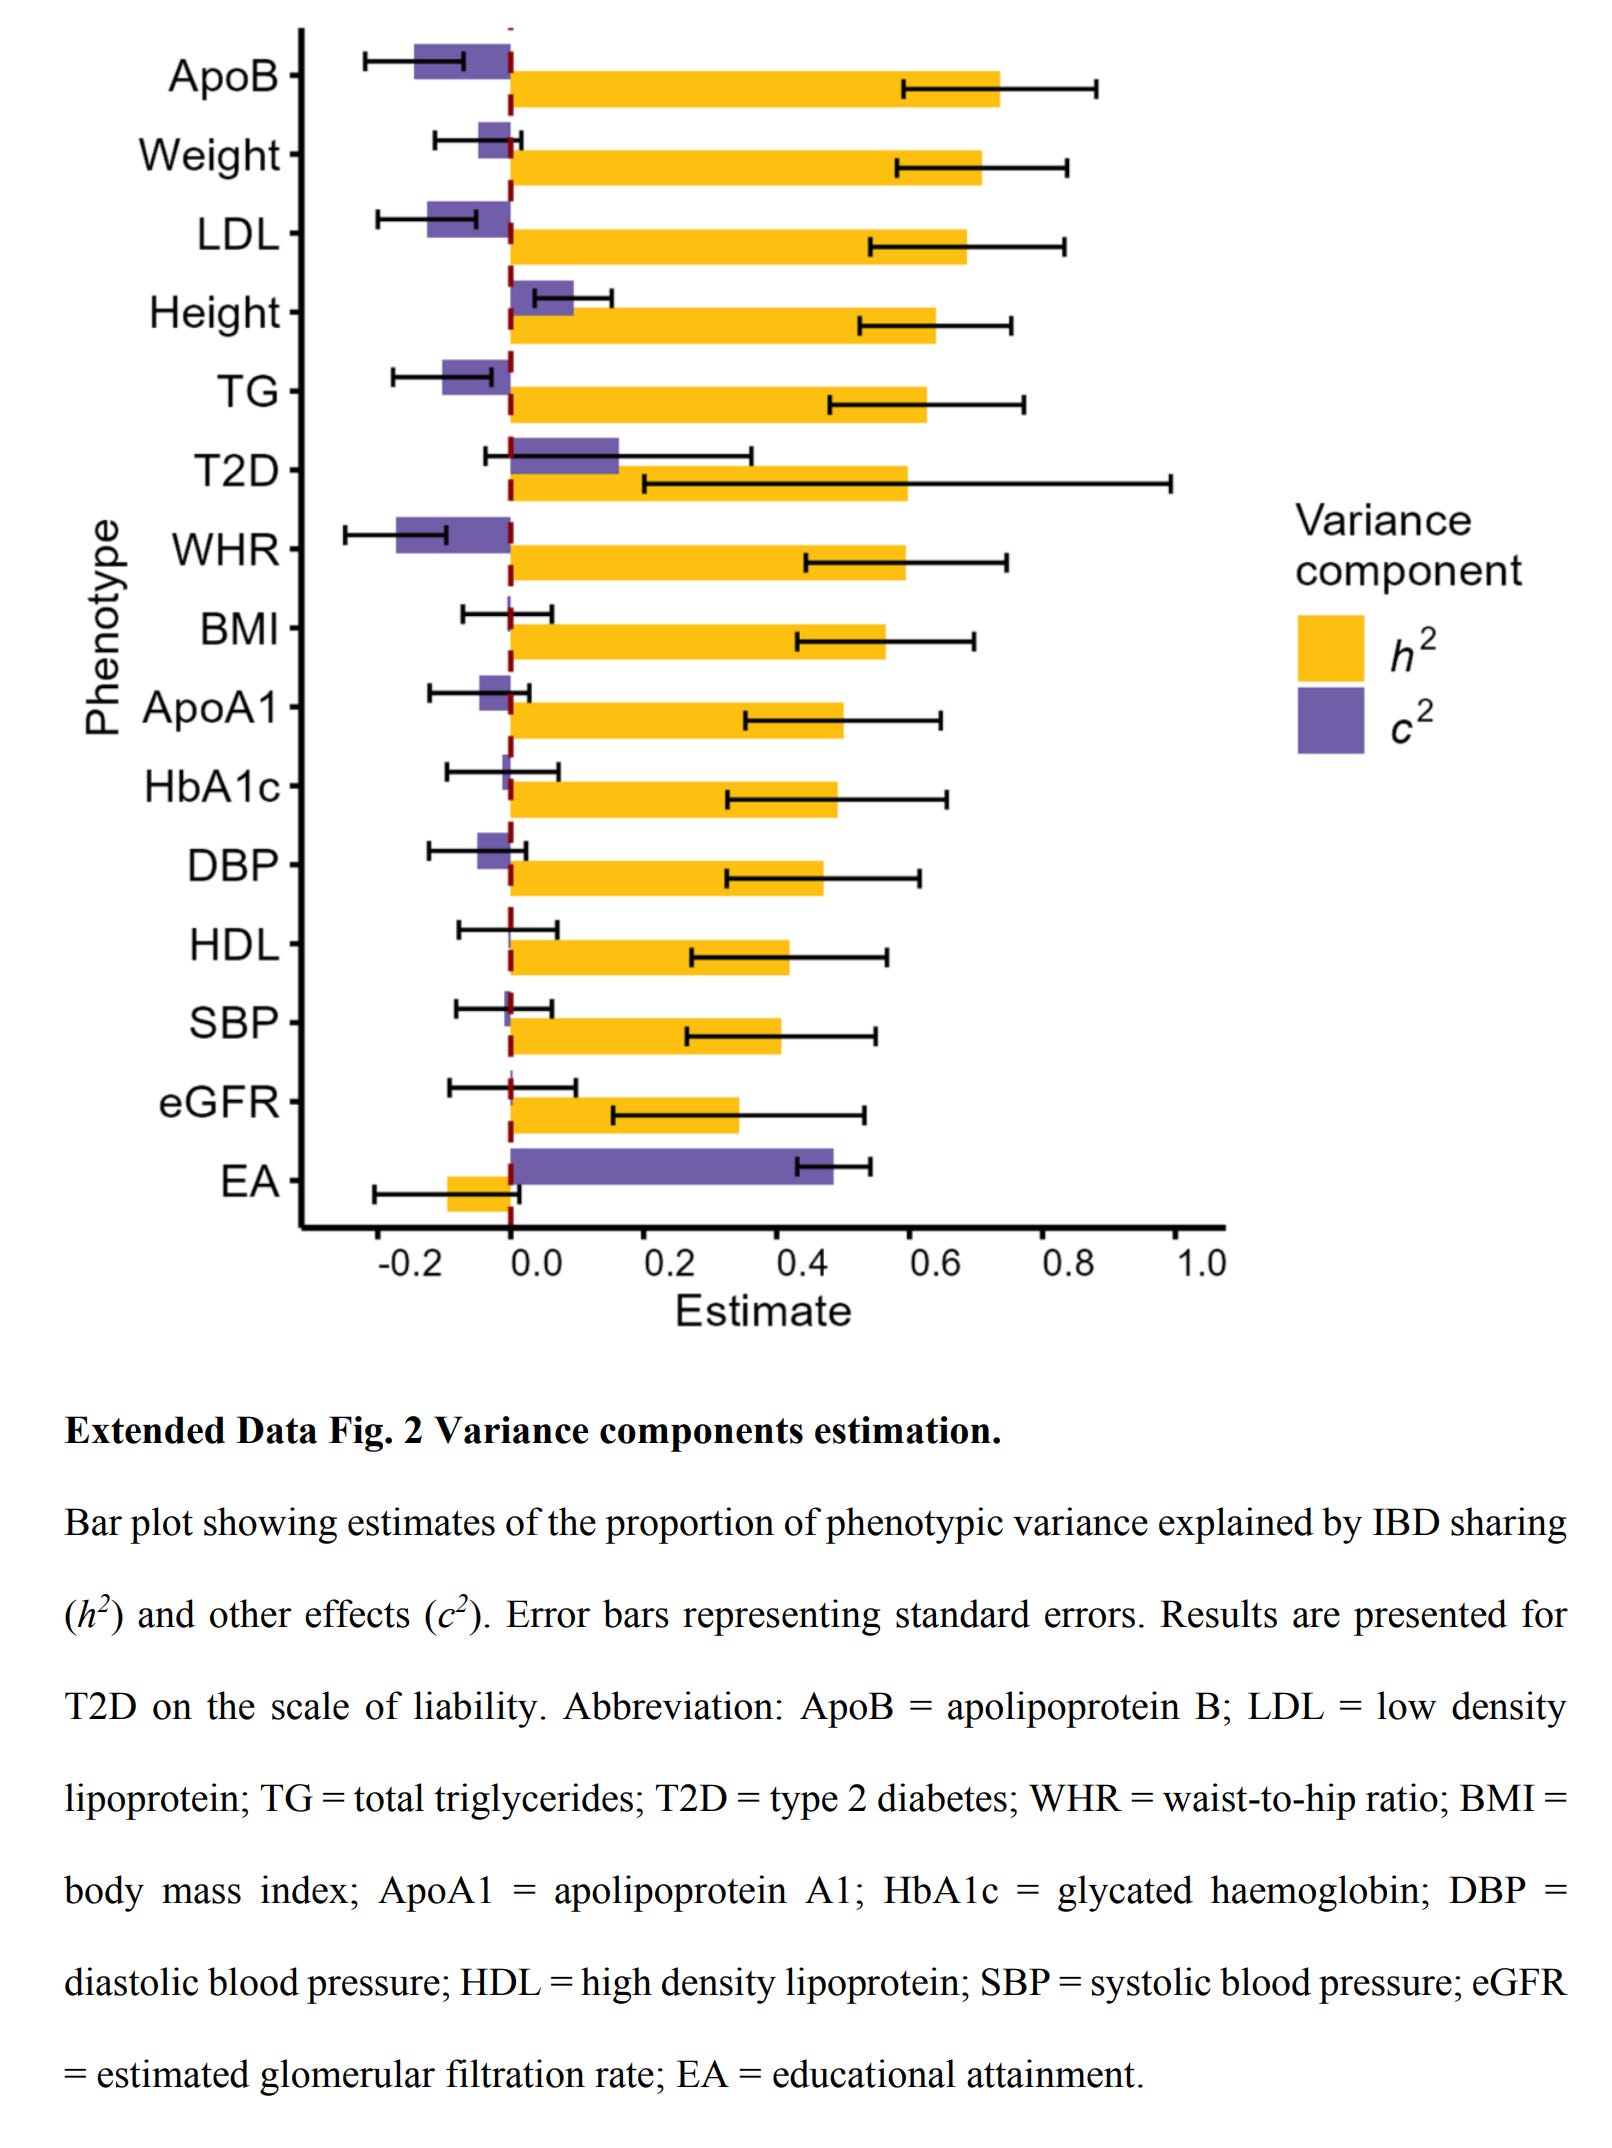
This calls into question their educational attainment measure, at least, in the sibling context. Assortative mating for ancestry was high:
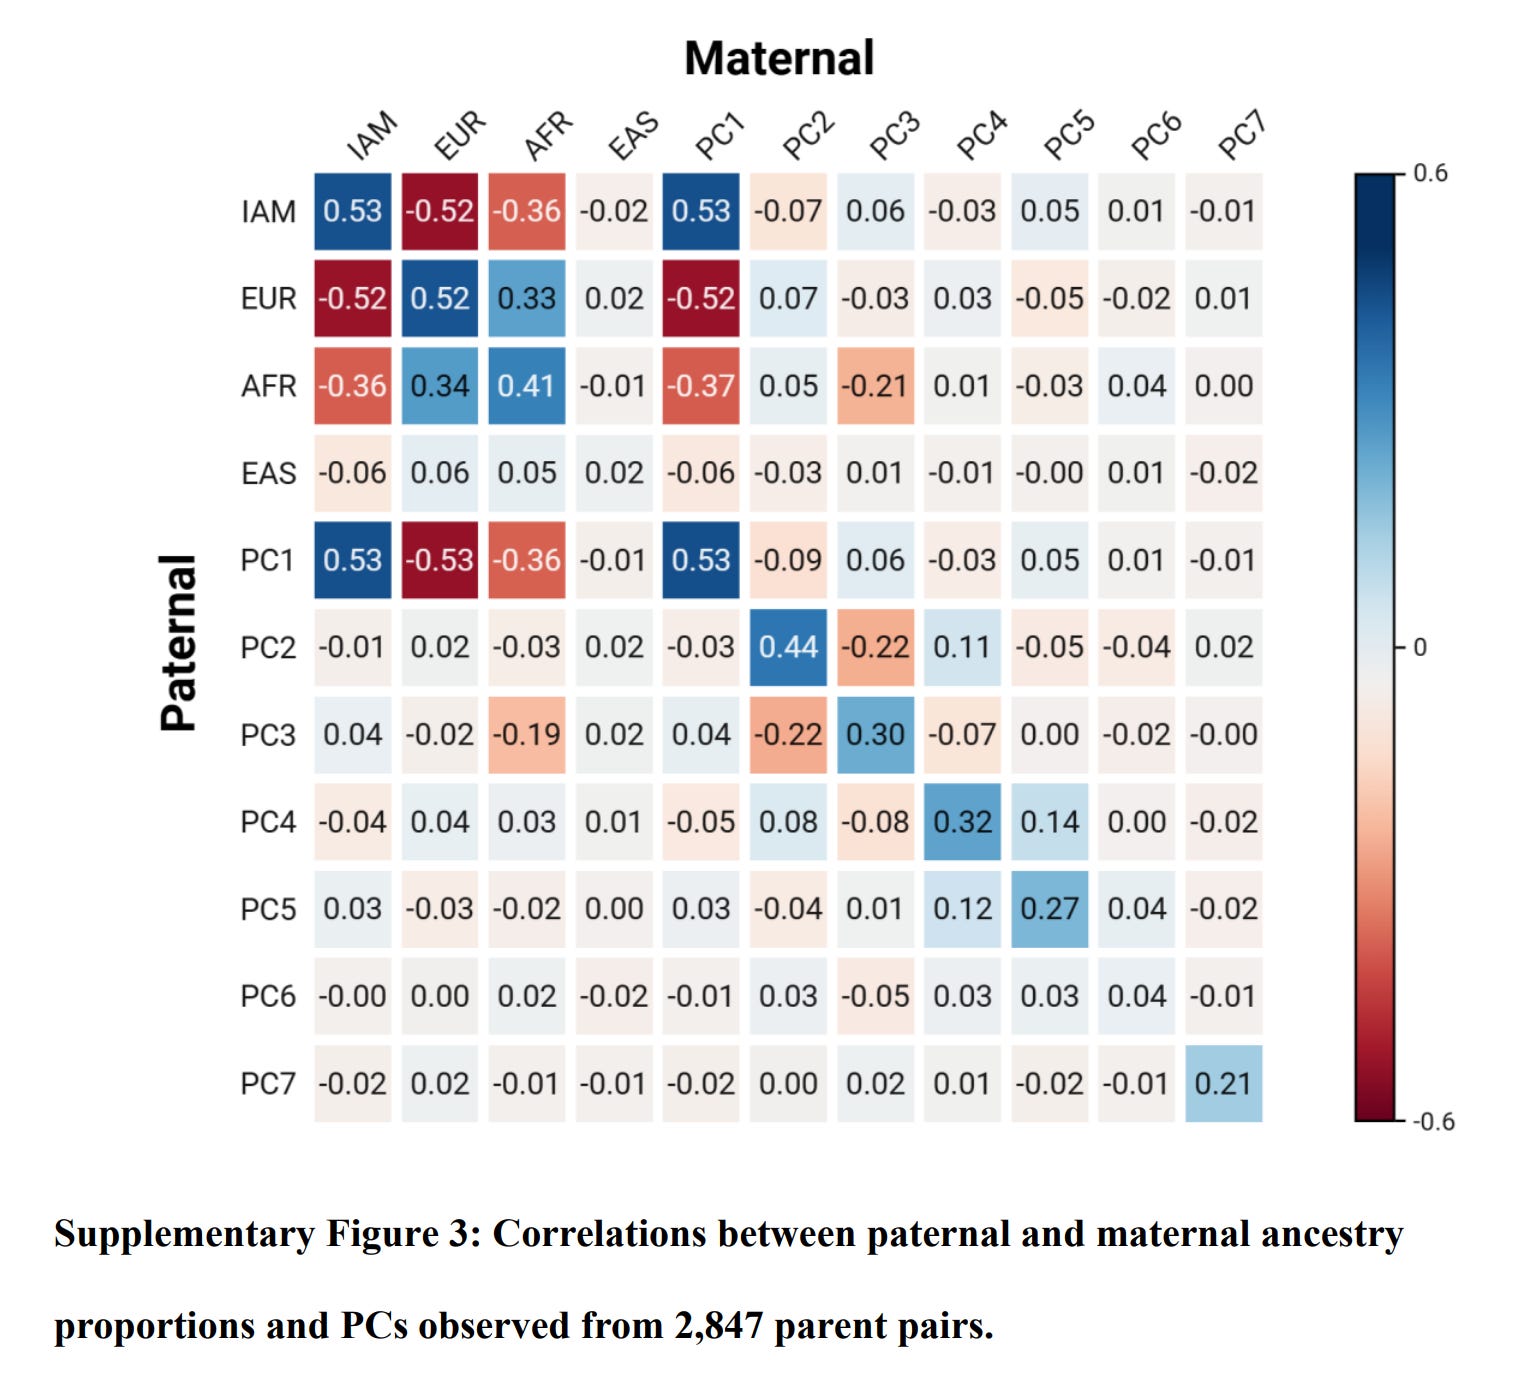
Assortative mating can mess up admixture analysis in some cases because the lower performing ancestry found in higher SES/IQ people will not have the same expected effect as that found in lower performing people. I don't know to which degree this can explain results here. All in all, though, this evidence is in favor of the egalitarian model and against the genetic model.
As a bonus, their supplements also show that I was right to question the perfect reliability of IBD estimates:
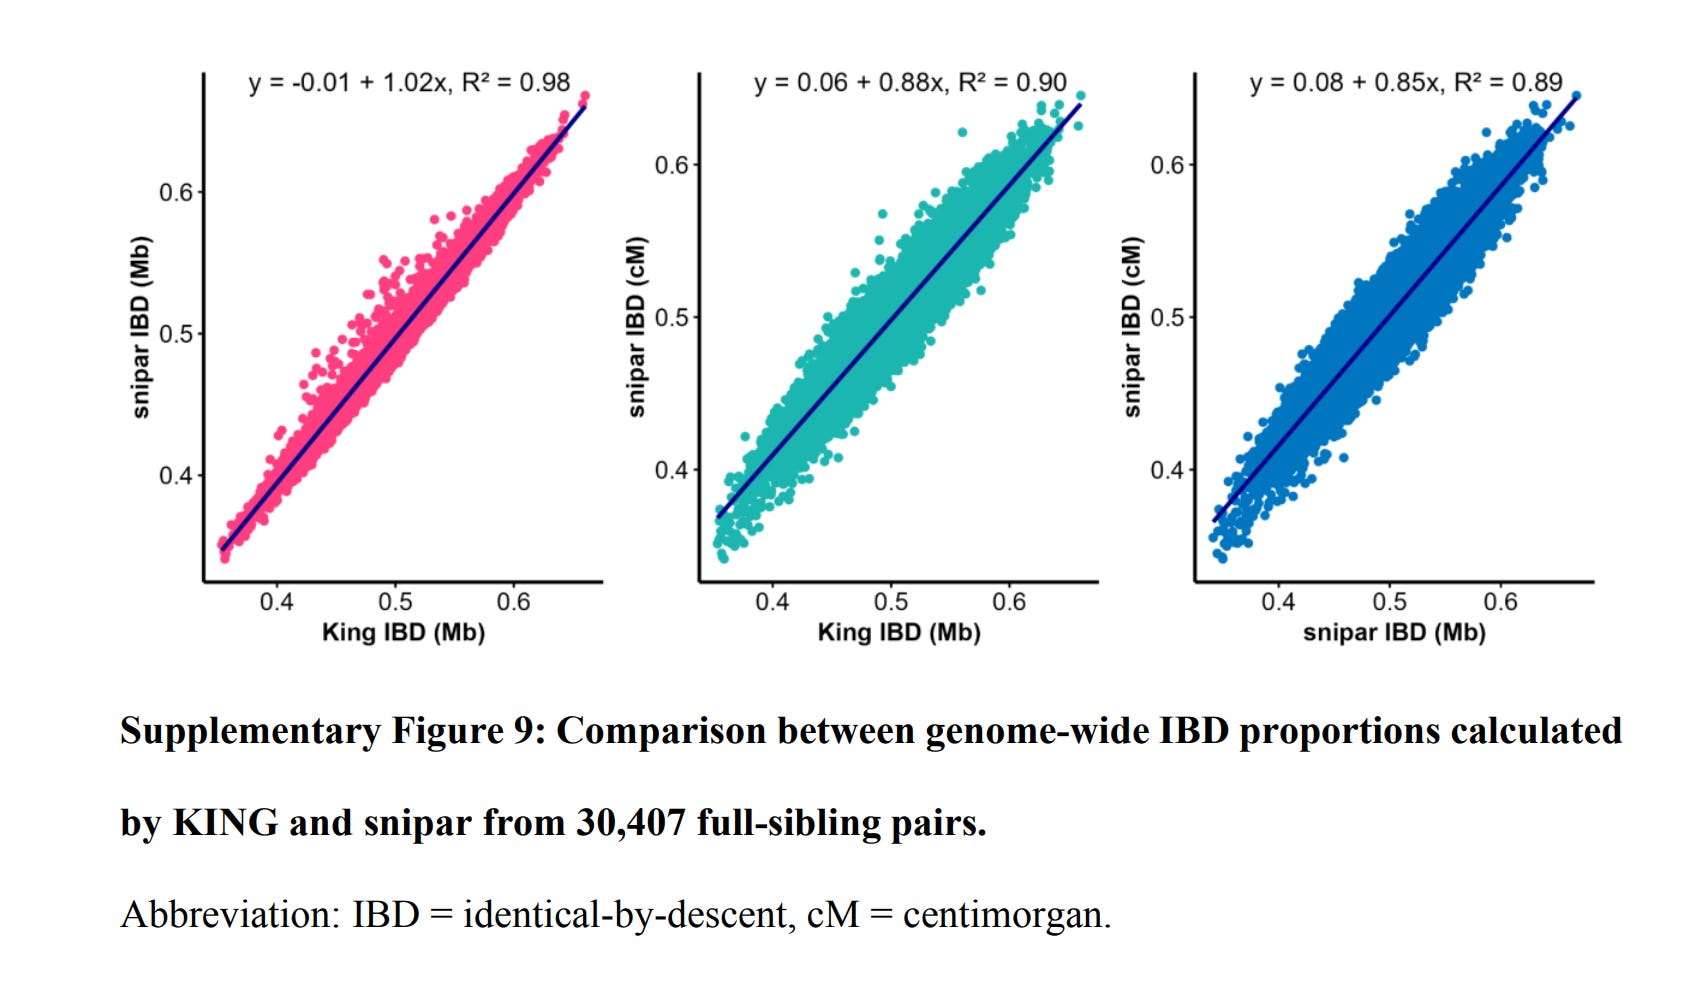
In OLS, random measurement or estimation error in a single predictor usually doesn't affect the slope (but does affect r² and thus correlations). I am not sure what the effect of measurement error is in these IBD regression methods.
Finally, you may wonder, "Why didn't you do this analysis before Emil?". Naturally, because they are hiding the data:
Data Availability
Data from the Mexico City Prospective Study are available to bona fide researchers. The study’s Data and Sample Sharing policy (https://www.ctsu.ox.ac.uk/research/mcps) can be viewed (in English or Spanish). The questions utilized in the study, along with the available study data, can be accessed and reviewed through the study’s Data Showcase (https://datashare.ndph.ox.ac.uk/mexico/).
This term "bona fide researchers" is basically an exclusion term for anyone the people running the dataset doesn't like. It is the same phrasing used for the UKBB. And we know how that works out in practice. UKBB's own Martin Bobrow talks about their censorship regime in this video:
[automatic transcript]
So the resource is as we have been told available to bona fide researchers for health related research in the public interest so what's a bonafide a researcher well that's very light touch stuff it's someone who gives some evidence of being a serious and competent person to conduct this type of research so they've they're in a post with a company or a university or a Research Institute they have some evidence of having published or they are a student being supervised by someone with some evidence of competence and as long as there is enough evidence that they are what they claim to be people who could responsibly use data of this sort and as long as there is some way in which there is a responsible entity that will stand behind them and make sure that they do behave properly and abide by the rules of the game that's taken for granted health-related research is a term that is easy in the huge majority of cases because the majority of people want to use the resource to study disease in one way or another and it's easy to extend that to methodological applications to some aspects of training where it sometimes gets more difficulties where it slides into what would be an example so the anthropological and tripe applications you clearly need to understand population structure to be able to interpret health-related genomic data so you couldn't possibly ban it all but people who seem to be edging towards studies that look at the implications of genetics on race and IQ might be stretching us a bit and we would those would be flagged for further consideration and generally speaking if it wasn't it wasn't a good case for agreeing they wouldn't go forward so provided you tick those two boxes which the huge majority of applications do data applications are simply sent through with the minimum possible fuss
It would be fantastic if the authors could open source some of the data for the regressions. Trying alternative methods does not require the genetic data, just the case level data with estimates for each variable. Of course, all such scientific data should always be public. Right now, not even the study's code is public, even though their preprint links to the Github page (this could be a mistake, or sometimes authors delay open sourcing the code until after publication, thus preventing effective peer review!).
The participants in the study were a minimum of 35 years old and a mean of 50 years old at the time they were sampled between 1998 and 2004. Based on this, the birth years of participants probably range from around 1933 to 1969. During this time frame, there were vary rapid and dramatic increases in the literacy rate in Mexico (https://ourworldindata.org/grapher/cross-country-literacy-rates?tab=chart&country=MEX) that caused a shift from most people being illiterate to most people being literate. I haven't found data on how the timing of this varied regionally in Mexico, but I would guess that there were large regional disparities. Even today, different Mexican states vary quite a bit in average educational attainment (https://wenr.wes.org/2019/05/education-in-mexico-2).
As the Mexico City Prospective Study participants were sampled in middle age in Mexico City, and as a past paper about this study notes, there was lots of migration to Mexico City in the 1950s through 1970s from all over Mexico, especially from the central and southern parts of the country (https://www.nature.com/articles/s41586-023-06595-3). I'm not sure what percent of the study sample grew up in Mexico City, but based on that information, it sounds like there could be lots of participants who grew up in other parts of the country.
The secular increase in education over time in Mexico is clearly environmental, as it is too fast to be genetic. I expect regional variation is due to a combination of environmental and genetic factors (ancestry varies regionally, with generally northern Mexicans having more European ancestry and southern Mexicans having more Indigenous American ancestry).
For the population analysis, if the increases in education over time occurred later in the regions with less European ancestry (I'm guessing this is the case), then you'd expect Indigenous American ancestry to correlate with lower educational attainment, which it does. This would not inherently tell you anything either way about the role of nature vs. nurture in this association, except for the fact that nurture matters enough to cause the temporal changes we see (e.g., from a literacy rate of 39% in 1930 to 83% in 1980: https://ourworldindata.org/grapher/cross-country-literacy-rates?tab=chart&country=MEX).
For the within-family analysis, the temporal trends could be a considerable source of noise. As you note, siblings are only expected to vary by a few percent in terms of their ancestry composition. From 1940 to 1950 in Mexico, literacy rate rose by 1.7% per year. Siblings a few years younger might have significantly higher educational attainment than their older siblings, with an effect greater than you'd expect from their genetic ancestry differences. Of course, in theory this shouldn't confound the model (younger siblings shouldn't have systematically different ancestry composition from their older siblings. Perhaps there could be a sampling bias if initial recruits were more educated and then the recruited siblings were on average older or younger, but I doubt that would be a big effect). However, this extra source of noise would presumably reduce the power somewhat. With access to the data, or some good simulations, perhaps it could be estimated whether this extra noise would lower the power enough to fail to find a within-family effect.
Nice discussion. I am not sure what you mean by the sentence "In OLS, random measurement or estimation error in a single predictor usually doesn't affect the slope (but does affect r² and thus correlations)." Estimation error in a single predictor creates attenuation bias, which biases the coefficient toward zero. The slope is biased toward zero. I agree there are weird things going on with EA in this study. It might be due to the very noisy 4-category measurement?