
The distribution of attractiveness
Lake Wobegon lives

Recently there was a piece on ISF about this by 'Alexander' AKA. datepsych on Twitter: Is Physical Attractiveness Normally Distributed?. Basically, he takes the OKCupid results and thinks these show the way things are. Pompous and lazy, typical of broscience. One can see immediately why OKCupid data might not be the best way to study distributions of attractiveness:
People on dating sites are not representative. Men with good social skills pick up girls from bars, not from chat apps. So they tend to be absent from them, driving the average down and maybe changing the distribution.
Of the above, OKCupid has about 2/3 men, and it's of course tilted towards younger people. It's possible that age is a big confounder so that it is only in younger men that there is a pronounced sex difference.
So let's look at some more datasets. I spent a few hours looking around. There aren't a whole lot of papers that plotted the distributions of ratings that I can find and a Google Image search mostly just finds OKCupid data plots, but there's a lot of studies that gathered such data. Unfortunately, most such studies didn't share the data, or didn't use symmetrical designs. For instance, many studies had male students rate female students, but not the other way around. Obviously then, we cannot compare men and women in such data.
After some looking around, I found that several large standard datasets have interviewer rated attractiveness. This is decent because it's a person who doesn't know the subject so cannot be biased by any personal relationship. On the other hand, most people only receive a single rating, which gives low reliability. Worse, depending on how fine-grained attractiveness was measured, the data might be suboptimal for comparing distributions. The central two claims by Alexander are that 1) women are more attractive, and 2) the male distribution is decidedly skewed with a long tail of attractive men. Here's how the OKCupid ratings look like:
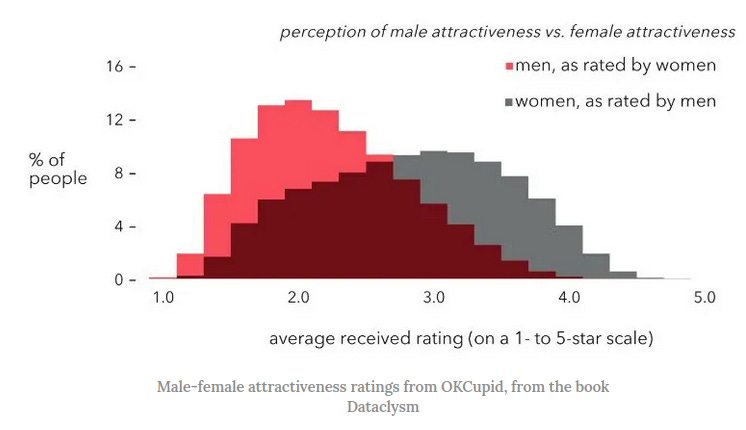
This dataset is also used by the incel.wiki. Really you should click the link, it's an amazing collection.
Some useful datasets I found:
General Social Survey (GSS), USA
NLSY Add Health, USA
Wisconsin longitudinal study (WLS), USA
German General Social Survey (ALLBUS), German
I'm sure there's more, but I got consistent results, so I didn't look further. Let's take them in order.
General Social Survey
There is only one variable about this (RLOOKS), only given in two years and suffering from being 1-5 scale.

The distribution looks like this for all ages:
And for prime age, which I here arbitrarily define as 20-30:

Both show a female advantage, but the skew is in the same direction: towards more attractive than 'average', seemingly a statistical impossibility. The gaps are not impressive: 0.14 d for the full sample, and 0.18 d for the younger sample.
Add Health
This survey is better because it is a longitudinal sample where the same subject was interviewed so far 4 times. Each time of interview had interviewers rate the individual on a 1-5 scale. Documentation says:

This is the one from wave 1, but the others are about the same.
First, we check whether the ratings actually correlate much with each other:

The correlations are decidedly unimpressive. Running a standard intraclass correlation (ICC) shows that the average rating obtains a reliability of 0.48 (average random raters), which this guideline calls "poor". In other words, people don't seem to agree much who is attractive and who is not. At least, not when they are rating the same person multiple years apart.
Still, they can be reliable enough to look at a distribution, so let's do it:

This is for all ages combined as the different surveys were given at different ages, but all of them before 40. On the 1-5 scale, women score 0.15 higher, which is d = 0.29. As the reliability of the variable is quite poor, we can correct this for measurement error using a latent variable approach. I used lavaan. From doing this I got d = 0.45, which is a decent advantage. Like before, we also see that most people are rated above 'average'.
Wisconsin longitudinal study
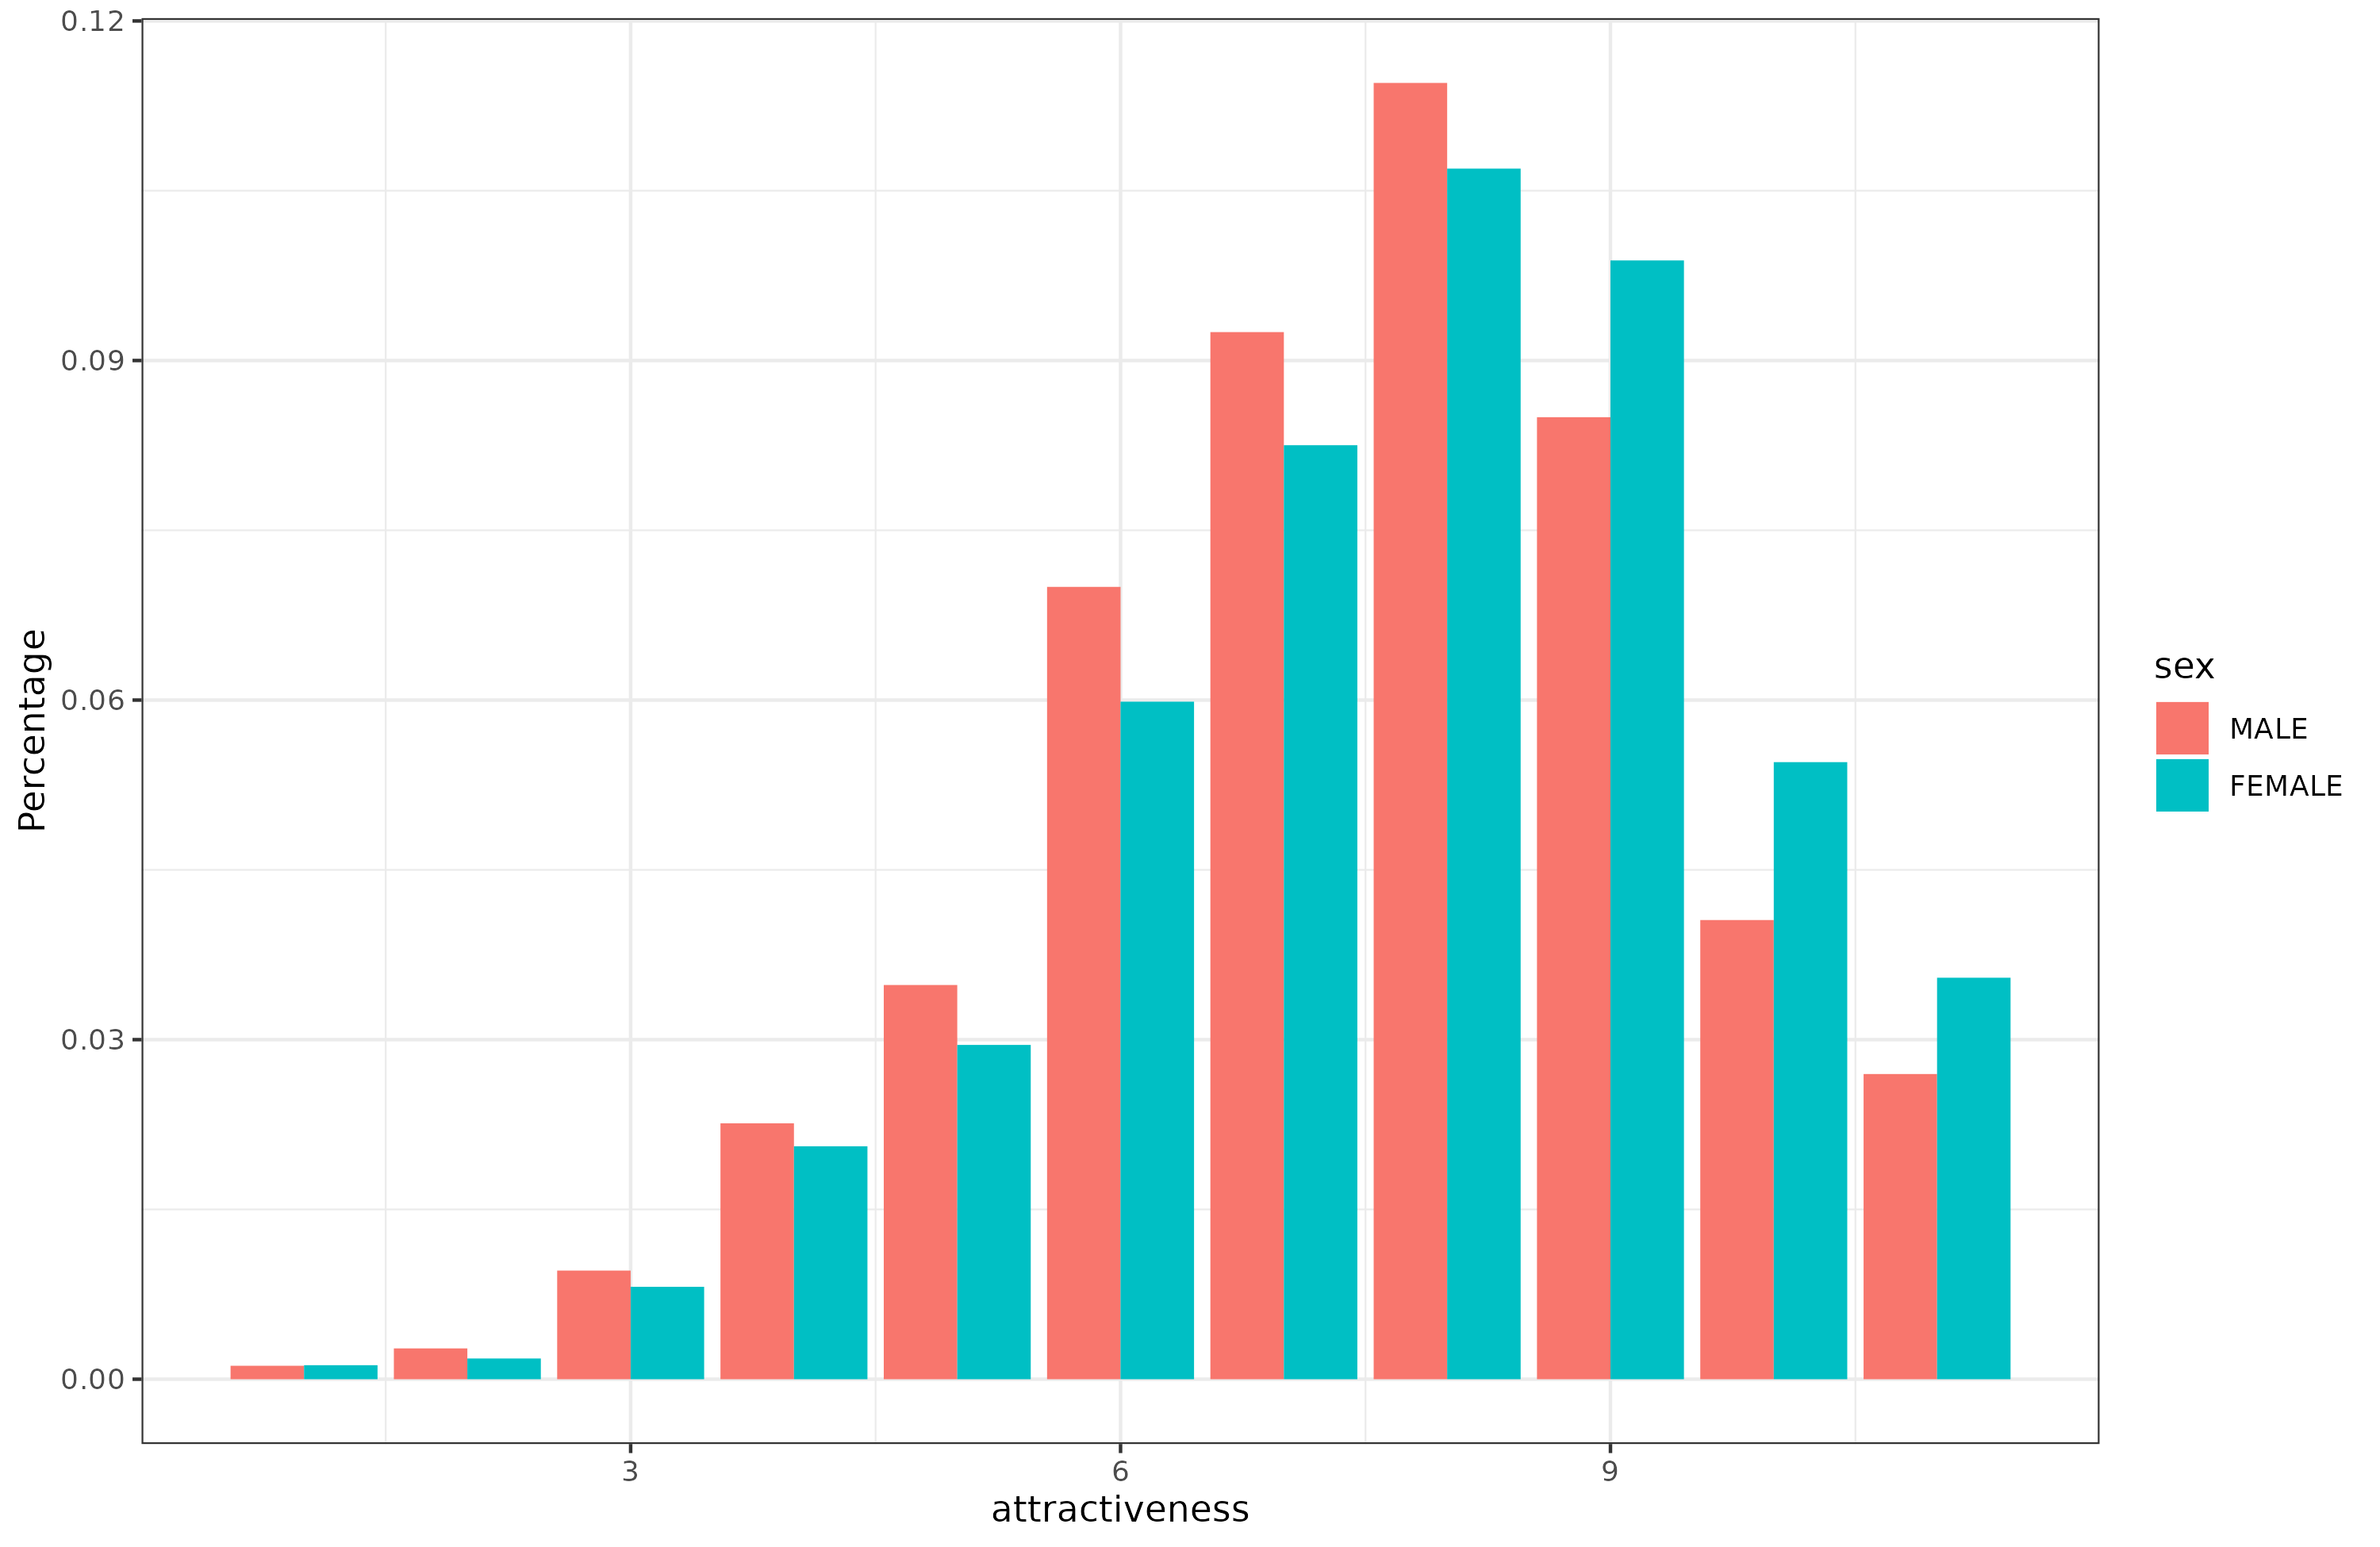
These people were very old when studied. As far as I can tell from the documentation, they were approached again in their 70's and only at that time rated by the interviewer:

Strangely, there is no "9" on their 0-10 scale. Looks like this:

Numerically, women scored 0.08 higher on the 0-10 scale, which is d = 0.07. As people were only rated once, I cannot adjust for reliability. Like before, most people are rated above average.
German General Social Survey
This is similar to its American counterpart, but ratings were on a 0-10 scale, and each person is only rated once. There is data for many years, bringing the sample size to over 20,000. Overall, for all ages, it looks like this:
And for the younger adults, 20-30:

We replicate the skew as before, and some female advantage. The female advantages are: 0.14 d for all ages, and 0.31 for young adults. Since this dataset is so large, we can also compute the sex difference by age continuously:

The difference doesn't really follow what one would expect from evolutionary psychology. Yes, we expect younger, fertile women to be higher, but why are women aged 60 still enjoying an advantage? The difference only goes away at age 75+.
Conclusions
Large-scale ratings of physical attractiveness correlated only weakly across years when rated by survey interviewers.
Women enjoy an advantage, probably starting in teenage years (no data here) until about age 75. The sizable of the advantage is somewhere between 0.15 and 0.50 d. Only one study had ability to correct for measurement error, and that produced d = 0.45. Maybe a lot of this difference is due to make-up, which would be an example of culture making an existing natural difference larger. Try looking at women with and without make-up to convince yourself of this hypothesis.
Most people are rated as above average attractiveness, not below average. It appears if one wants to be 'below average' looking, one has to be deform or really try hard at it (blue hair, face tattoos, piercings, morbidly obese etc.). This is somewhat of a white pill for those men who are currently failing to get a girlfriend. The problem is mostly not your looks, but your behavior. You can improve this.

Here's an article about a study where people of the opposite sex rated each other's attractiveness and where the rating average and distribution are much closer than on OkCupid, even though men are still generally rated a bit lower:
https://www.lesswrong.com/posts/X3jz5mriJeWi2uLdF/how-subjective-is-attractiveness
One caveat is that all the participants in this study were Ivy League students and graduates and therefore not completely representative of the general population. Prior to rating, they also had a brief in-person interaction with the person they were about to rate, which could have made the more agreeable people in the sample less inclined to give a harsh rating. Still, it confirms that photo ratings can be quite different from how people rate in real life.
Is it really a white pill for some men to know that their problems are due to their behavior rather than their looks? How easy is it to change your behavior rather than looks? If you have money, the latter seems far easier due to the amount of and continuous progress in beauty products. Boosting your physical attractiveness seems easier than boosting your cognitive/psychological/psychometric/behavioral attractiveness. Didn't mean to be a killjoy. Great article. Sad that there seem to be no giant, comprehensive, longitudinal surveys of male and female attractiveness, where massive numbers of people across races, ethnicities, SES, etc. rate themselves and everyone else on countless different attractiveness scales across numerous points of time with and without make-up and all other beauty products. It would be an amazing study. The boost offered by expensive personal stylists and the like in the case of celebrities is probably huge, but currently unknown. The same with regular beauty products for regular people, especially women. Would be interesting to know whether female beauty products work on men as well. I assume that they won't work as well or even at all since it would strongly signal a gay vibe, but who knows. Maybe some do since there are so many different ones.