

Some days ago I posted a new US political ideology test on X. It went decently viral and currently has collected about 28k first time completions. You can find the test here and explore its correlations here. Since many people on X are asking about the test, this post serves to clear up some misconceptions.
First off, as AI wrote in the test description:
Political opinion is usually summarised as one line from left to right, and that line is real: Americans’ views on guns, welfare, abortion, race, immigration and defense all move together. But they do not move in lockstep. A factor analysis of 83 policy questions from the 2024 American National Election Study finds eight distinguishable dimensions, six of them strongly tied to the left–right axis and two — distrust of government and the wish to hand decisions to experts, business leaders or referendums — largely independent of it.
This test asks every ANES question that belongs clearly to one of the eight dimensions — 73 in all, in the ANES’s own wording — and scores you against the ANES respondents, weighted to represent US adults. A question that bears on two dimensions counts toward both. For every dimension and for the overall left–right score you see where you fall among all Americans and among self-identified Democrats, independents and Republicans, with the three parties’ distributions drawn on top of each other. The overlap is the point: on most single issues, a fair share of Republicans sit left of the median Democrat and vice versa.
The overall left–right score is a single factor fitted through all 73 questions: the one dimension that runs through the eight, scored directly from the items. In the ANES it correlates 0.80 with respondents’ own liberal–conservative self-placement and 0.77 with party identification. The questions are American; non-Americans can take it, but the norms describe where Americans stand.
So we begin with the 2024 wave of the ANES survey. It had 83 policy questions that we could factor analyze. Now, the thorny question in the years of latent variable modeling is how to determine the factor structure of some dataset. There are many methods for this: Kaiser’s criterion (eigenvalue > 1), MAP, model fit indexes and so on. The most popular is the parallel analysis. In this method, we simulate random but similar data at the same sample size and check their distribution of eigenvalues. We repeat this a number of times to get a distribution. Then we extract and keep all factors that exceed that value. For a very large dataset such as ours, this would mean keeping a large number of factors. First, the dataset correlations look like this:
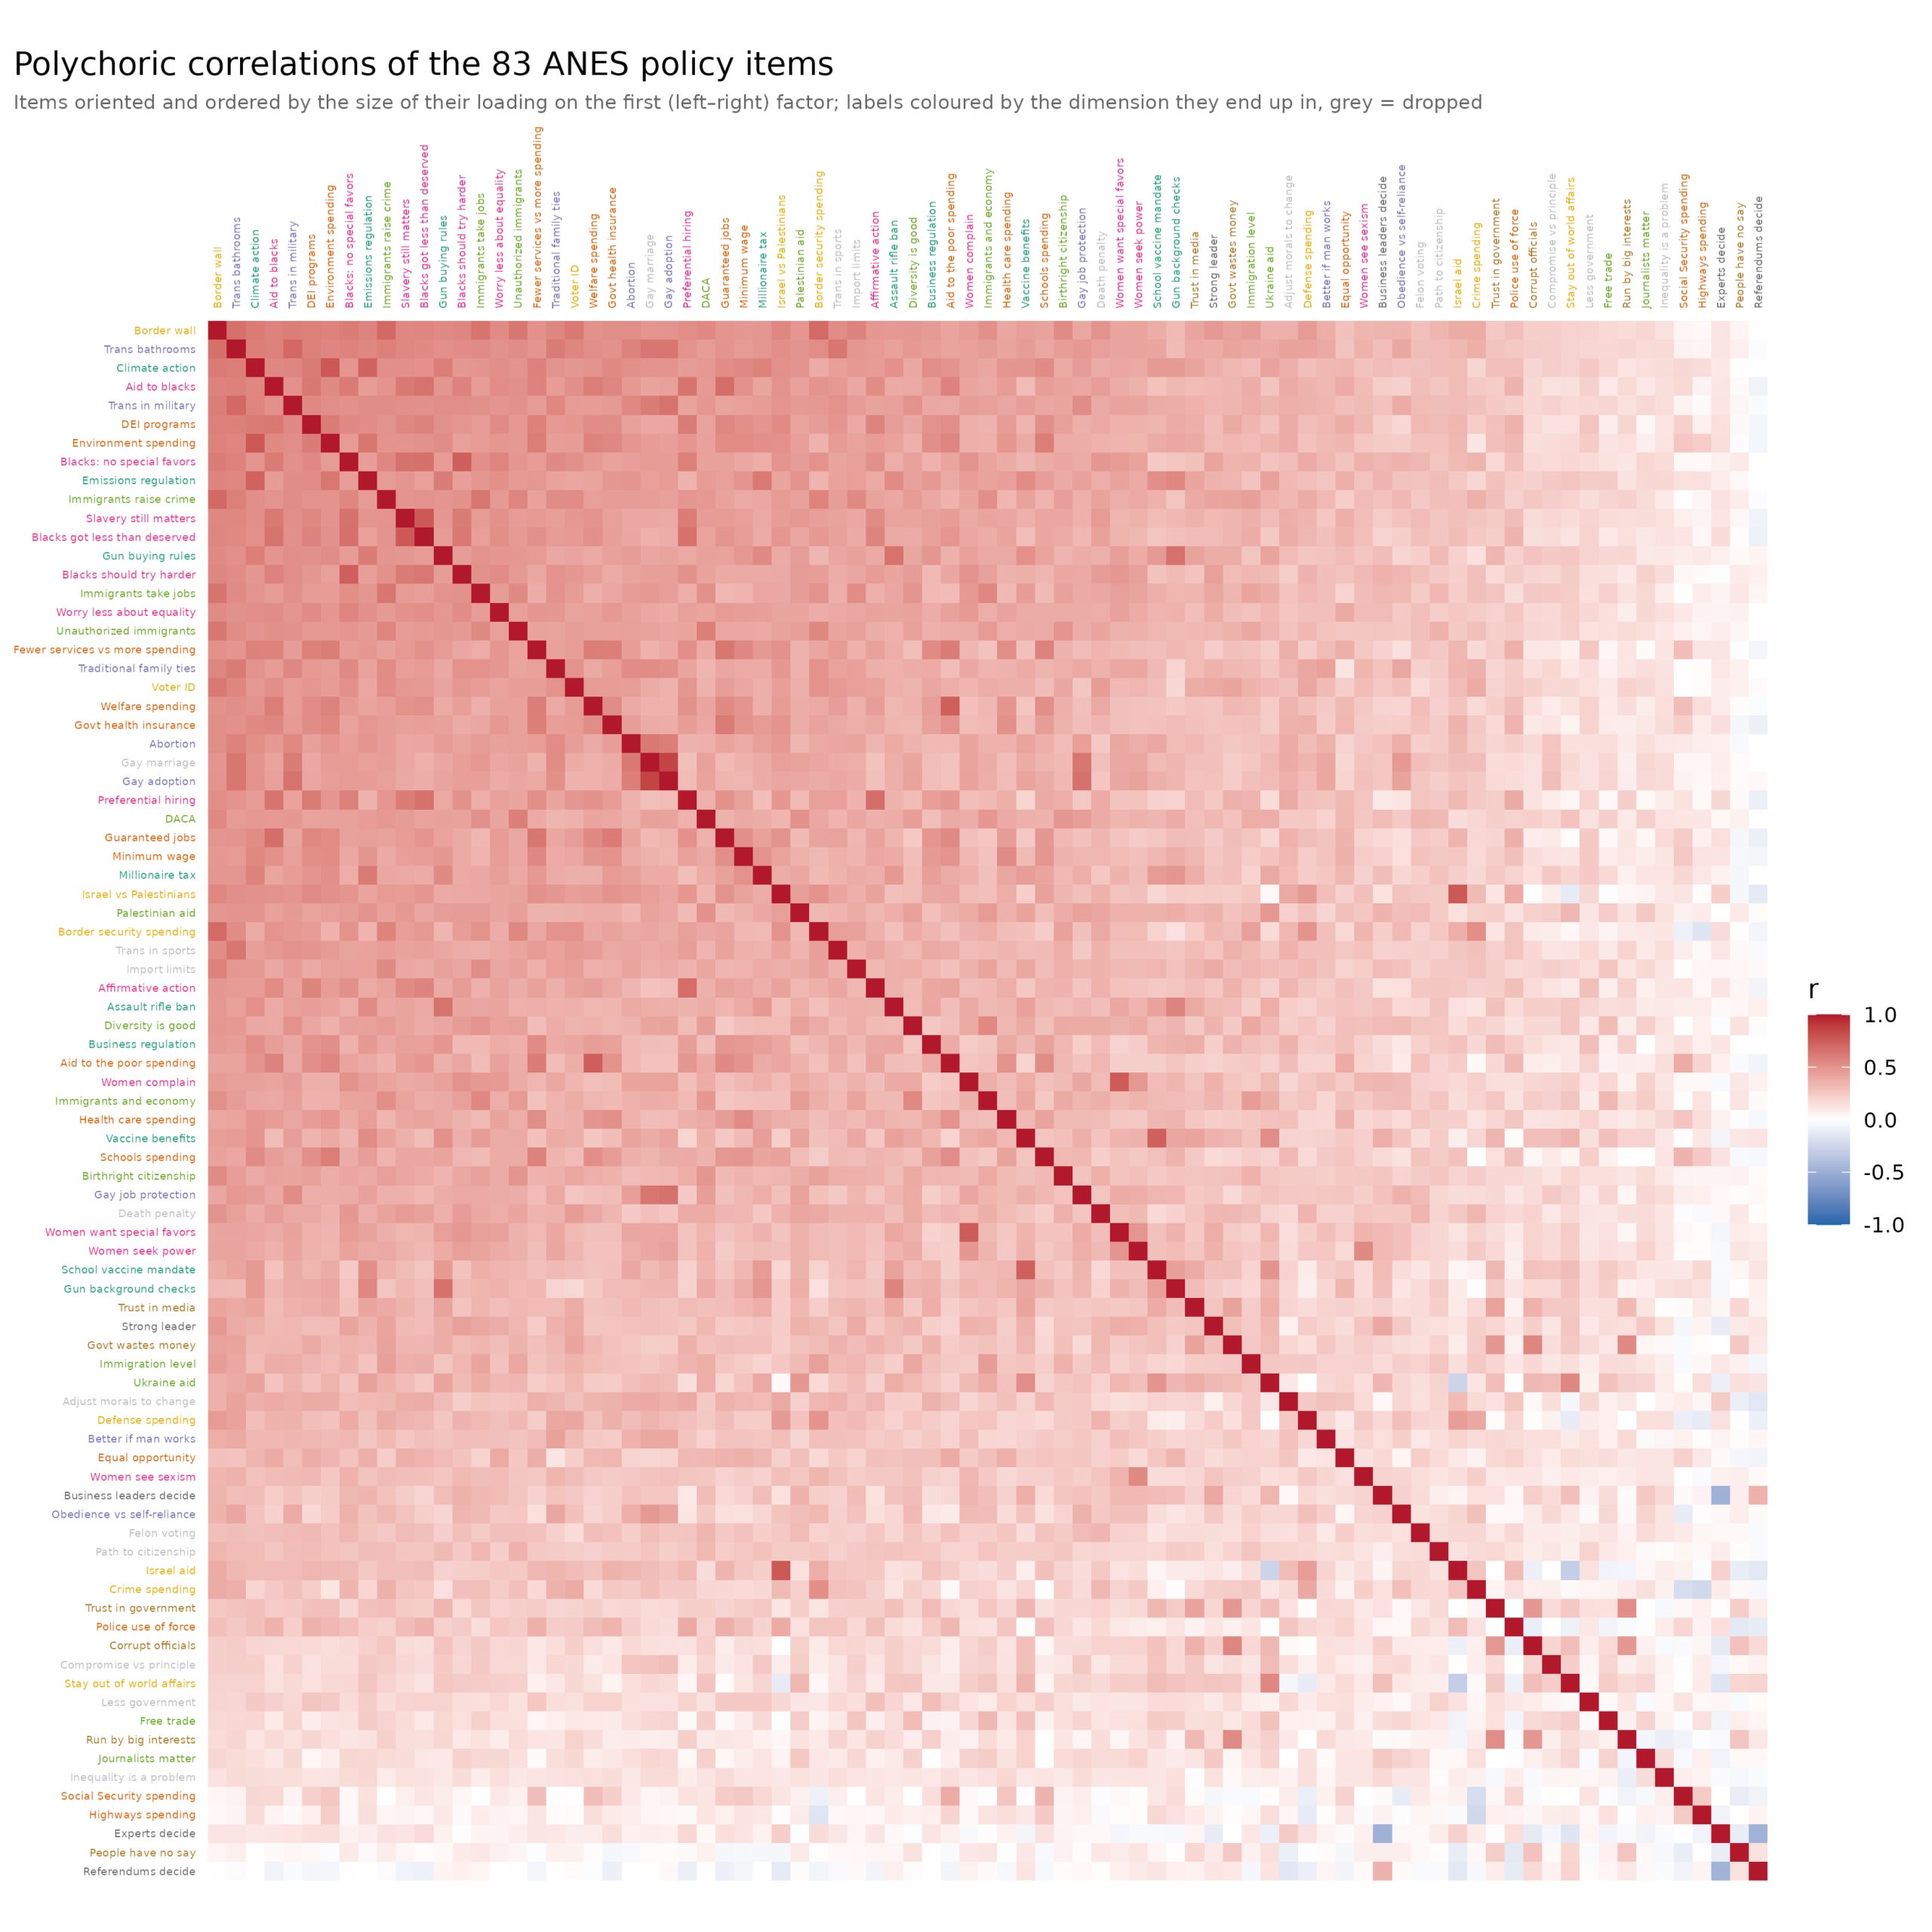
Items are turned so that higher is the right-wing direction if any. This is because otherwise it would be more difficult to discern the overwhelming fact of such a dataset, namely, that most but not all questions load on a general factor. In intelligence data, this would be g, in political science, it is the left-right axis, which we would call leftism or conservatism depending on the direction and chosen framing. Applying parallel analysis to the ANES data we get this:
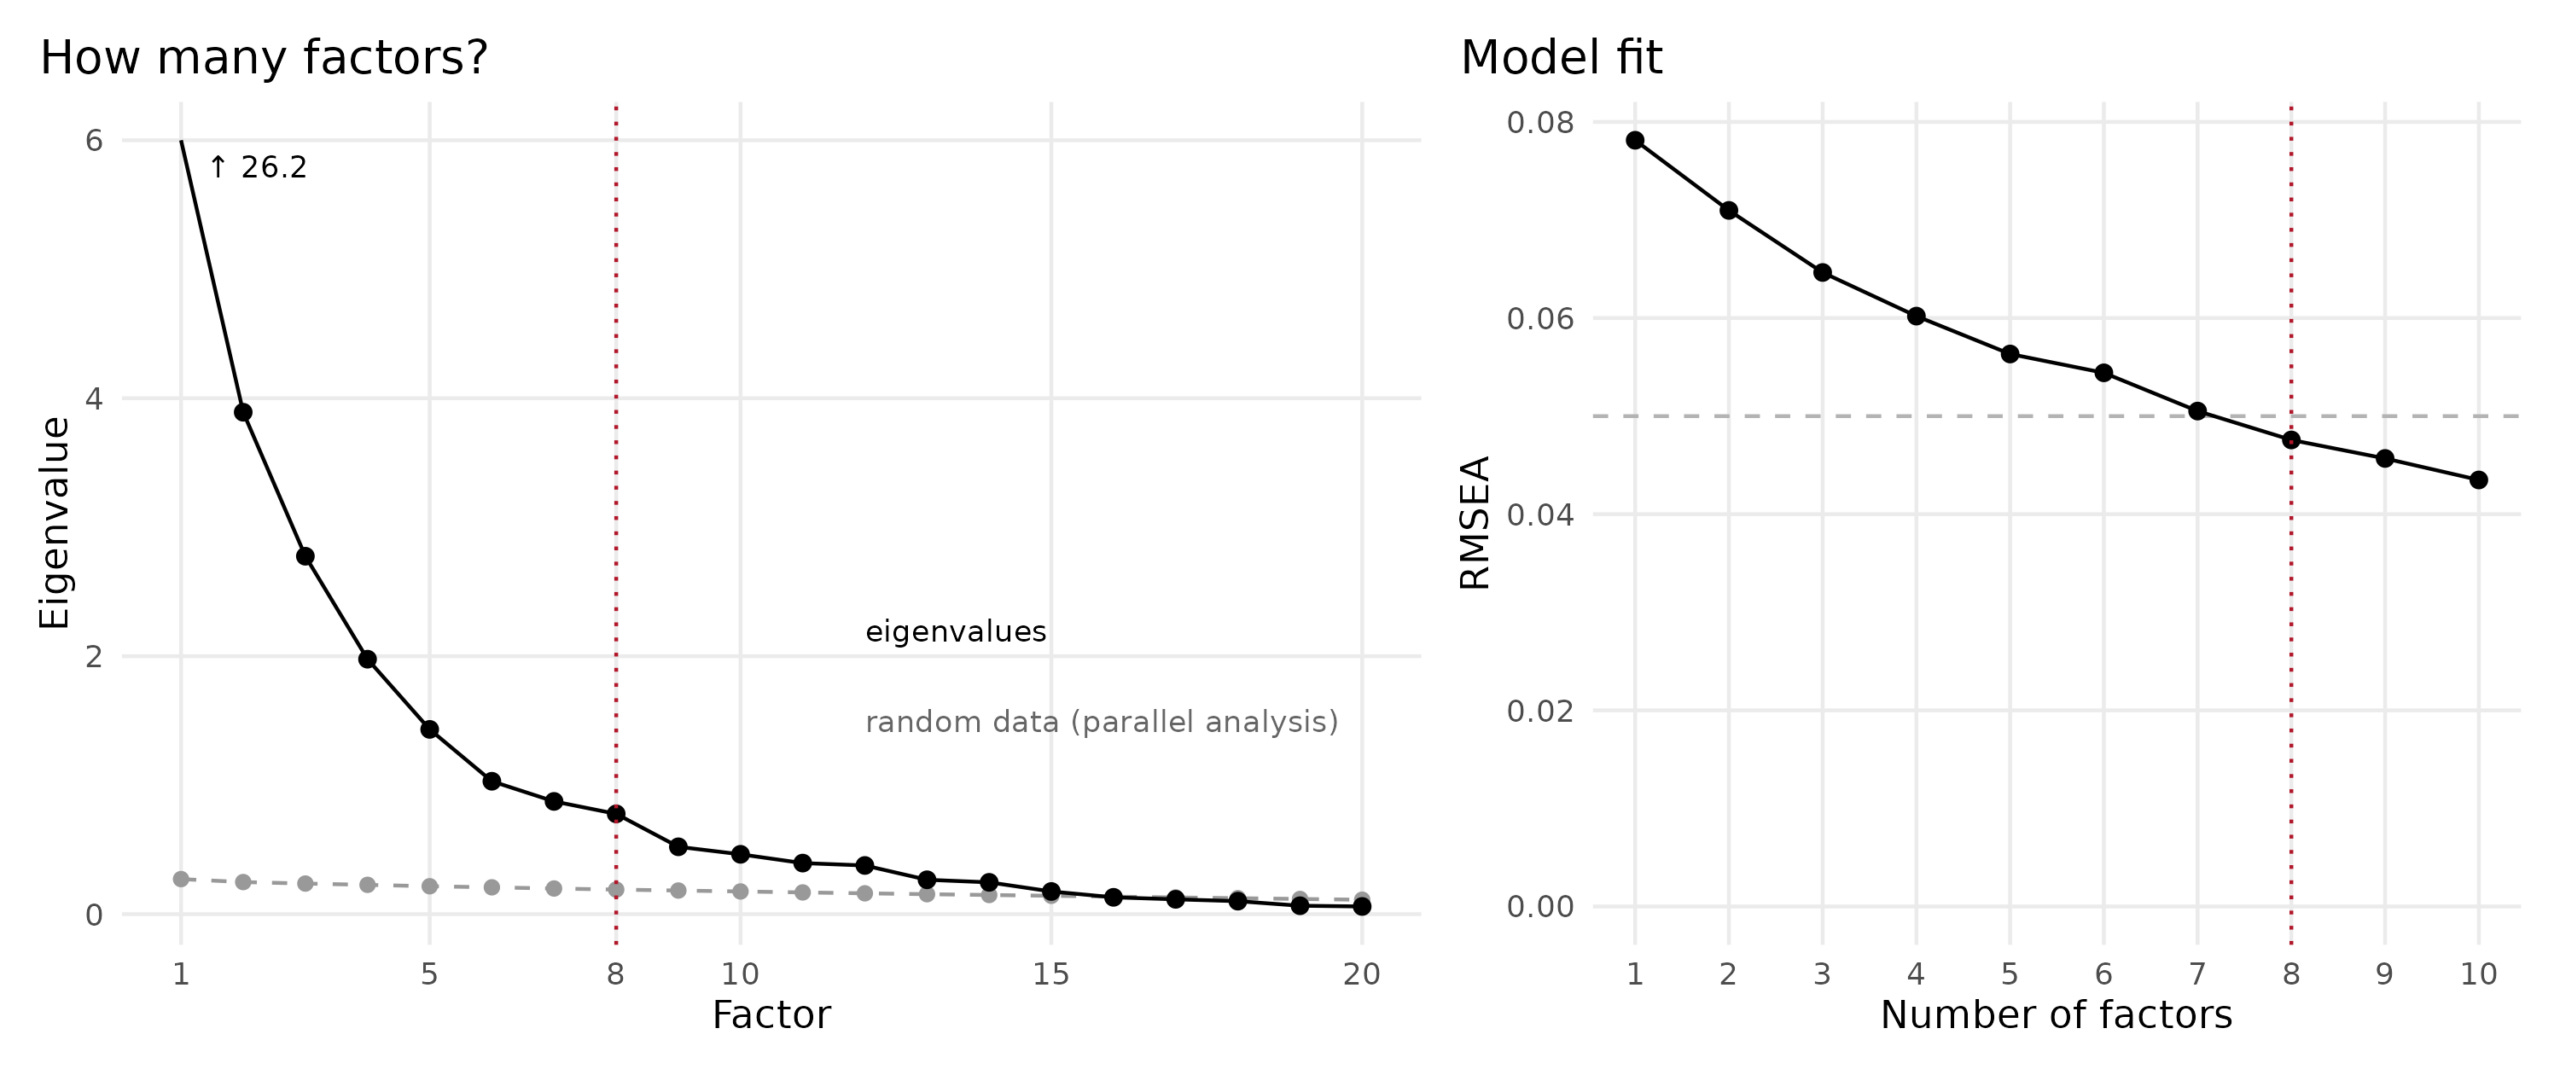
So parallel analysis tells us that the dataset can support about 15 factors. Model fit via RMSEA also shows that adding more factors does better. However, for practical purposes, we may not want just about any factor that can be seen. Even if they can be extracted, it does not mean they are meaningful or stable. So in my case, I decided to also require factors to be based on at least 4 items with salient loadings of >0.30. If not enforced, one can easily get factors that result from just 2 questions, which may just be oppositely worded repeats. One could have done this analysis differently and ended up with more or fewer factors. For instance, in the k=10 solution, race & gender grievances split into their race and gender parts, which may be important in some edge cases. In the appendix, there’s a bass-ackwards plot for those very interested. Anyway, based on my preferred 8-factor model, 74 items had a salient loading, 3 did not and were dropped, and 1 more item was dropped because of missing data (it was a near duplicate anyway). Of the remaining 73 items, they load like this:
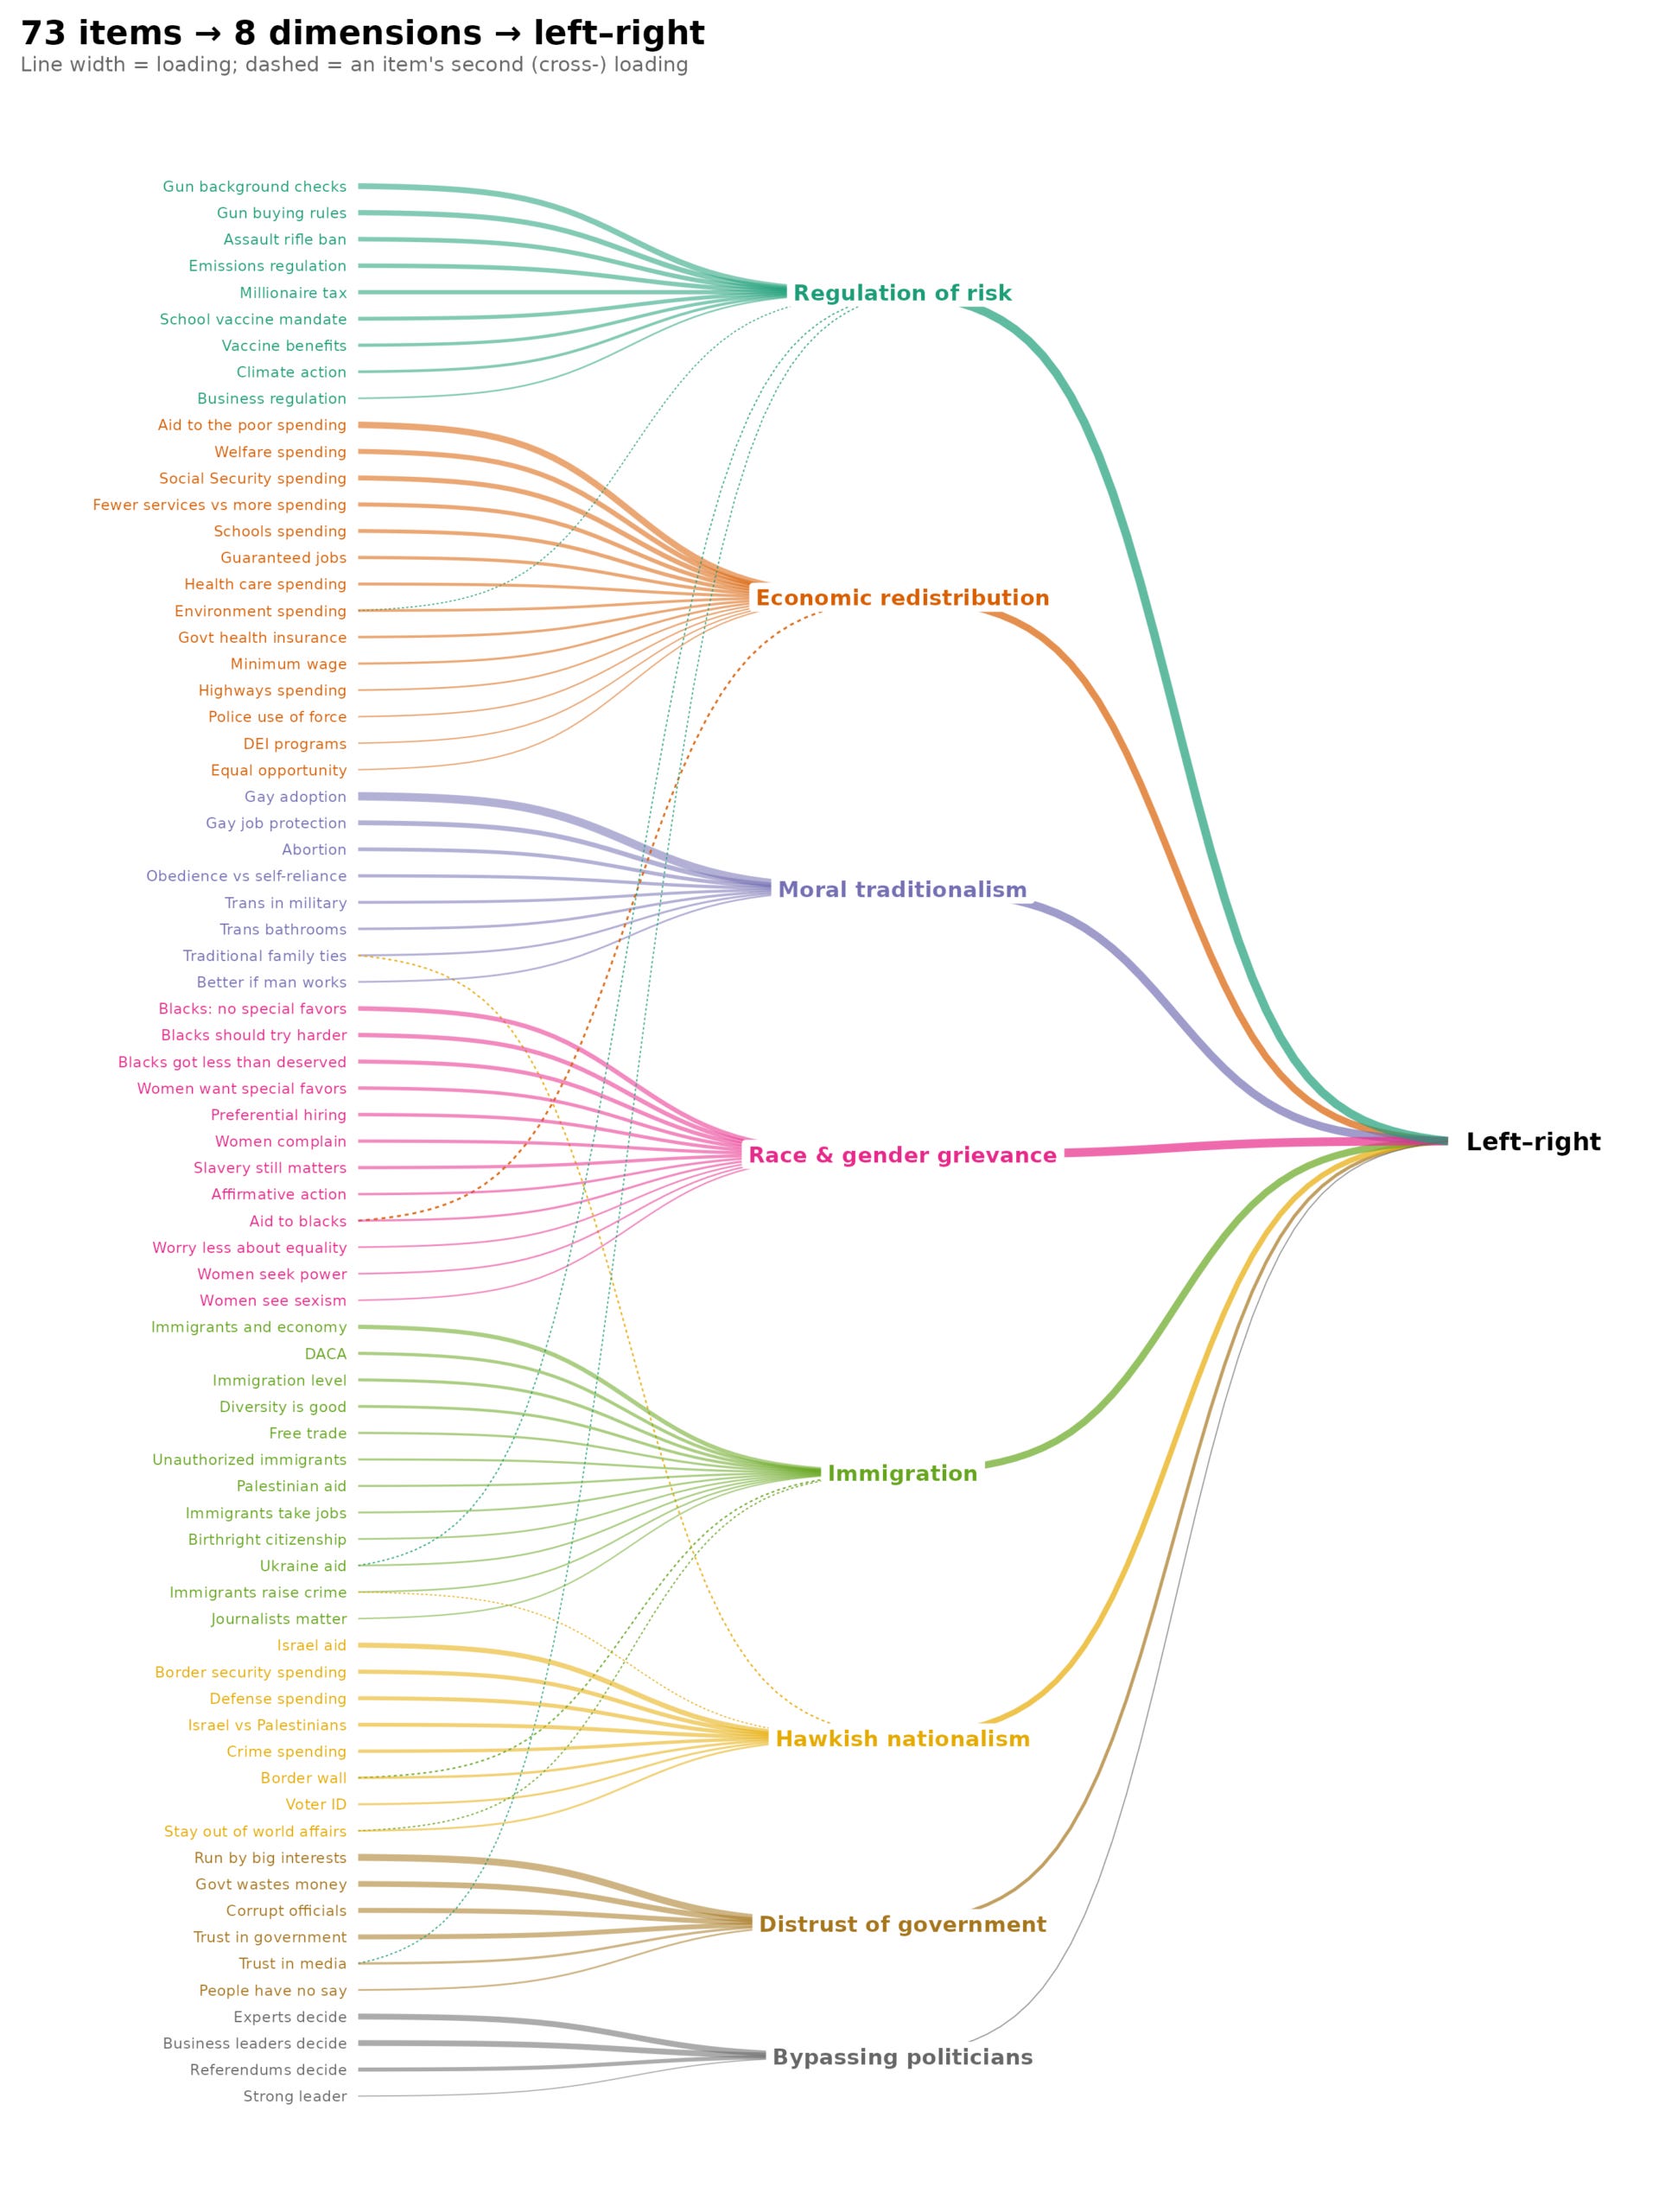
These factors are themselves somewhat correlated, so one can factor analyze them again to get the second order general factor as in hierarchical factor analysis in intelligence. Their factor correlations are:
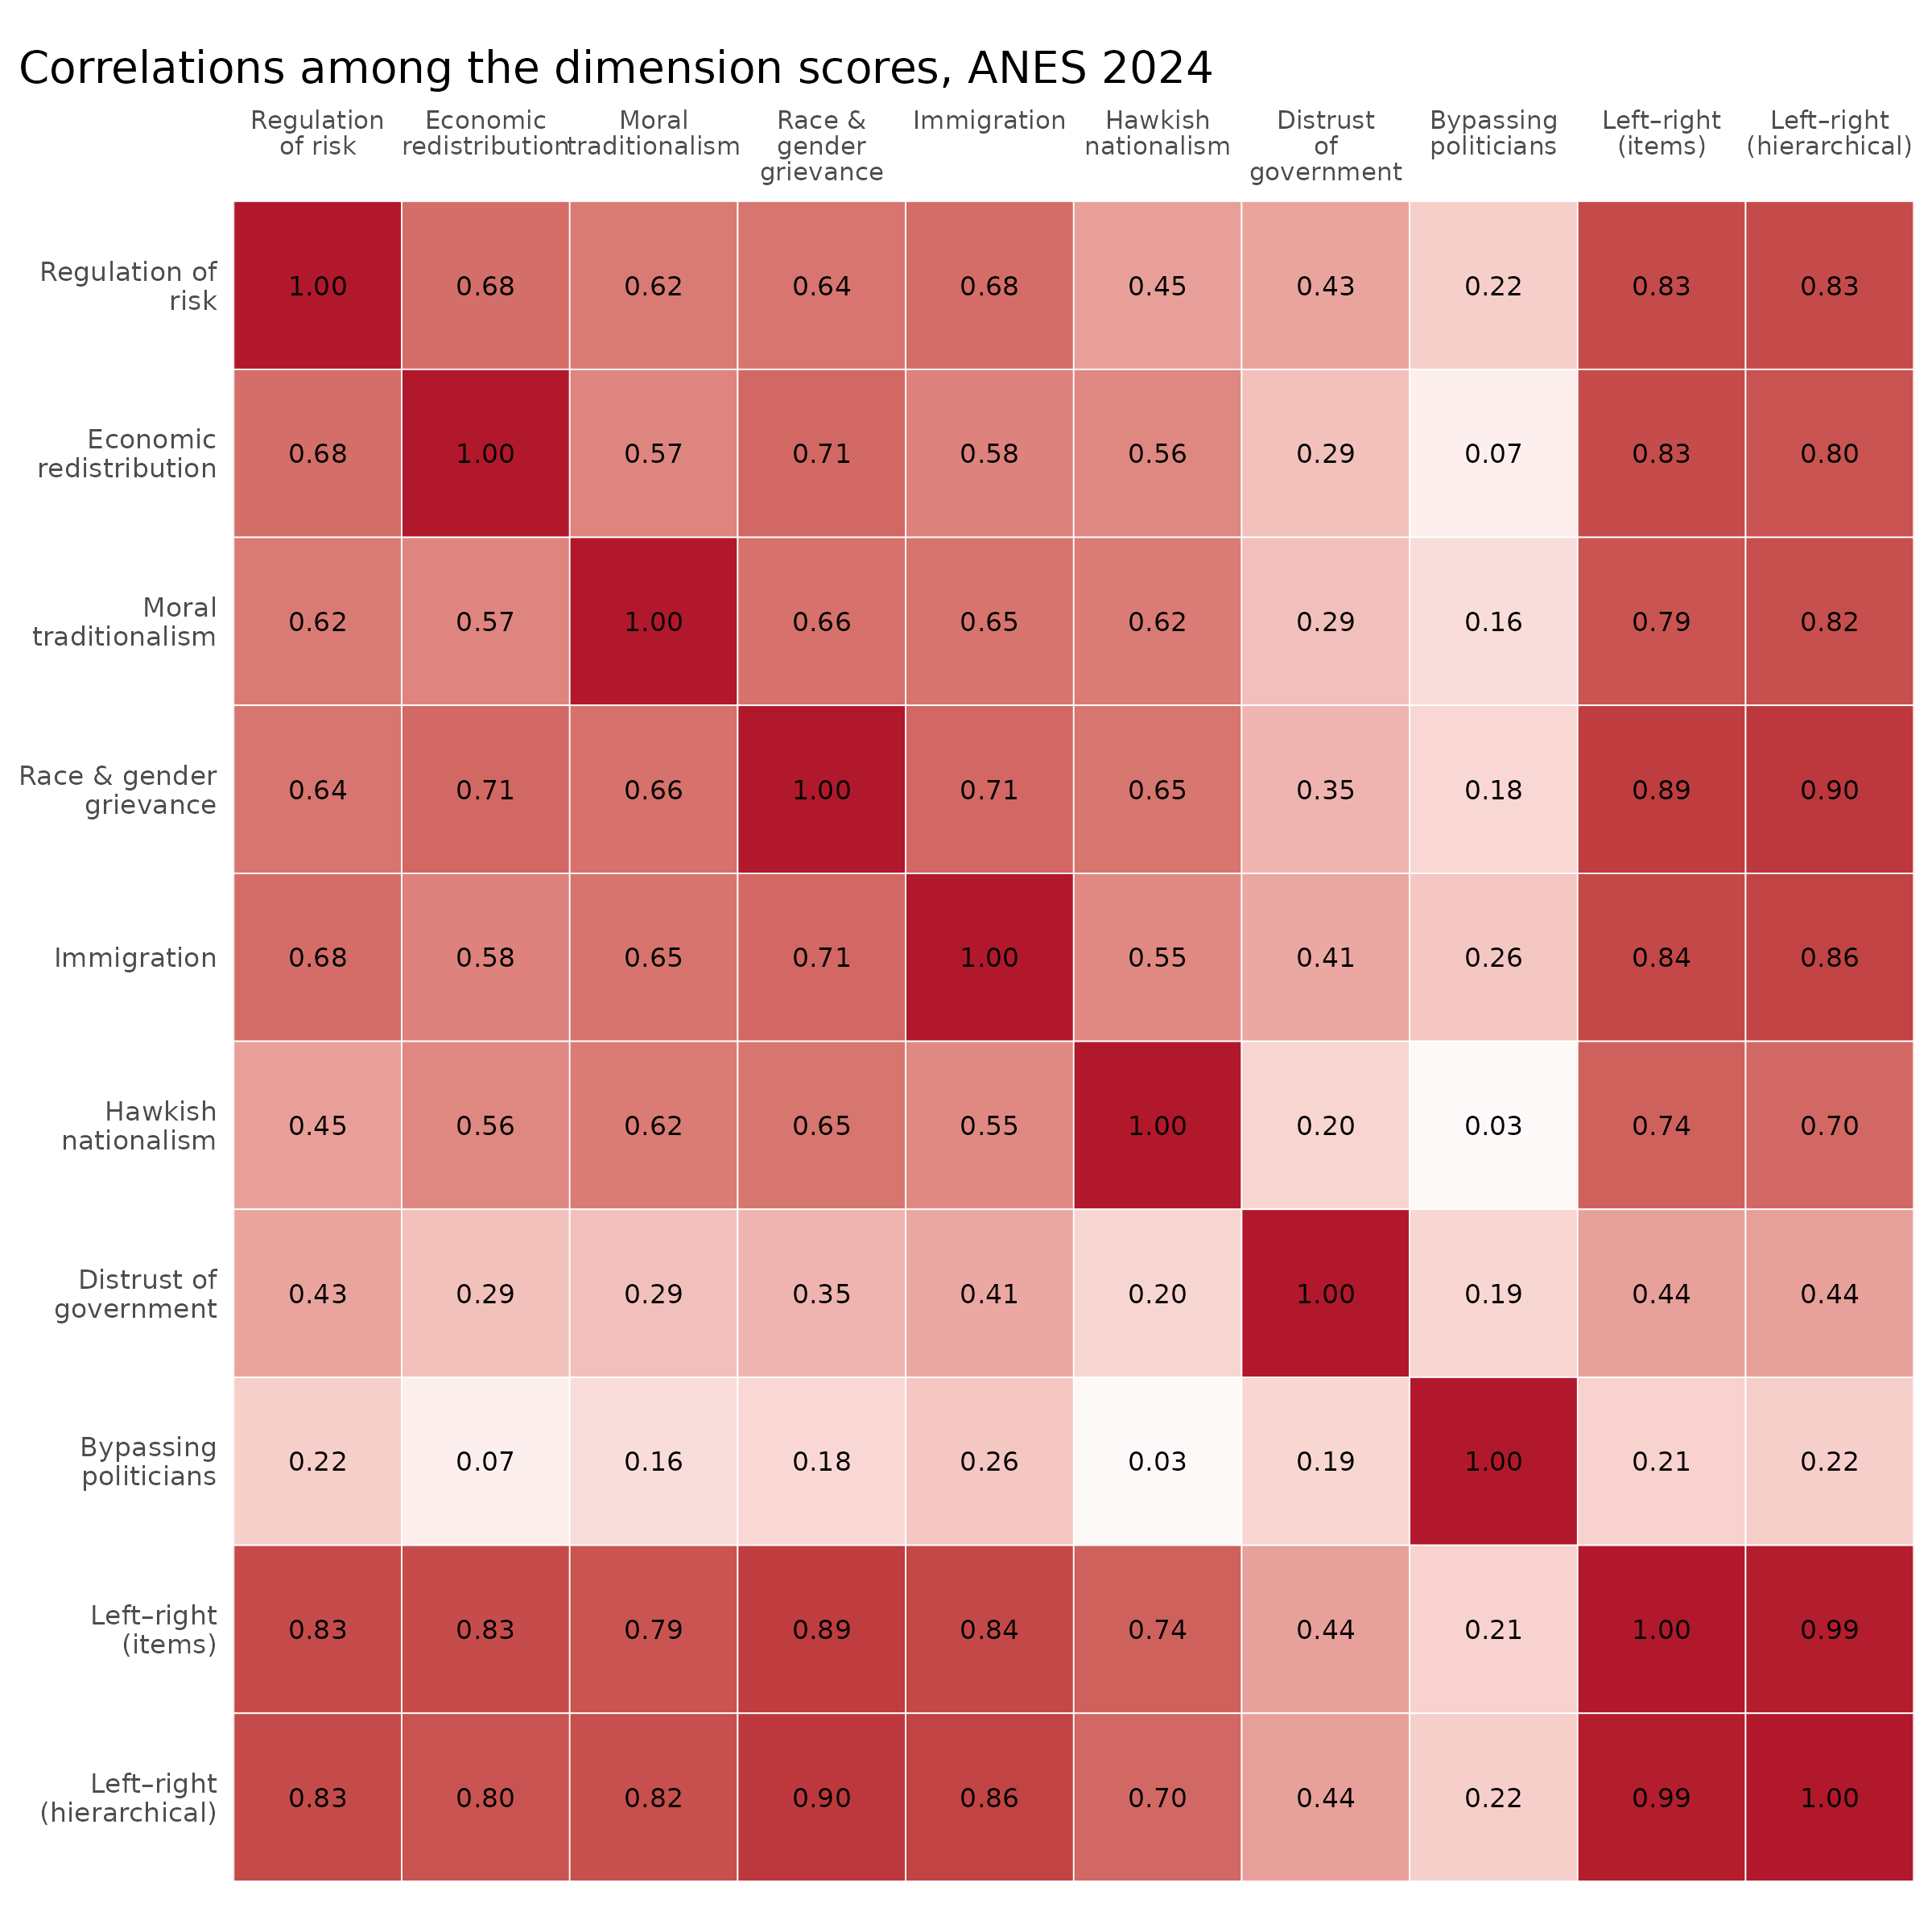
We can see that the 8 dimensions are correlated positively, though the last 2 much less so. I decided to score the general left-right axis from the 73 questions directly. This unconstrains the path from the general factor to the items to be more free. By looking at the plot above you can see that this makes little difference as the hierarchical left-right dimension correlates 0.99 with the one extracted directly.
Using this model, we can check the distribution of scores in ANES and from our test takers online:
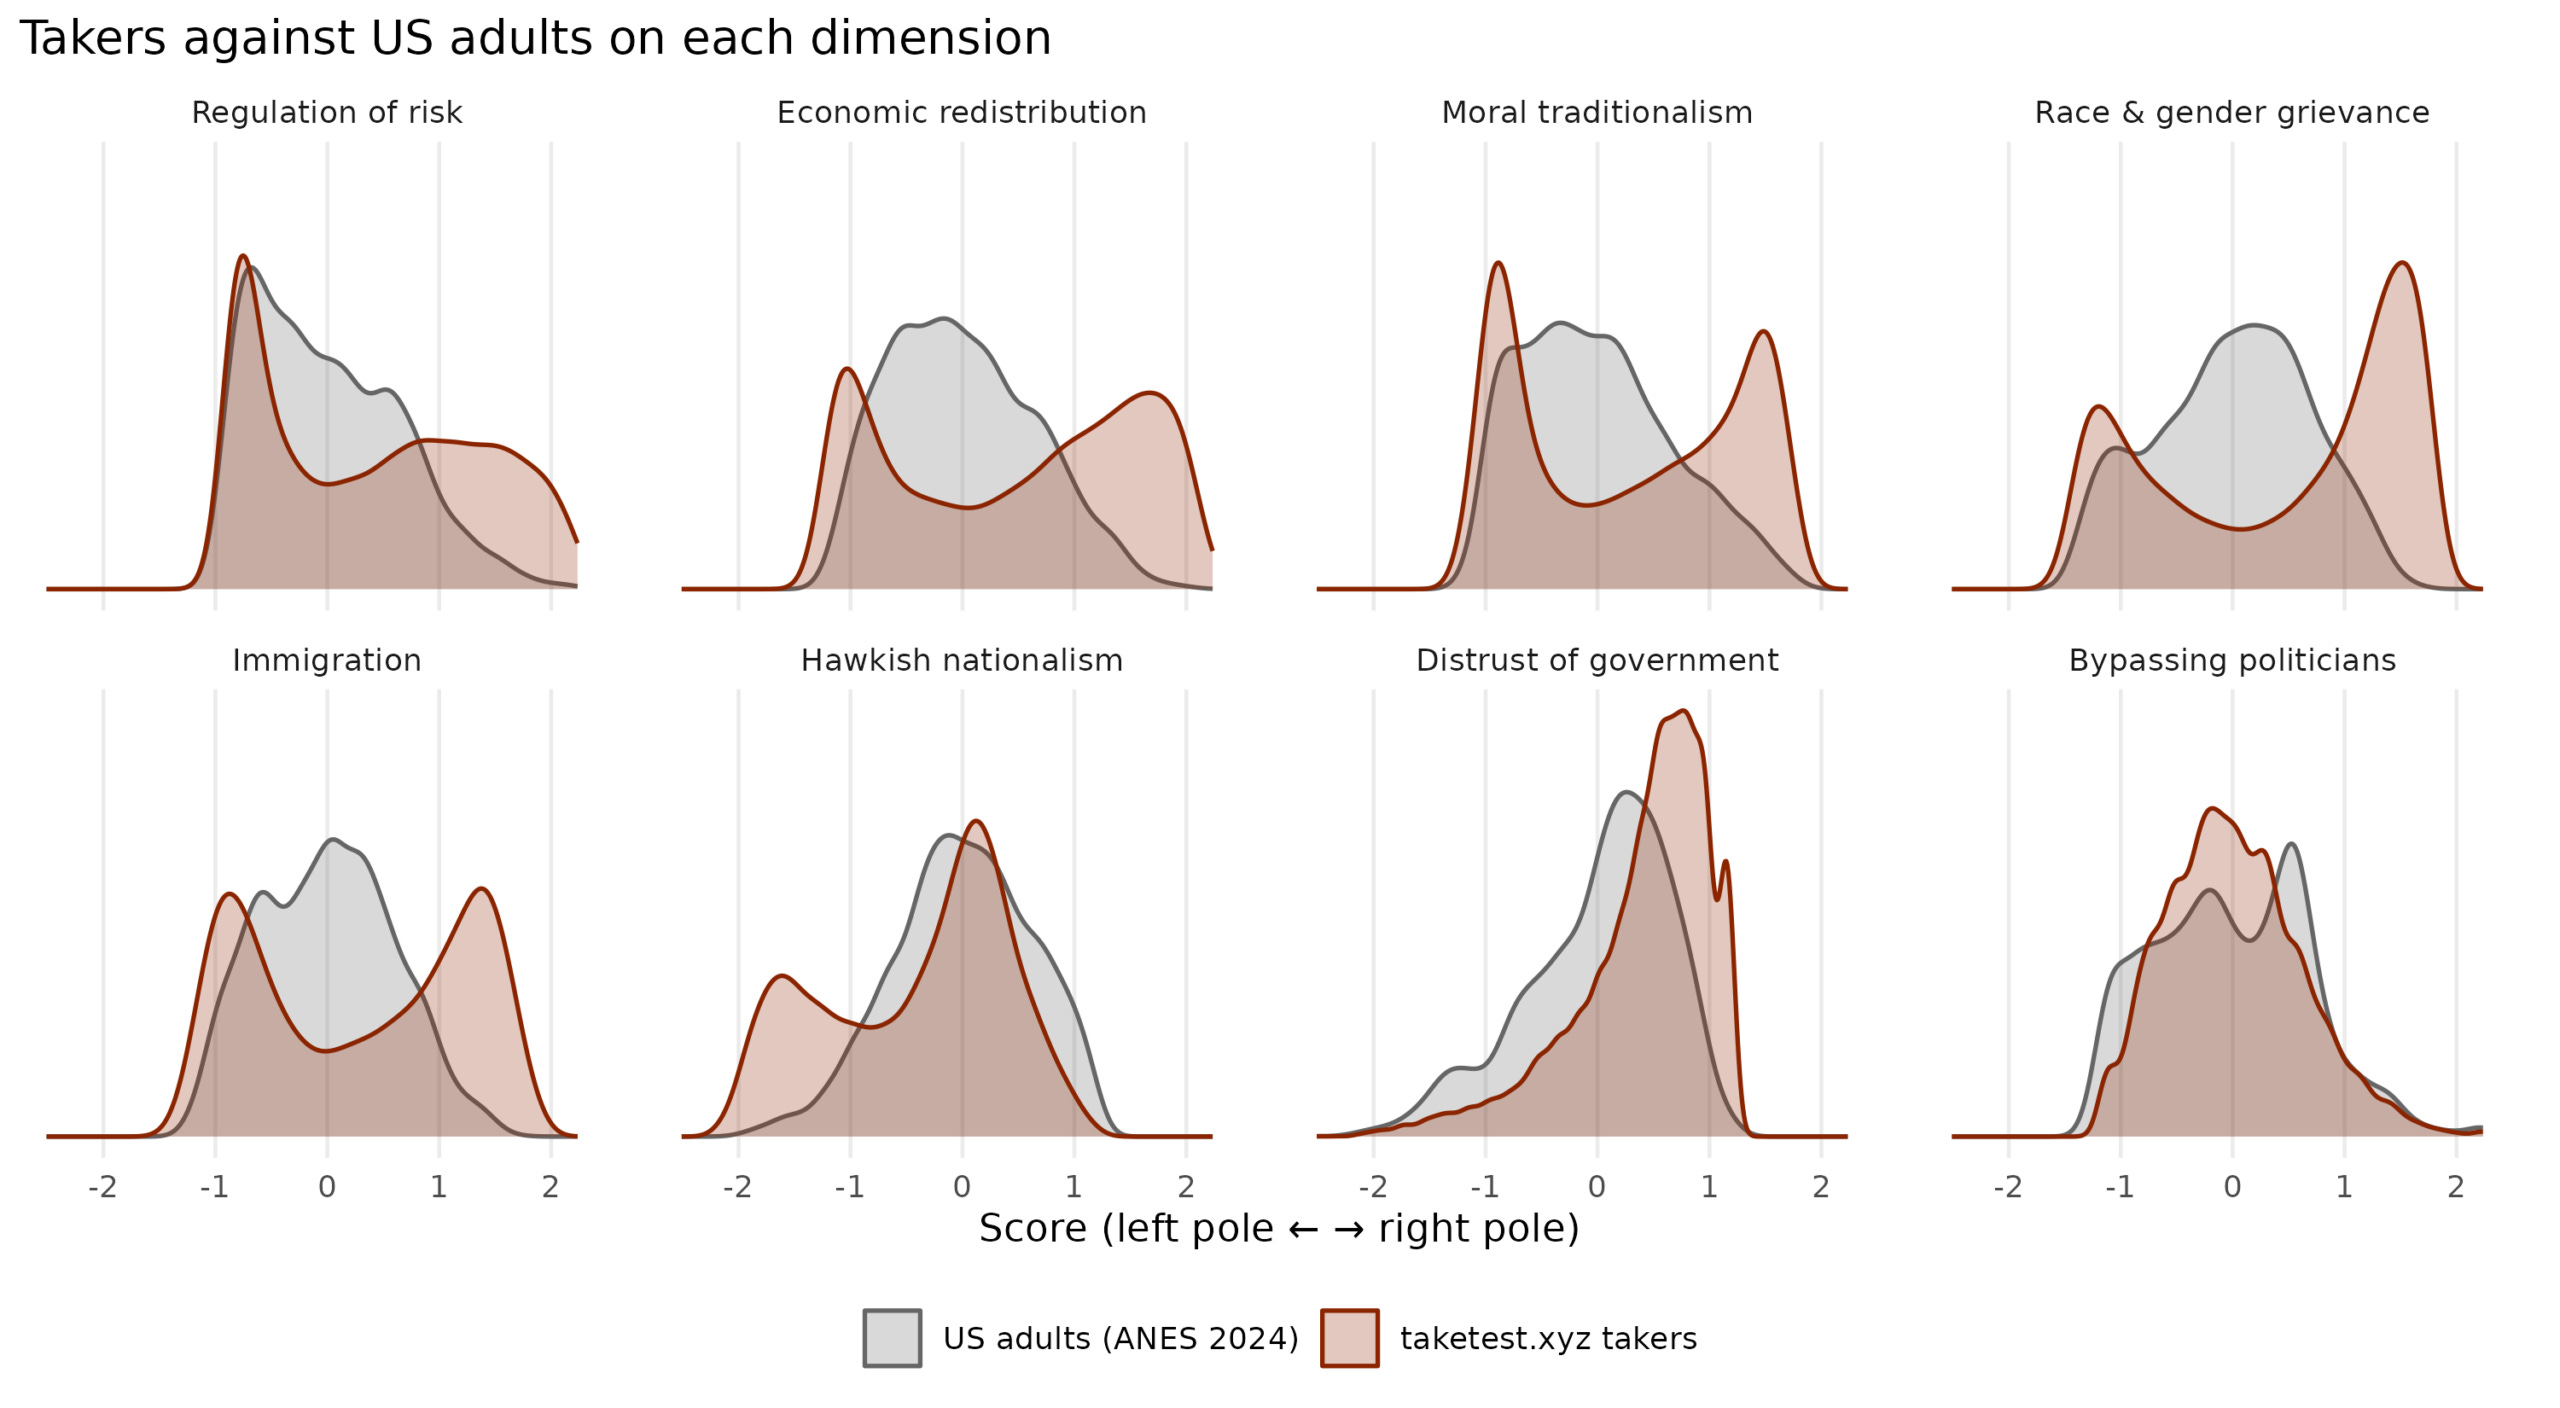
Online takers are more bimodal but only for the 6 scales that have strong left-right loadings, and the last 2 are more unimodal, though not necessarily normally distributed. Finally, then, we can compare the left-right dimension the same way:
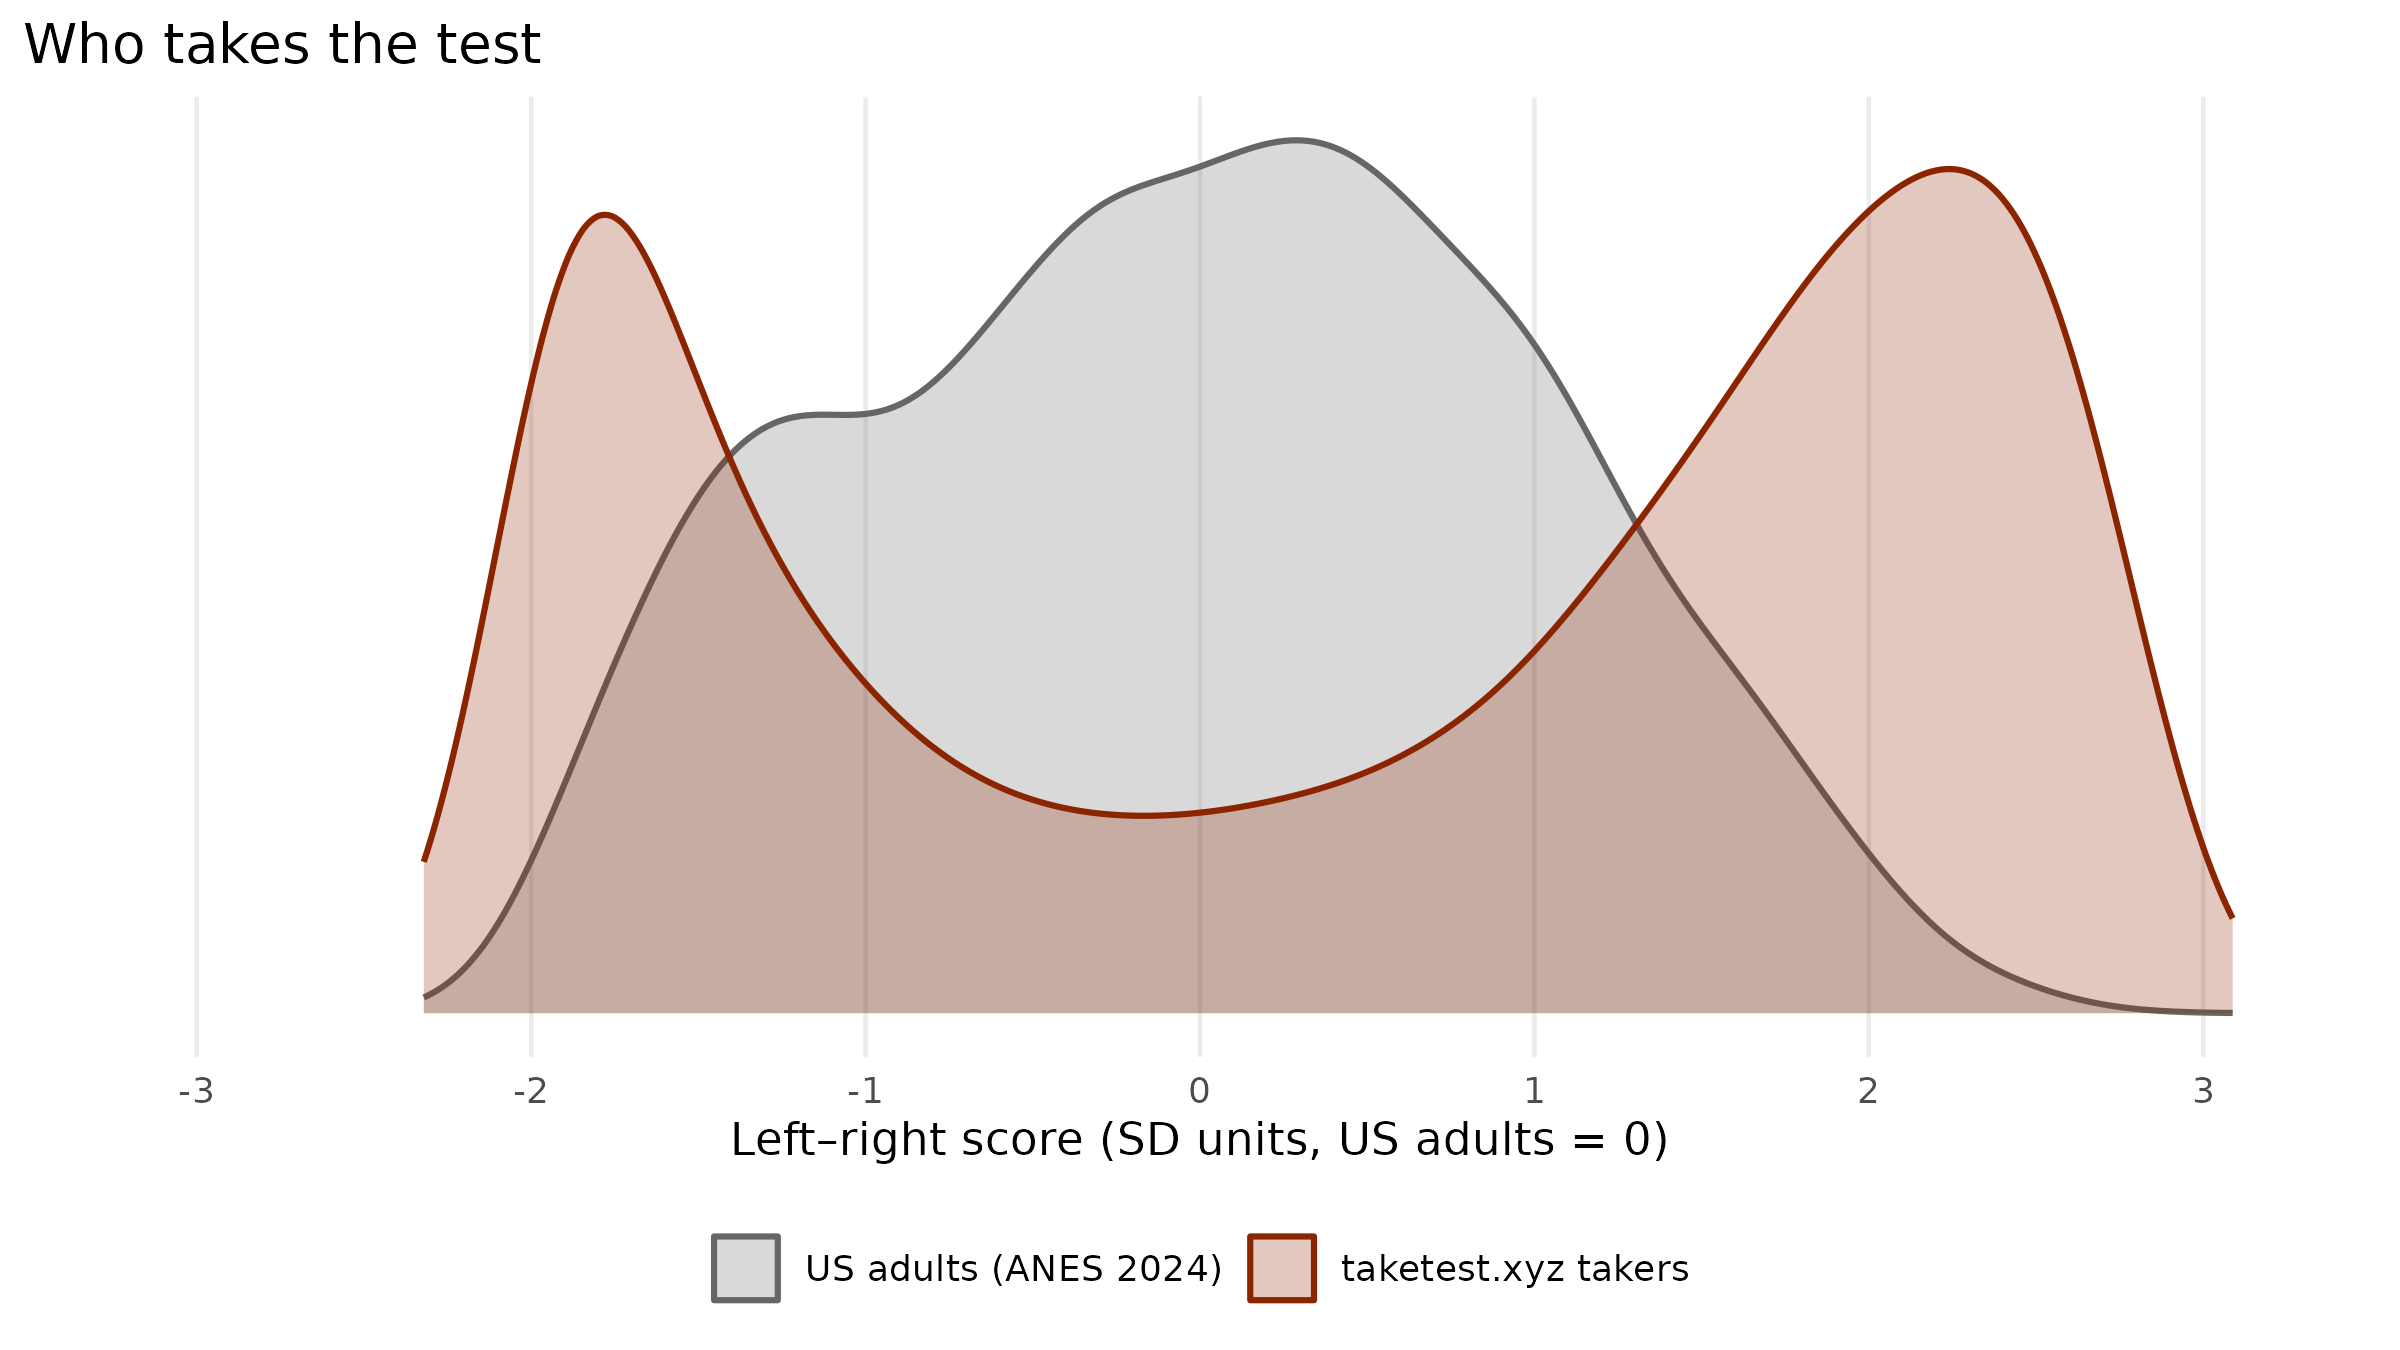
This is all well and good, but do these factor scores for left-right work? Well, I left out the self-placement items, so they could be used for validation:
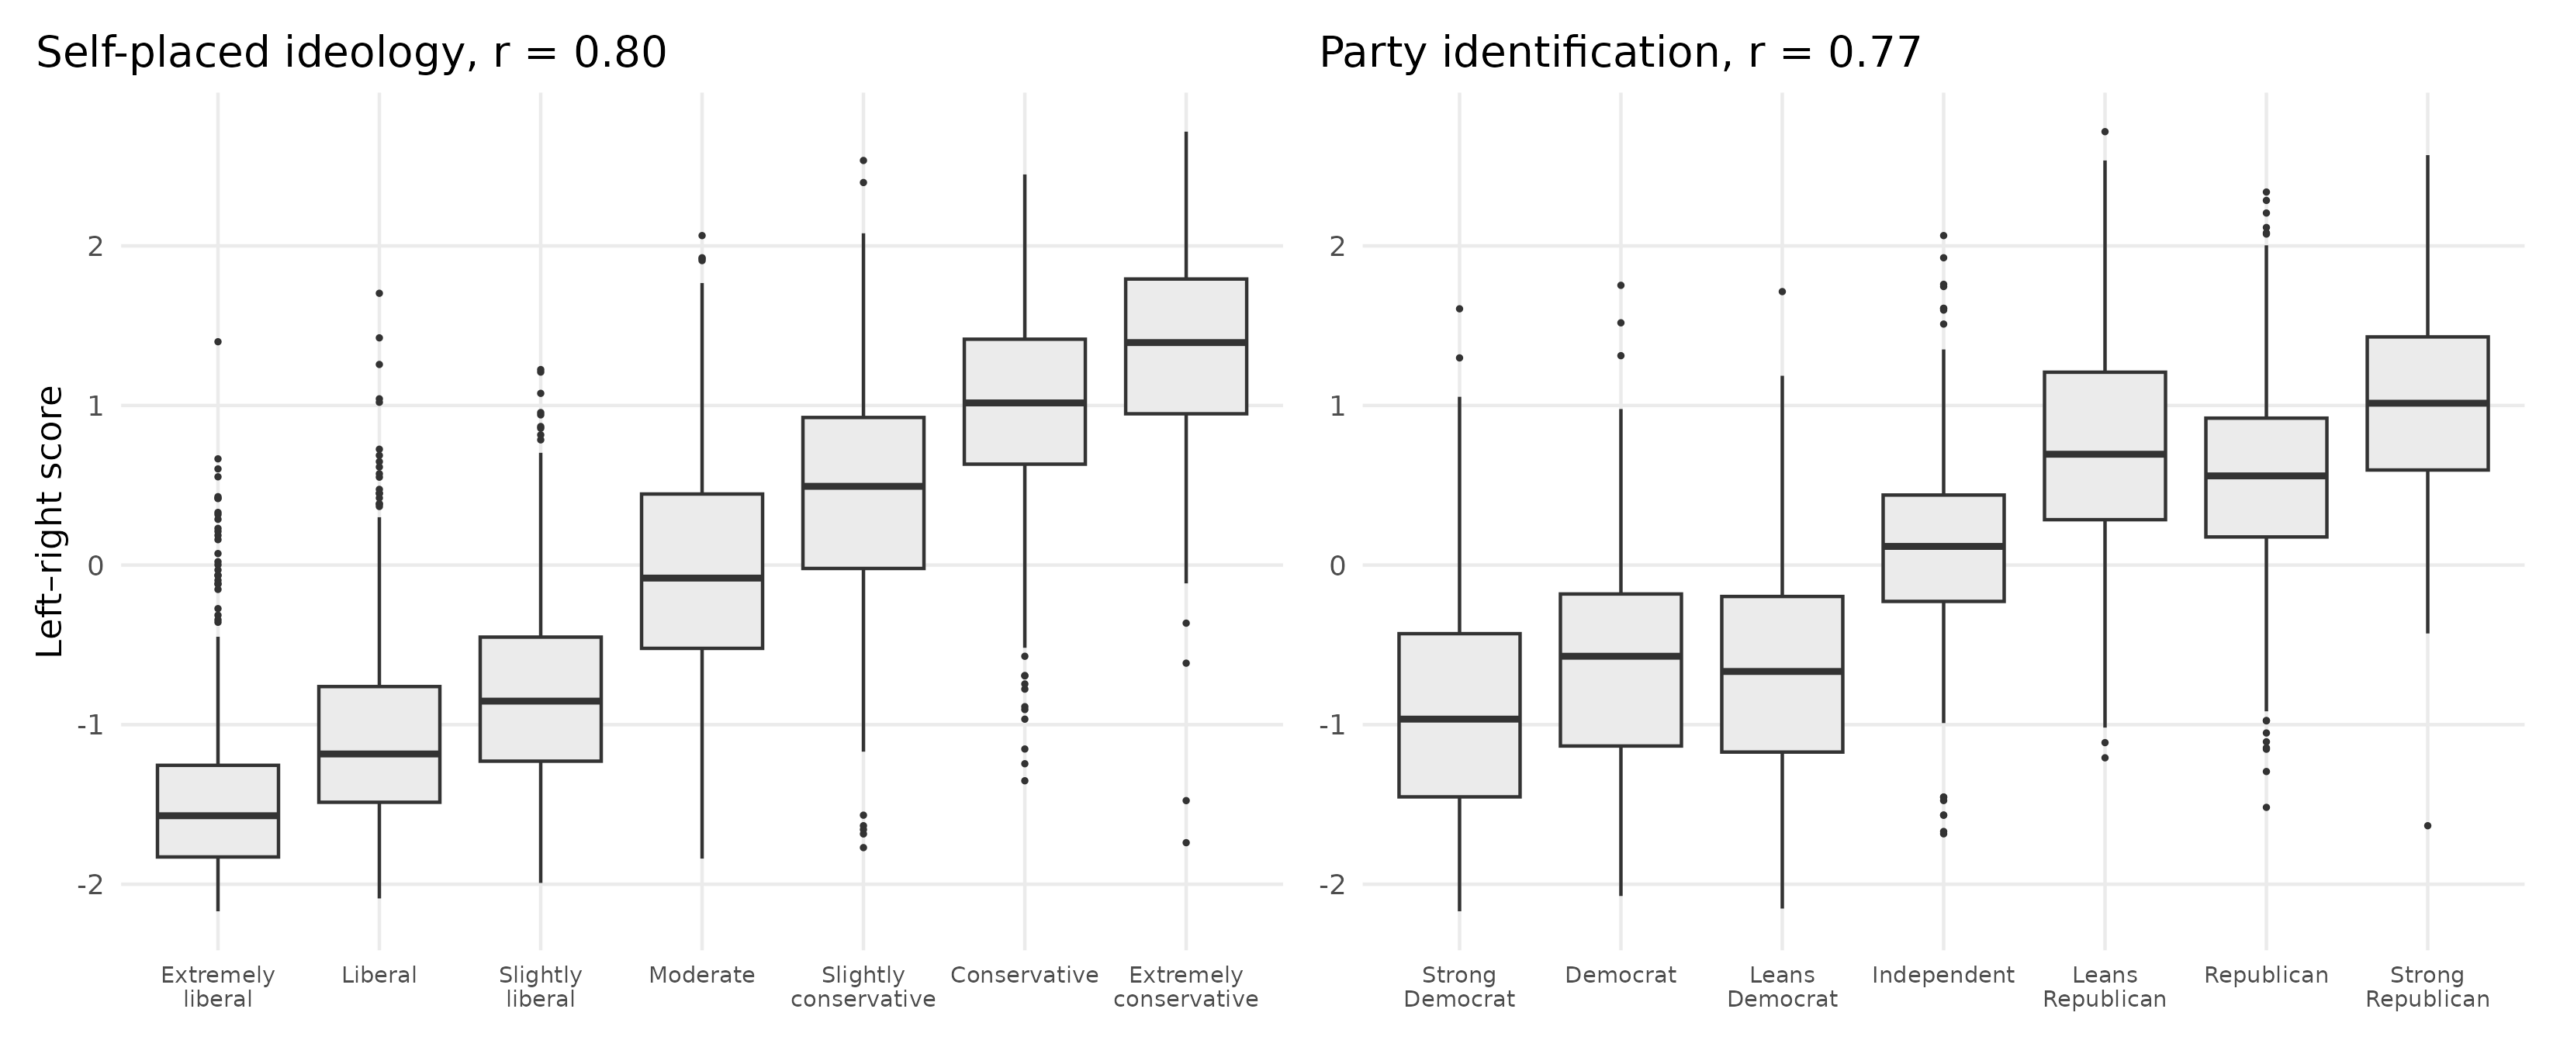
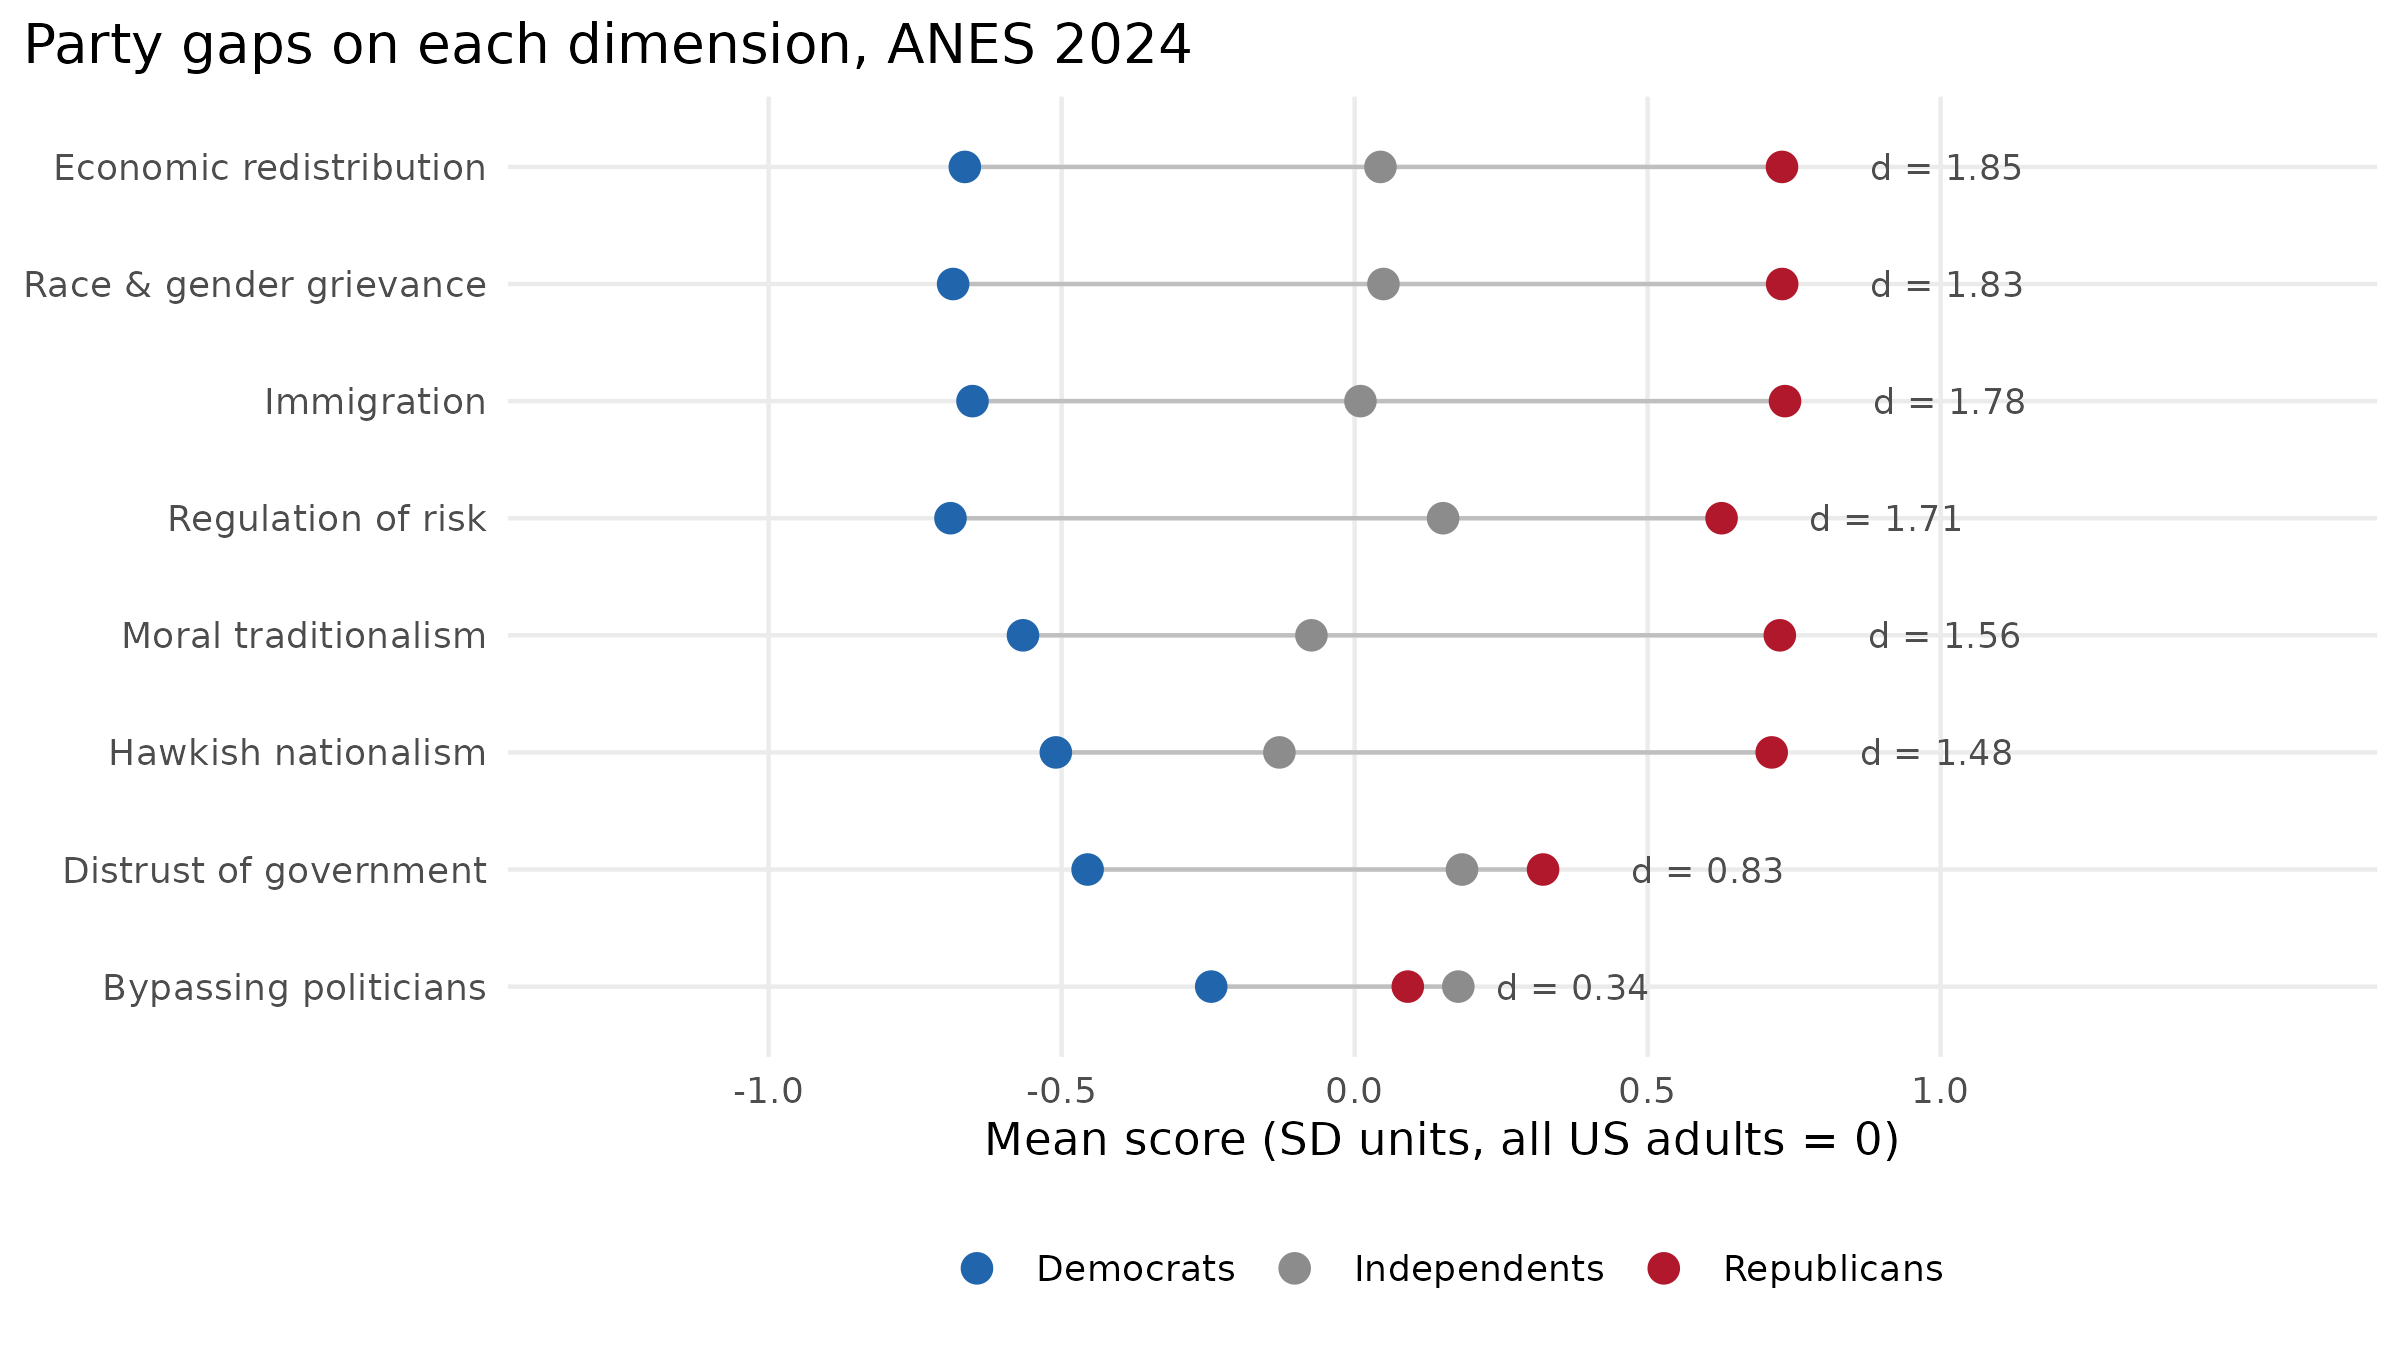
People’s own ratings of their ideology and party allegiance correlate about 0.80 with the score. For the parties, apparently X and leans X are about the same thing. The gap sizes in these policy opinions are quite large:
As a function of age and sex, results are eye-opening:
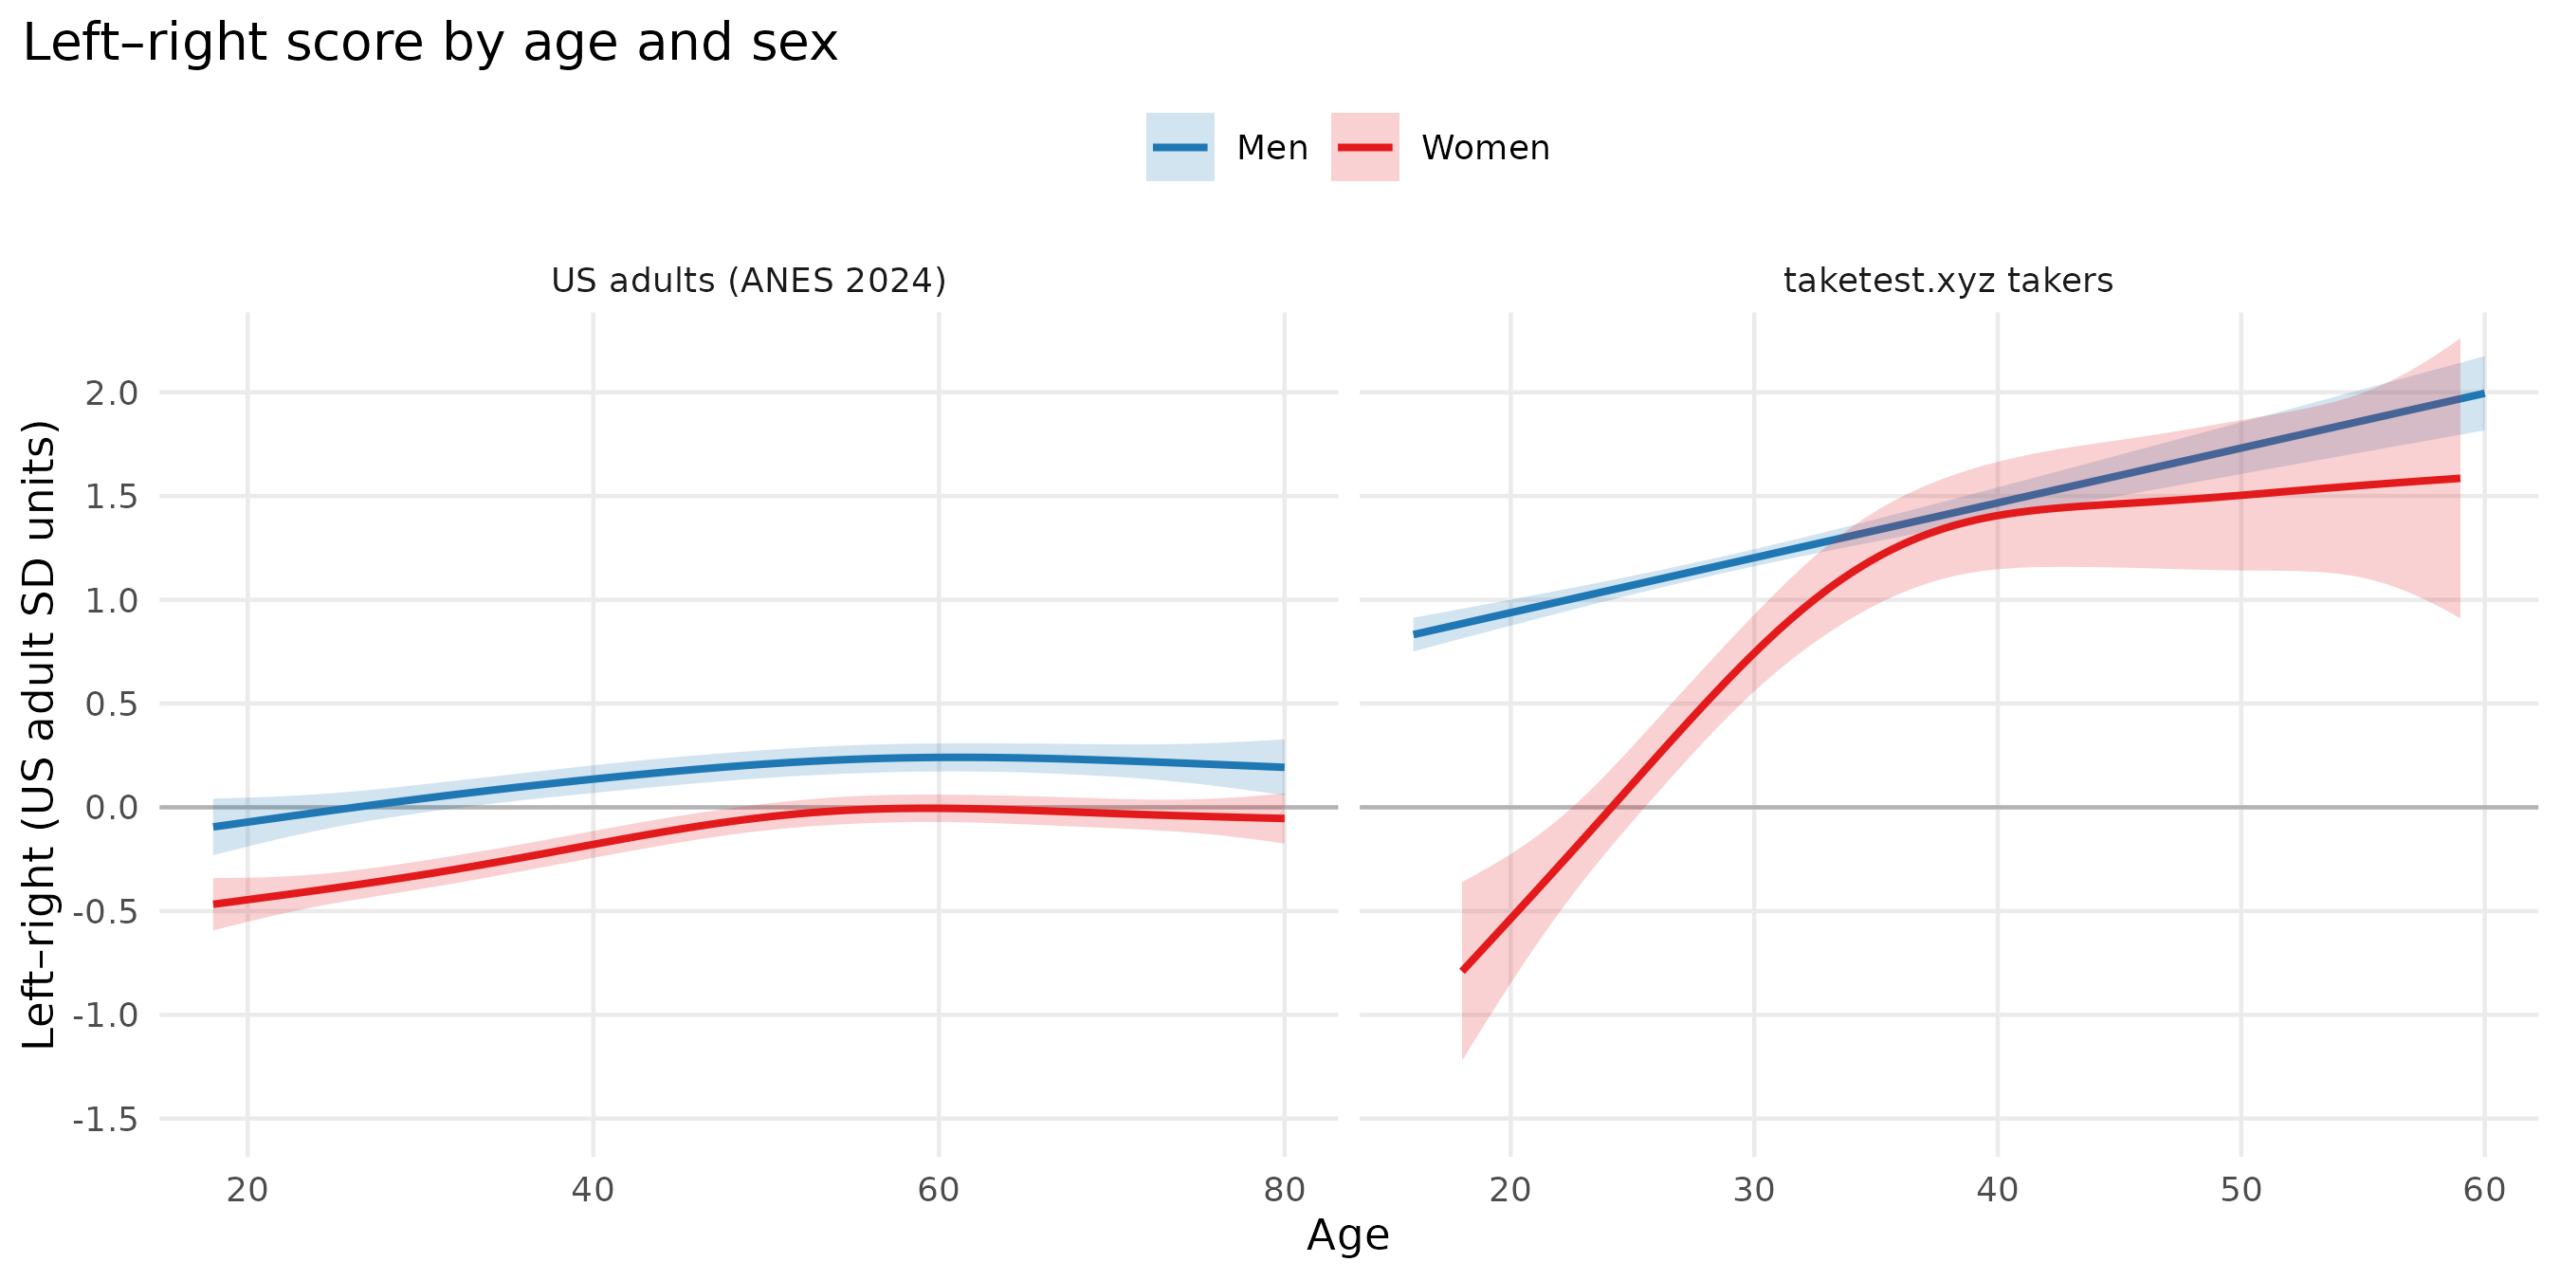
In the US nationally representative data, men are more right-wing at a roughly constant effect size of 0.3 SD at all ages, and older people are more right-wing. In the online data, this pattern is extremely different before the age of 35. If one was only looking at online data, it would appear that young women have taken an extreme left-wing turn. I am not quite sure which plot is more realistic. The online sample is obviously self-selected but ANES-type data also suffer from low data quality as the takers are not very motivated. To note is that I only added the sex and age questions later so the full 28k dataset does not have this information, which may create further self-selection issues.
Appendix
Here’s a bass-ackwards type plot for the k=1-15 solutions with tentative labels (AI):
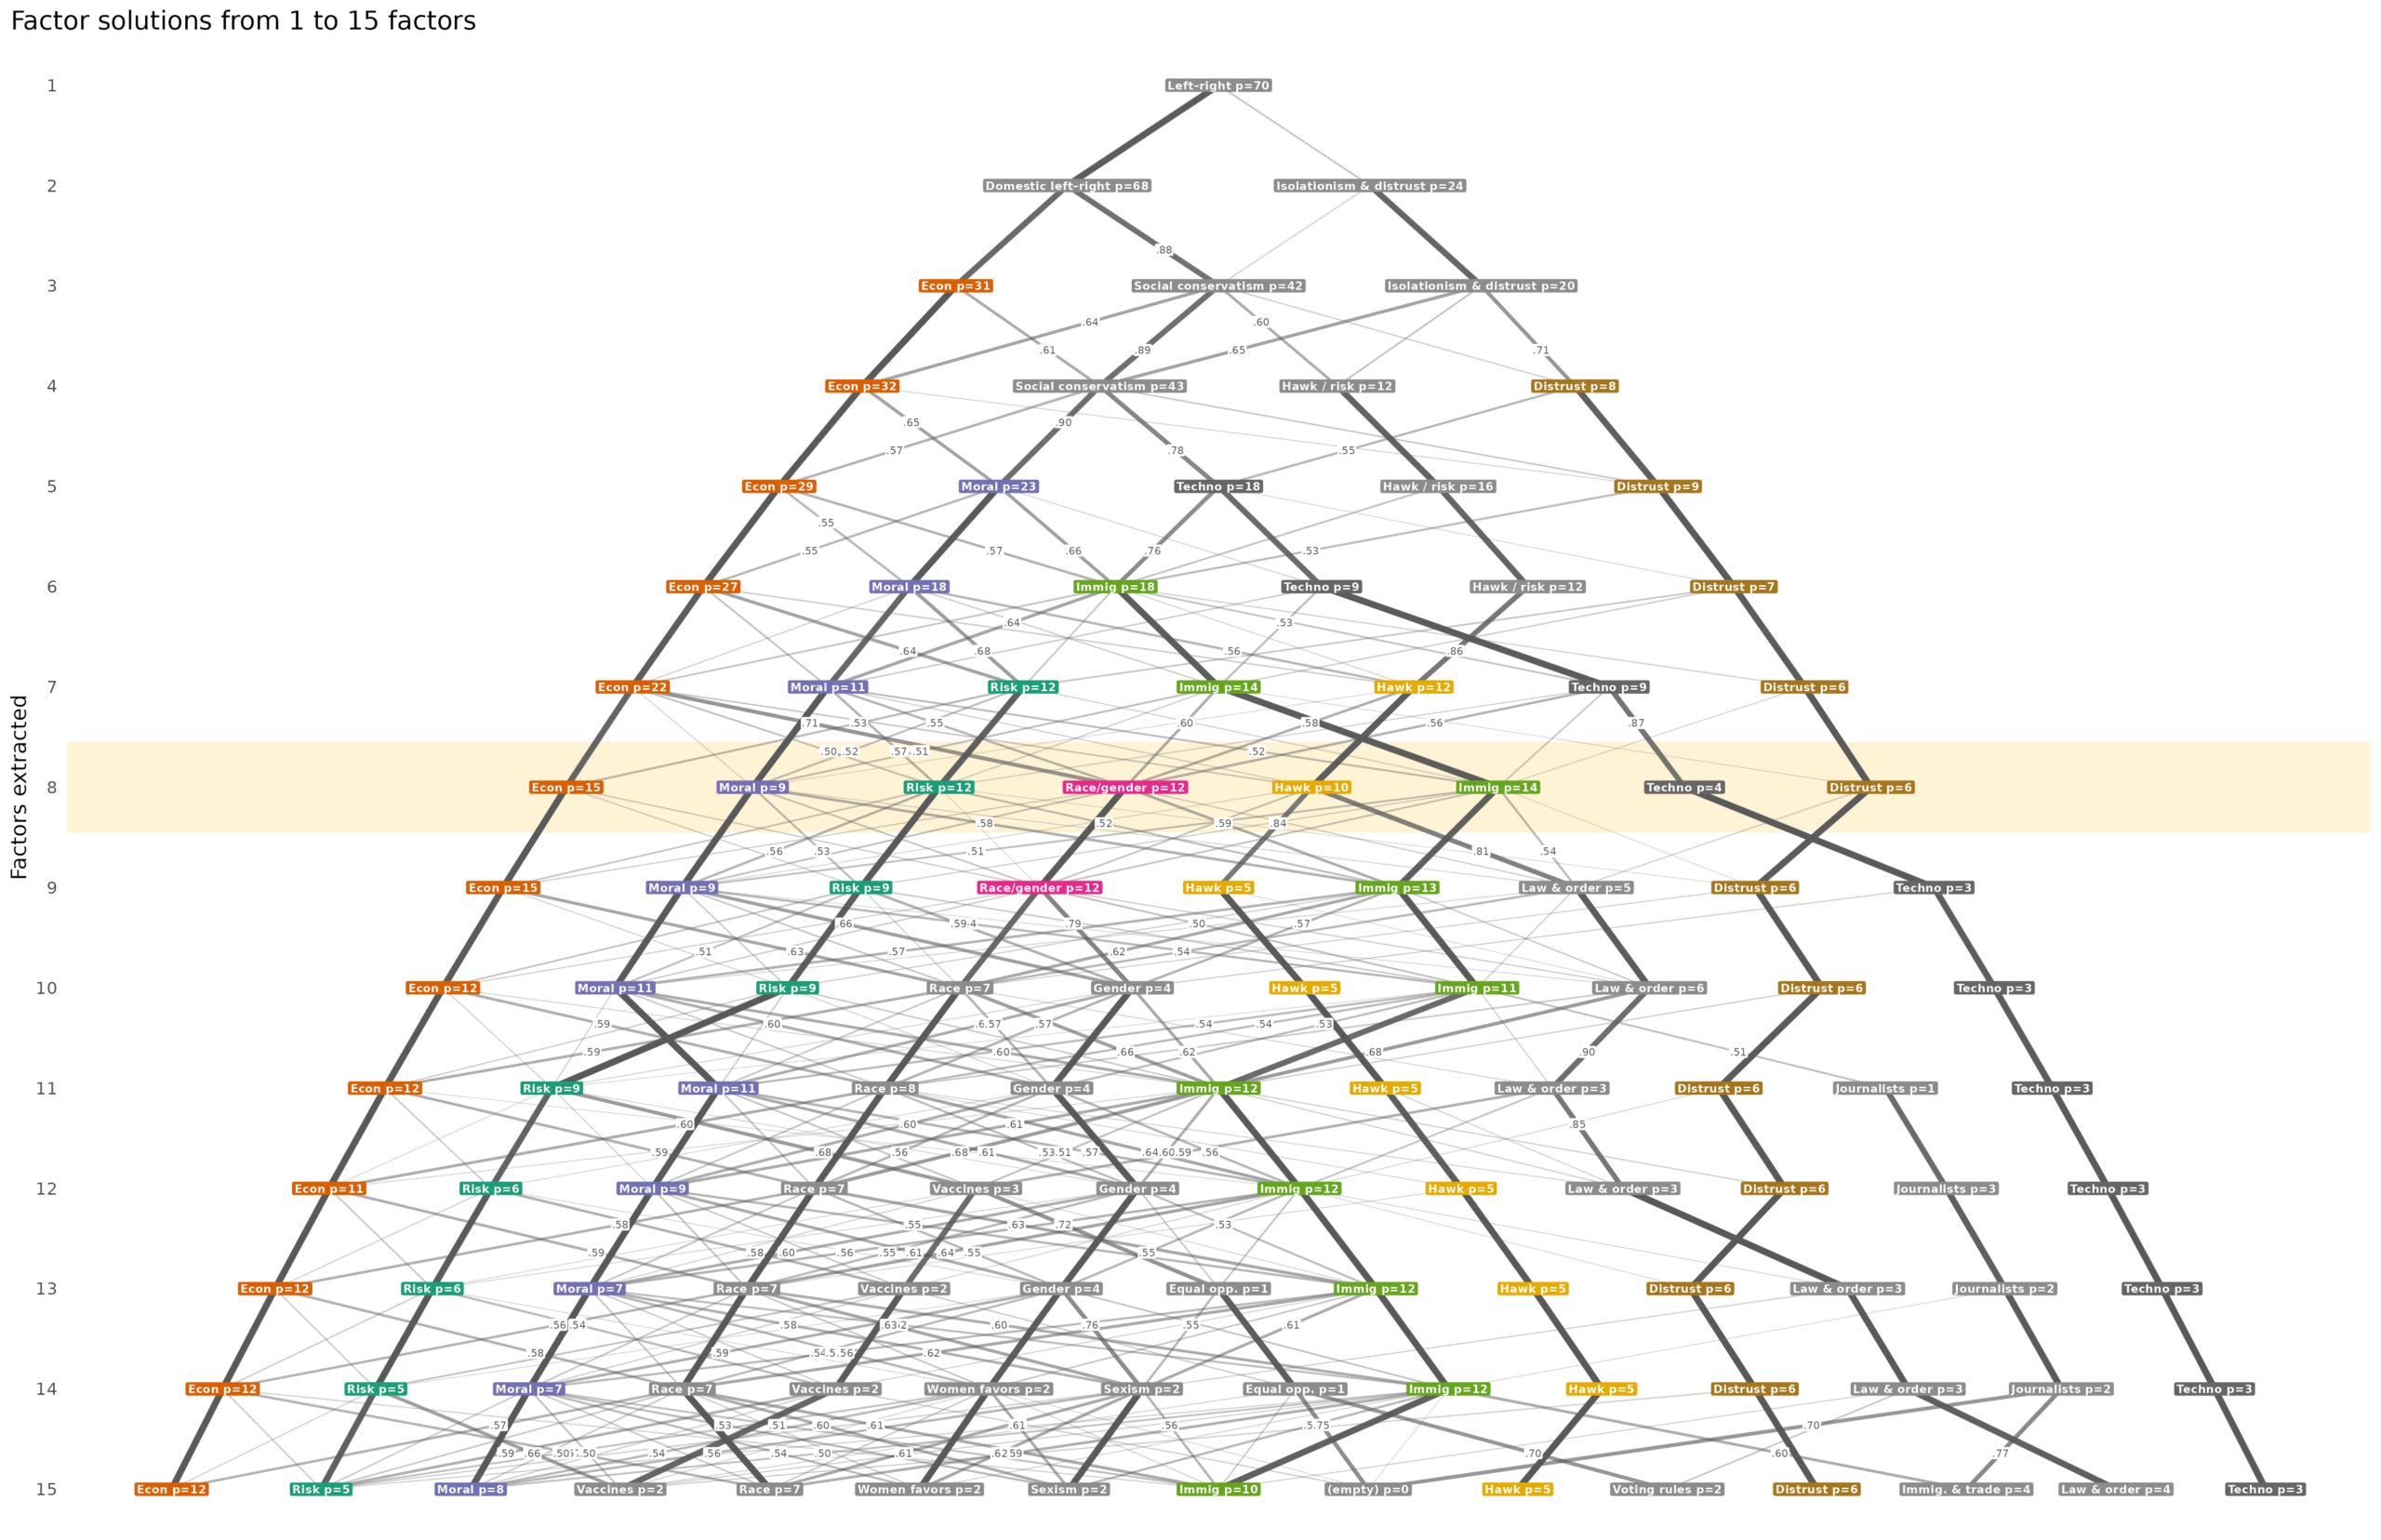
The p is the number of items with >.30 loadings. Some people were insinuating that I had deliberately merged nationalism with Israel love in some kind of neo-con plot. These people would perhaps prefer the k=9 solution where “Hawkish nationalism” splits the 10 items into global interventionism (Israel, Ukraine stuff) vs. domestic (border wall, voter ID etc.). This solution was not chosen because the technocrat factor declines from 4 to 3 salient loadings. If one added more or different questions to the dataset, one would of course get somewhat different factors. Factor analysis cannot find factors in a dataset that isn’t suitable for finding them.