
The structure of Substack
An actual data-based analysis of the HBD writer network

So Substack has nice open APIs where one can download a lot of interesting data from. Uncorrelated already did some cool stuff on how to make money on Substack using posting patterns, paywalls etc. to predict revenue. The TL;DR is:
Charge More: Price remains a powerful lever. However, it should be noted that by default estimated revenue is a function of price. So this correlation may exist regardless.
Post Often: Reducing the average time between posts (posting more frequently) still shows a strong positive association with revenue.
Paid Percentage: The positive correlation holds – more paid posts generally link to higher revenue in the model, though the visual plots (below) still suggest a potential curve peaking around 50-60%.
Word Count: Longer posts (both free and paid, after log transformations) still show a statistically significant positive correlation with revenue, but the effect sizes are smaller than before. Frequency likely remains more impactful than length alone.
Consistency? Maybe Not: The slight positive correlation for more variance in posting intervals persists. Frequency seems to matter more than rigid timing.
Today I wanted to tackle a different question. Substacks relate to each other in various ways. They can link to each other in posts, say, because they are having a debate, or because they just feature link collection posts. One could collect of all these by scraping the HTML code and finding all the cross-links. Another option is using Substack’s recommendation list. A given Substack can recommend other Substacks. I scraped this data initially for all the top 100 science Substacks, but it turns out that many people don’t use the feature:
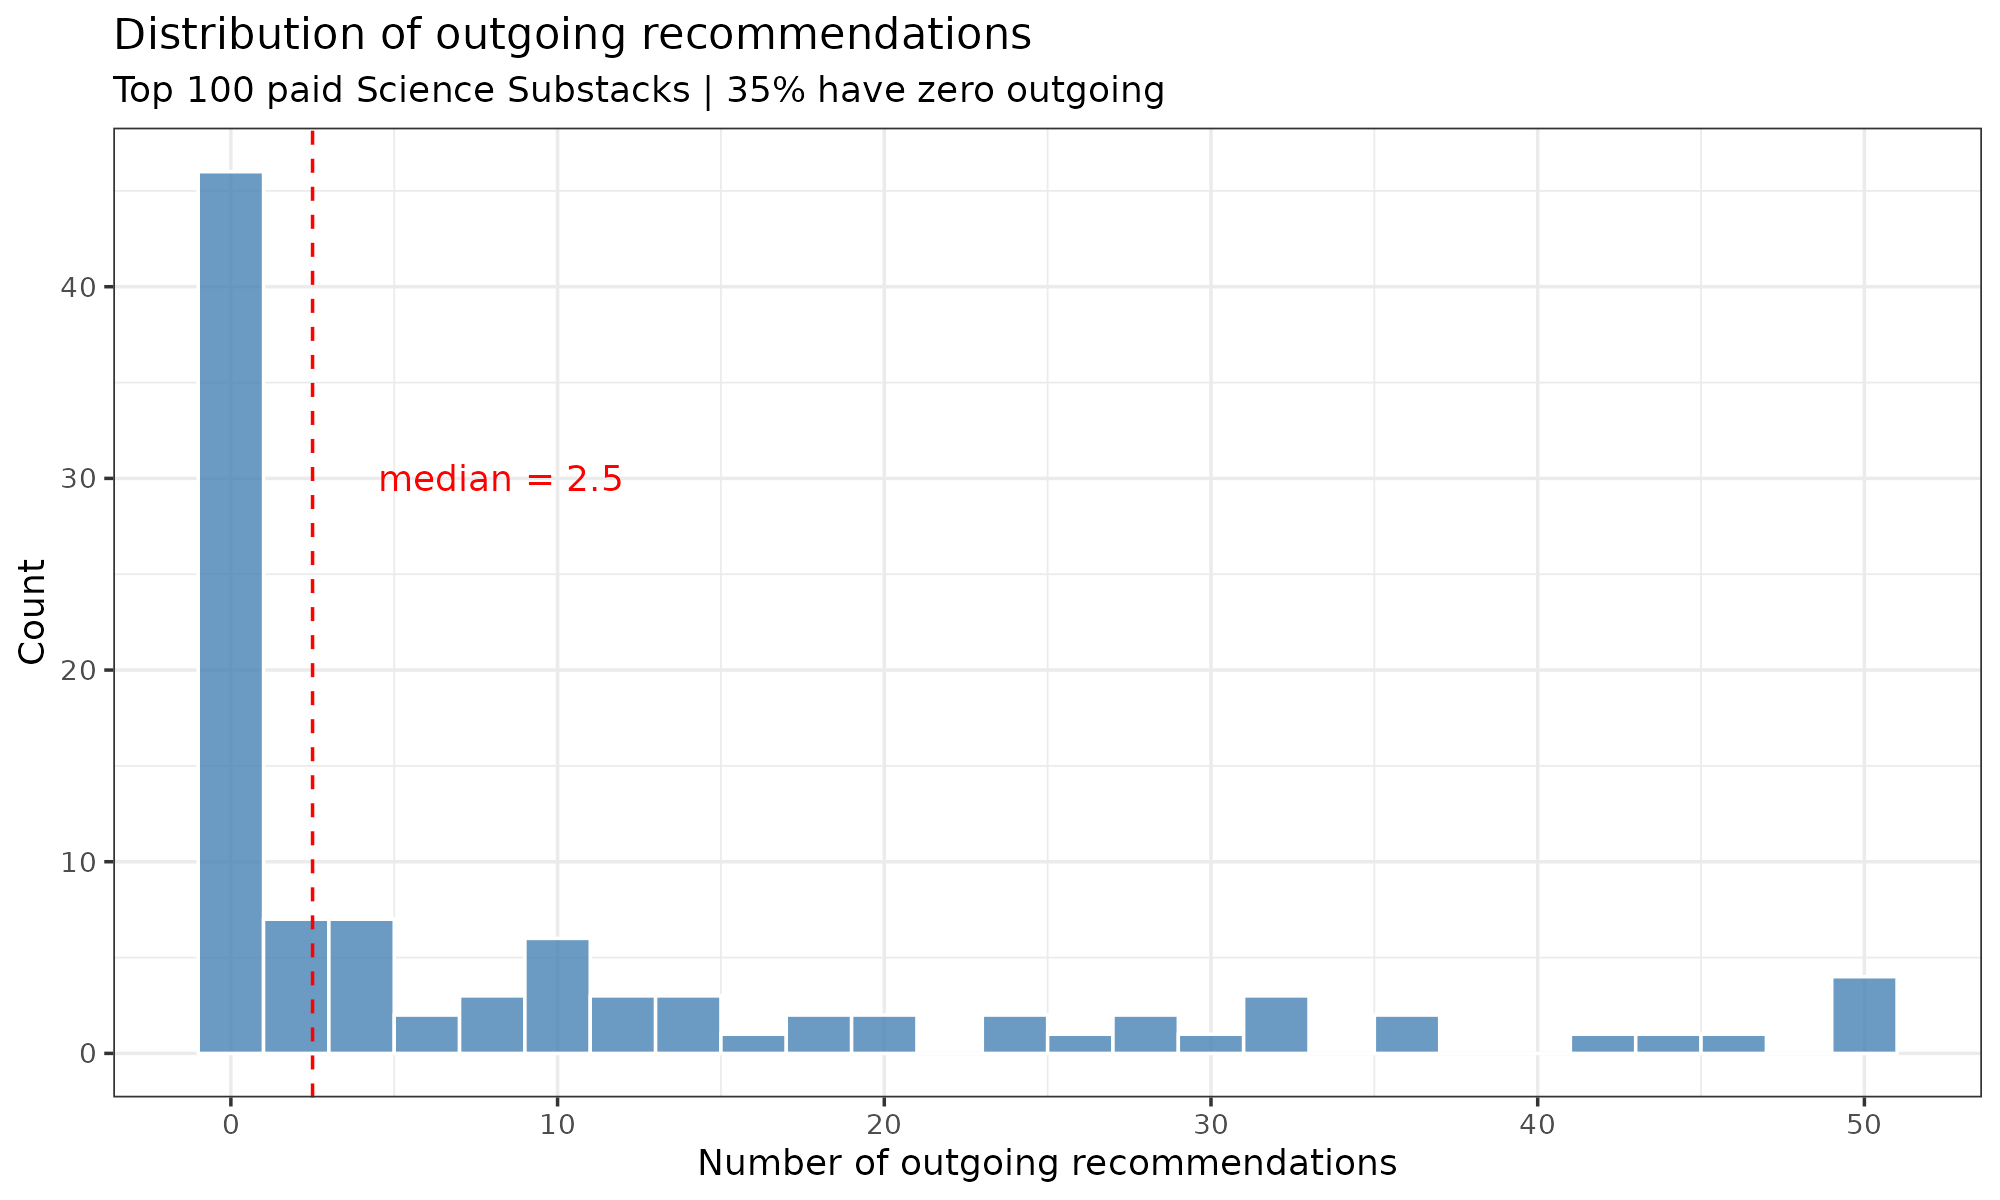
So 35% of these popular Substacks don’t recommend anyone, which is poor manners, but also gives the authors an easy way out in case someone asks them “Can you please add me to your recommendation list?”. Additionally, it protects the authors against 6 degrees of Kevin Bacon guilt by association recommendation. Whatever the reason, this dataset is not great for analysis. Regarding the network data, Substack itself provides the crude overlap metric. Mine are:
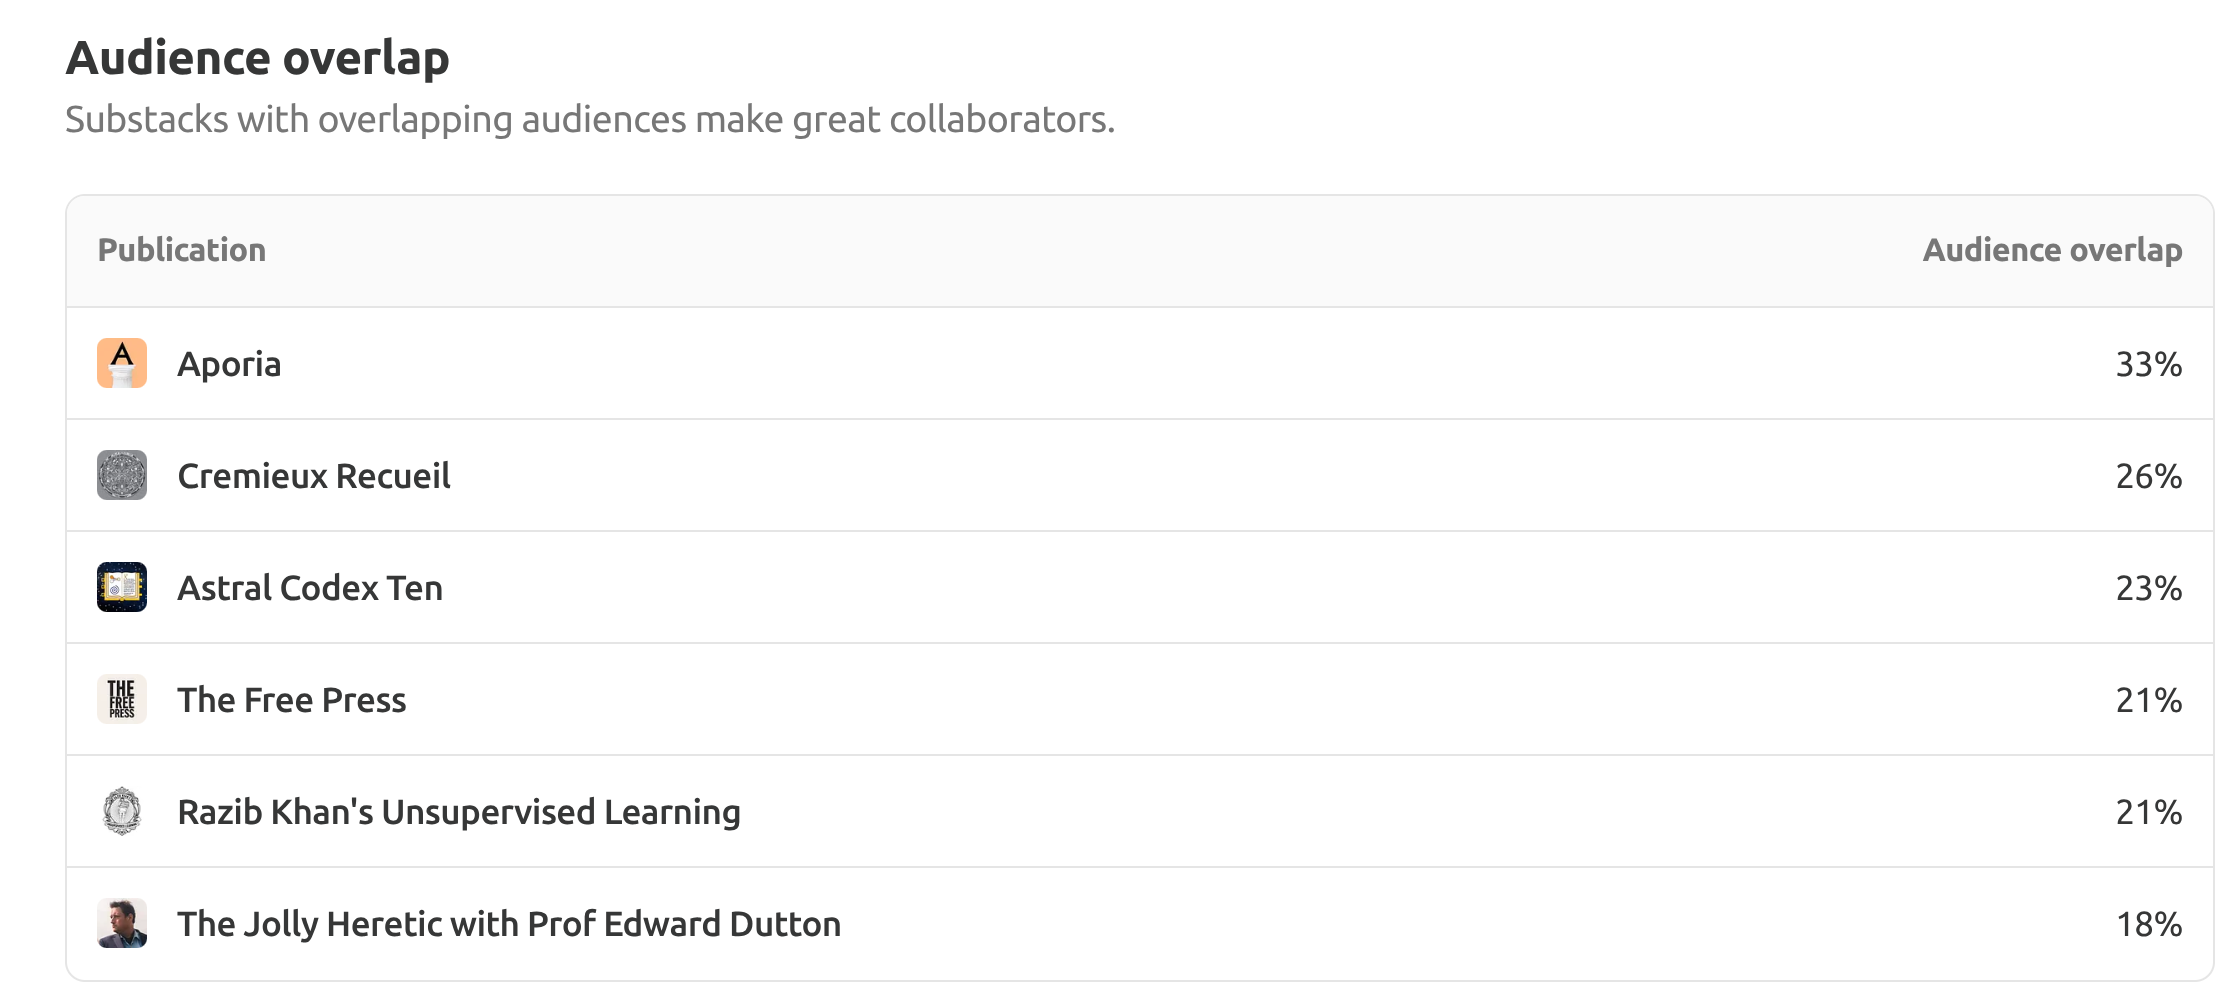
I think this is some variant of the crude overlap from my Substack’s perspective, which is to say that 33% of subscribers also subscribe to Aporia, 26% to Cremieux and so on. The problem with this metric is that larger Substacks will always have more overlap in general, regardless of whether they have any particular shared topics or not. One solution to this is to use the PMI metric. This is based on the relative rate of overlap given a neutral prior. So if one Substack has 10% of all users and another has 5%, their expected overlap by chance is just the product, that is, 0.5%. If we find that the actual value is 2%, then the relative rate is 4x, and PMI is log2(RR). The related NPMI metric normalizes this value to -1 to 1 range. Anyway, the Substack-level recommendations are unsuitable given the 35% of the data is missing. But we can go further. I scraped all the posts for the top 100 science Substacks to find all the users (~31k posts). Then I scraped all the users’ pages to see which Substacks they subscribed to (~62k users). Their distributions of subscriptions look like this:
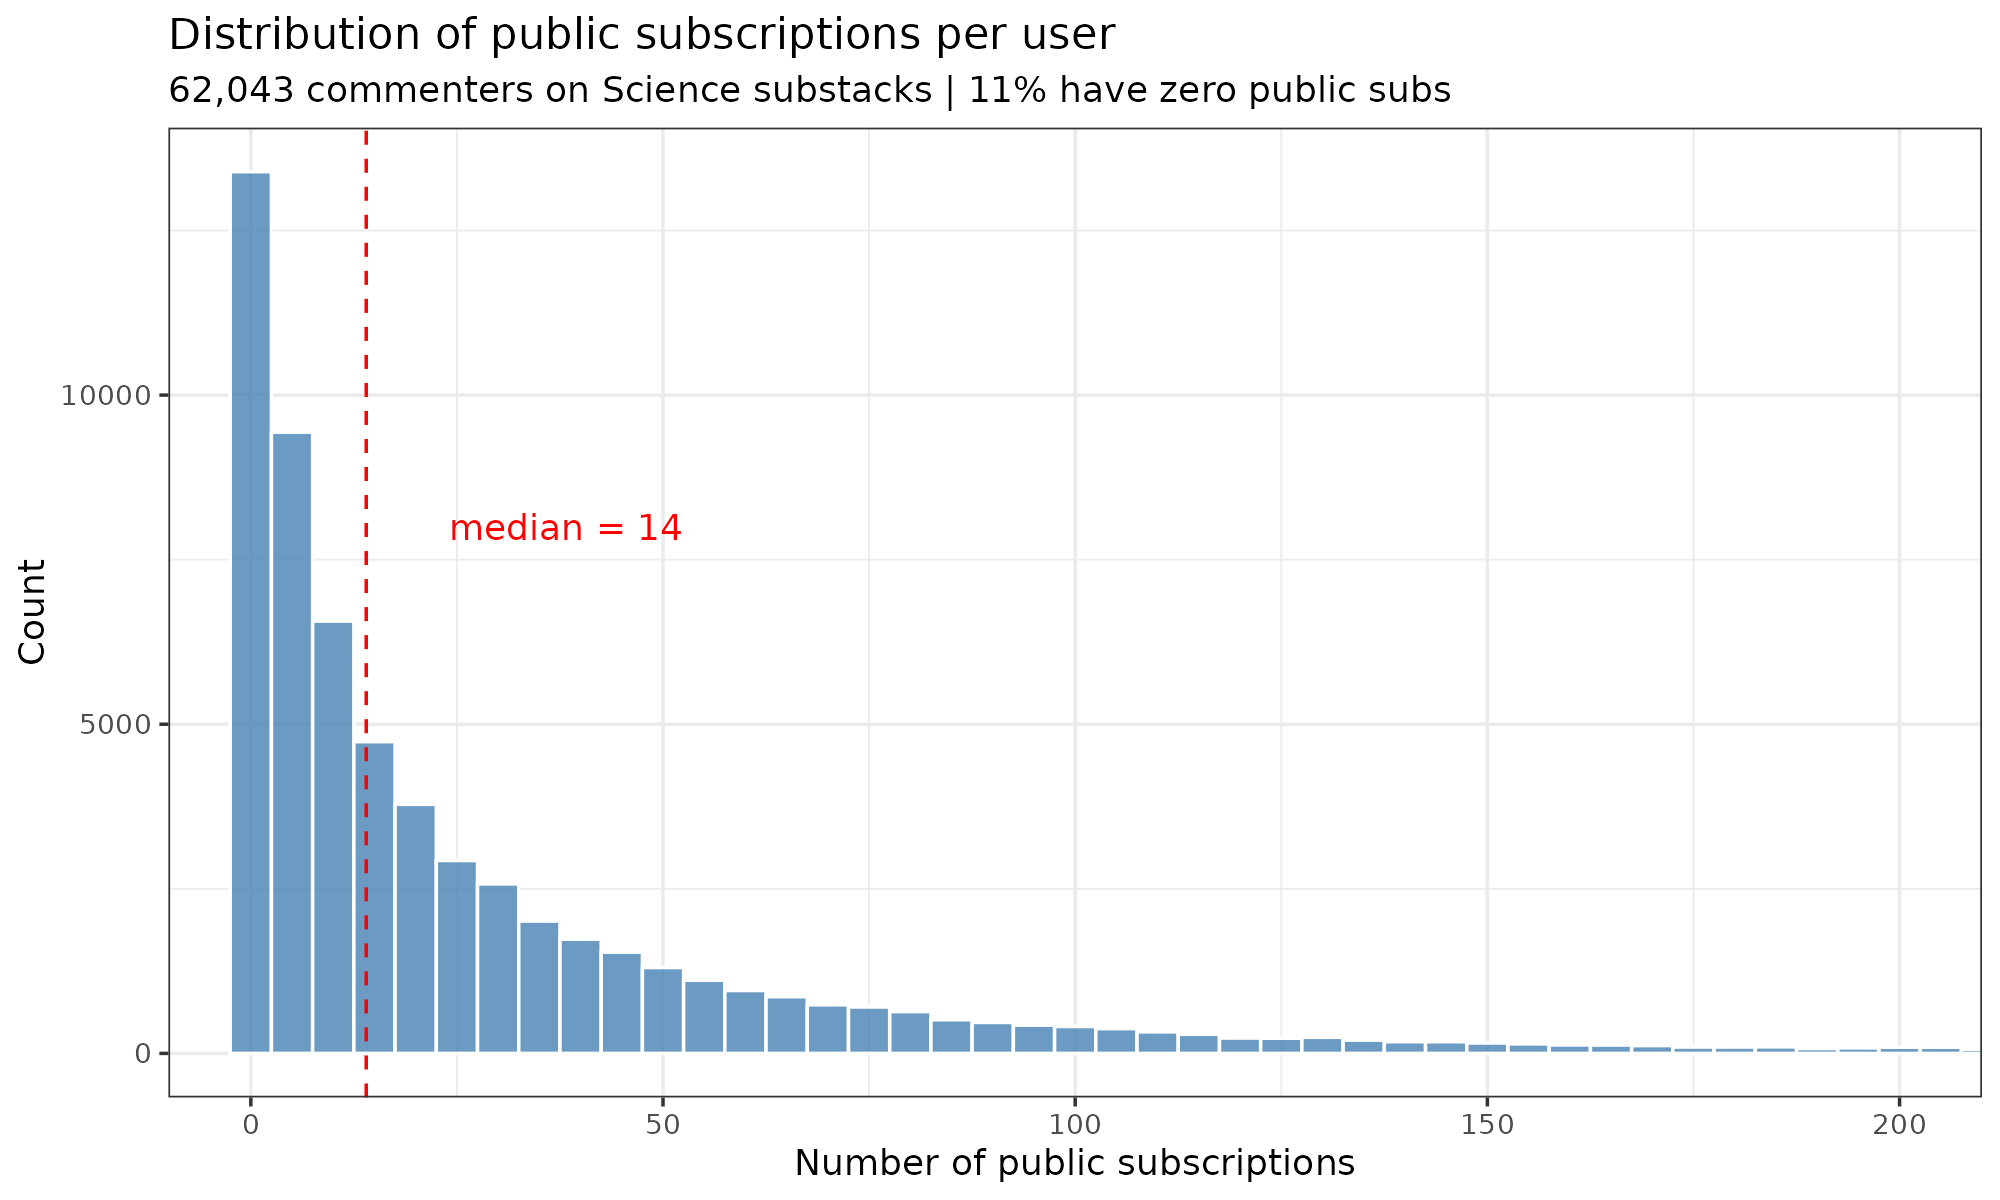
It’s a beautiful power law distribution. Using these subscriptions, we can build an overall network of Substacks using NPMI:
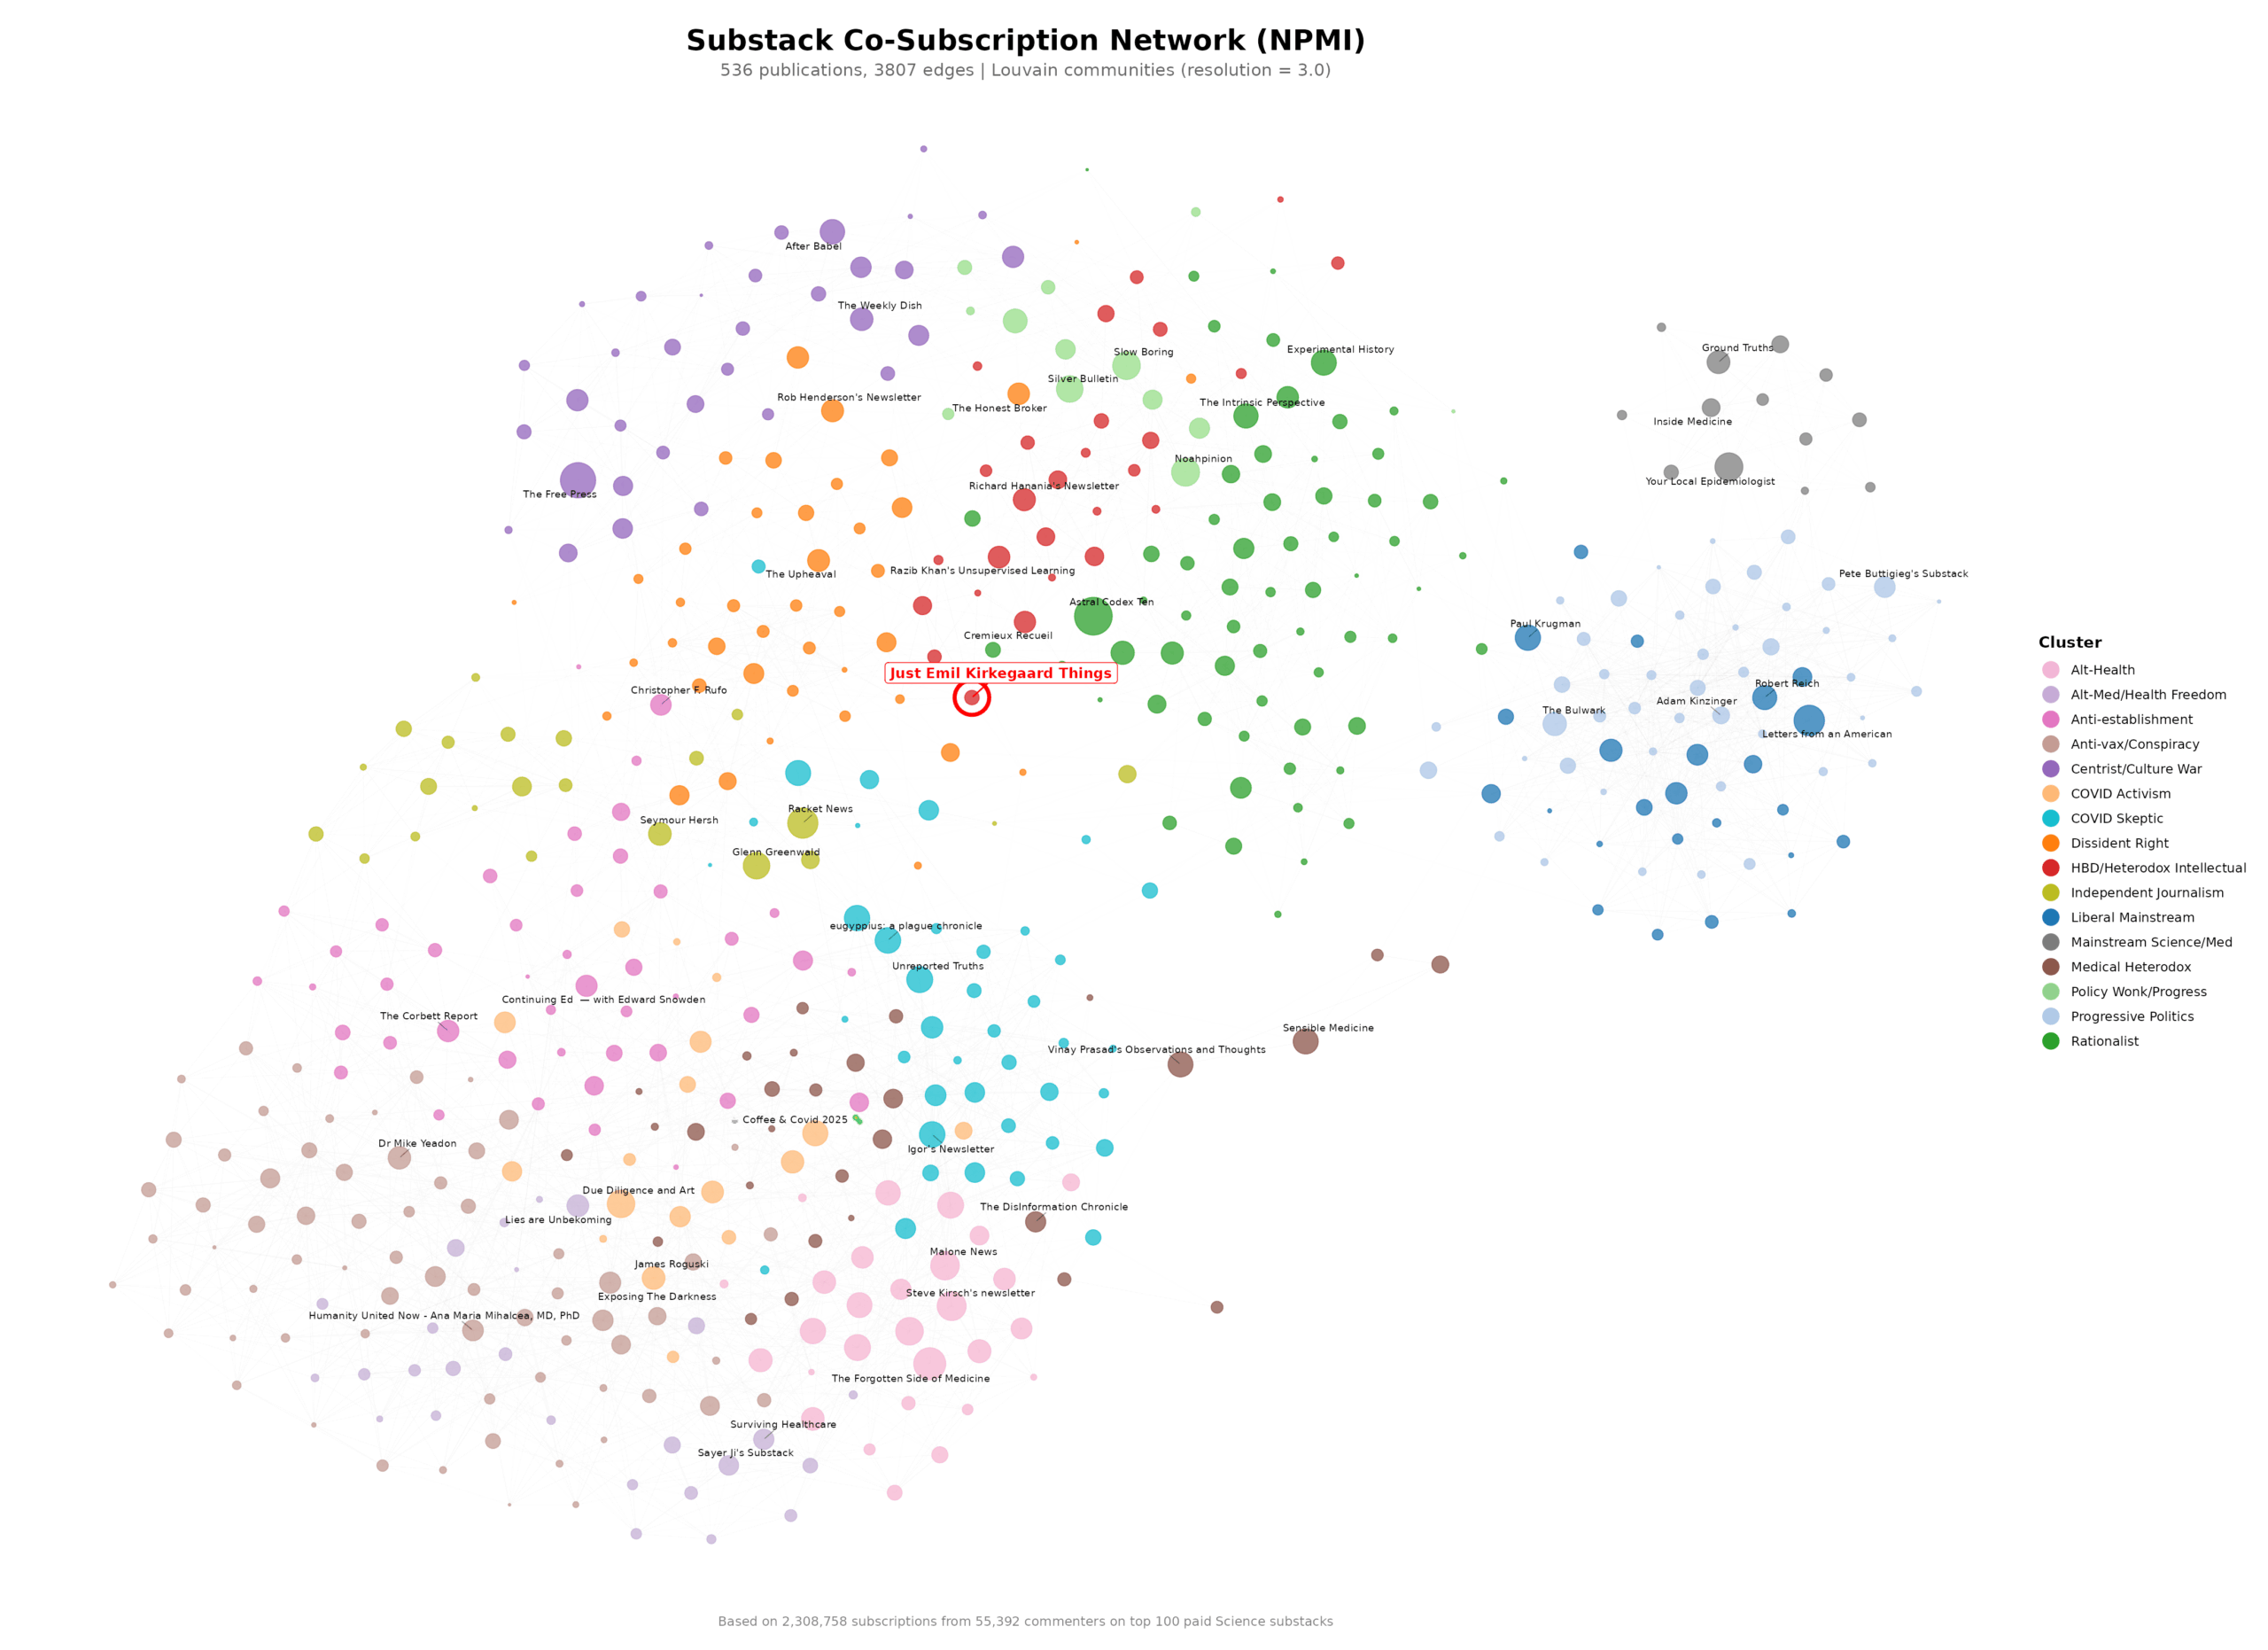
Yes, it is very small and hard to read. The labels are given by Claude based on largest blogs in each cluster. For the paying subscribers, there is an interactive version available so you can zoom in on whatever you want.