
What doesn't explain the post-COVID fertility decline?
Is there even anything to explain?

I've been writing about fertility for a while. Of recent interest is the COVID or post-COVID fertility decline. Birth Gauge compiles the most up to date TFR (total fertility rate) estimates, and they look like this for July 2025:

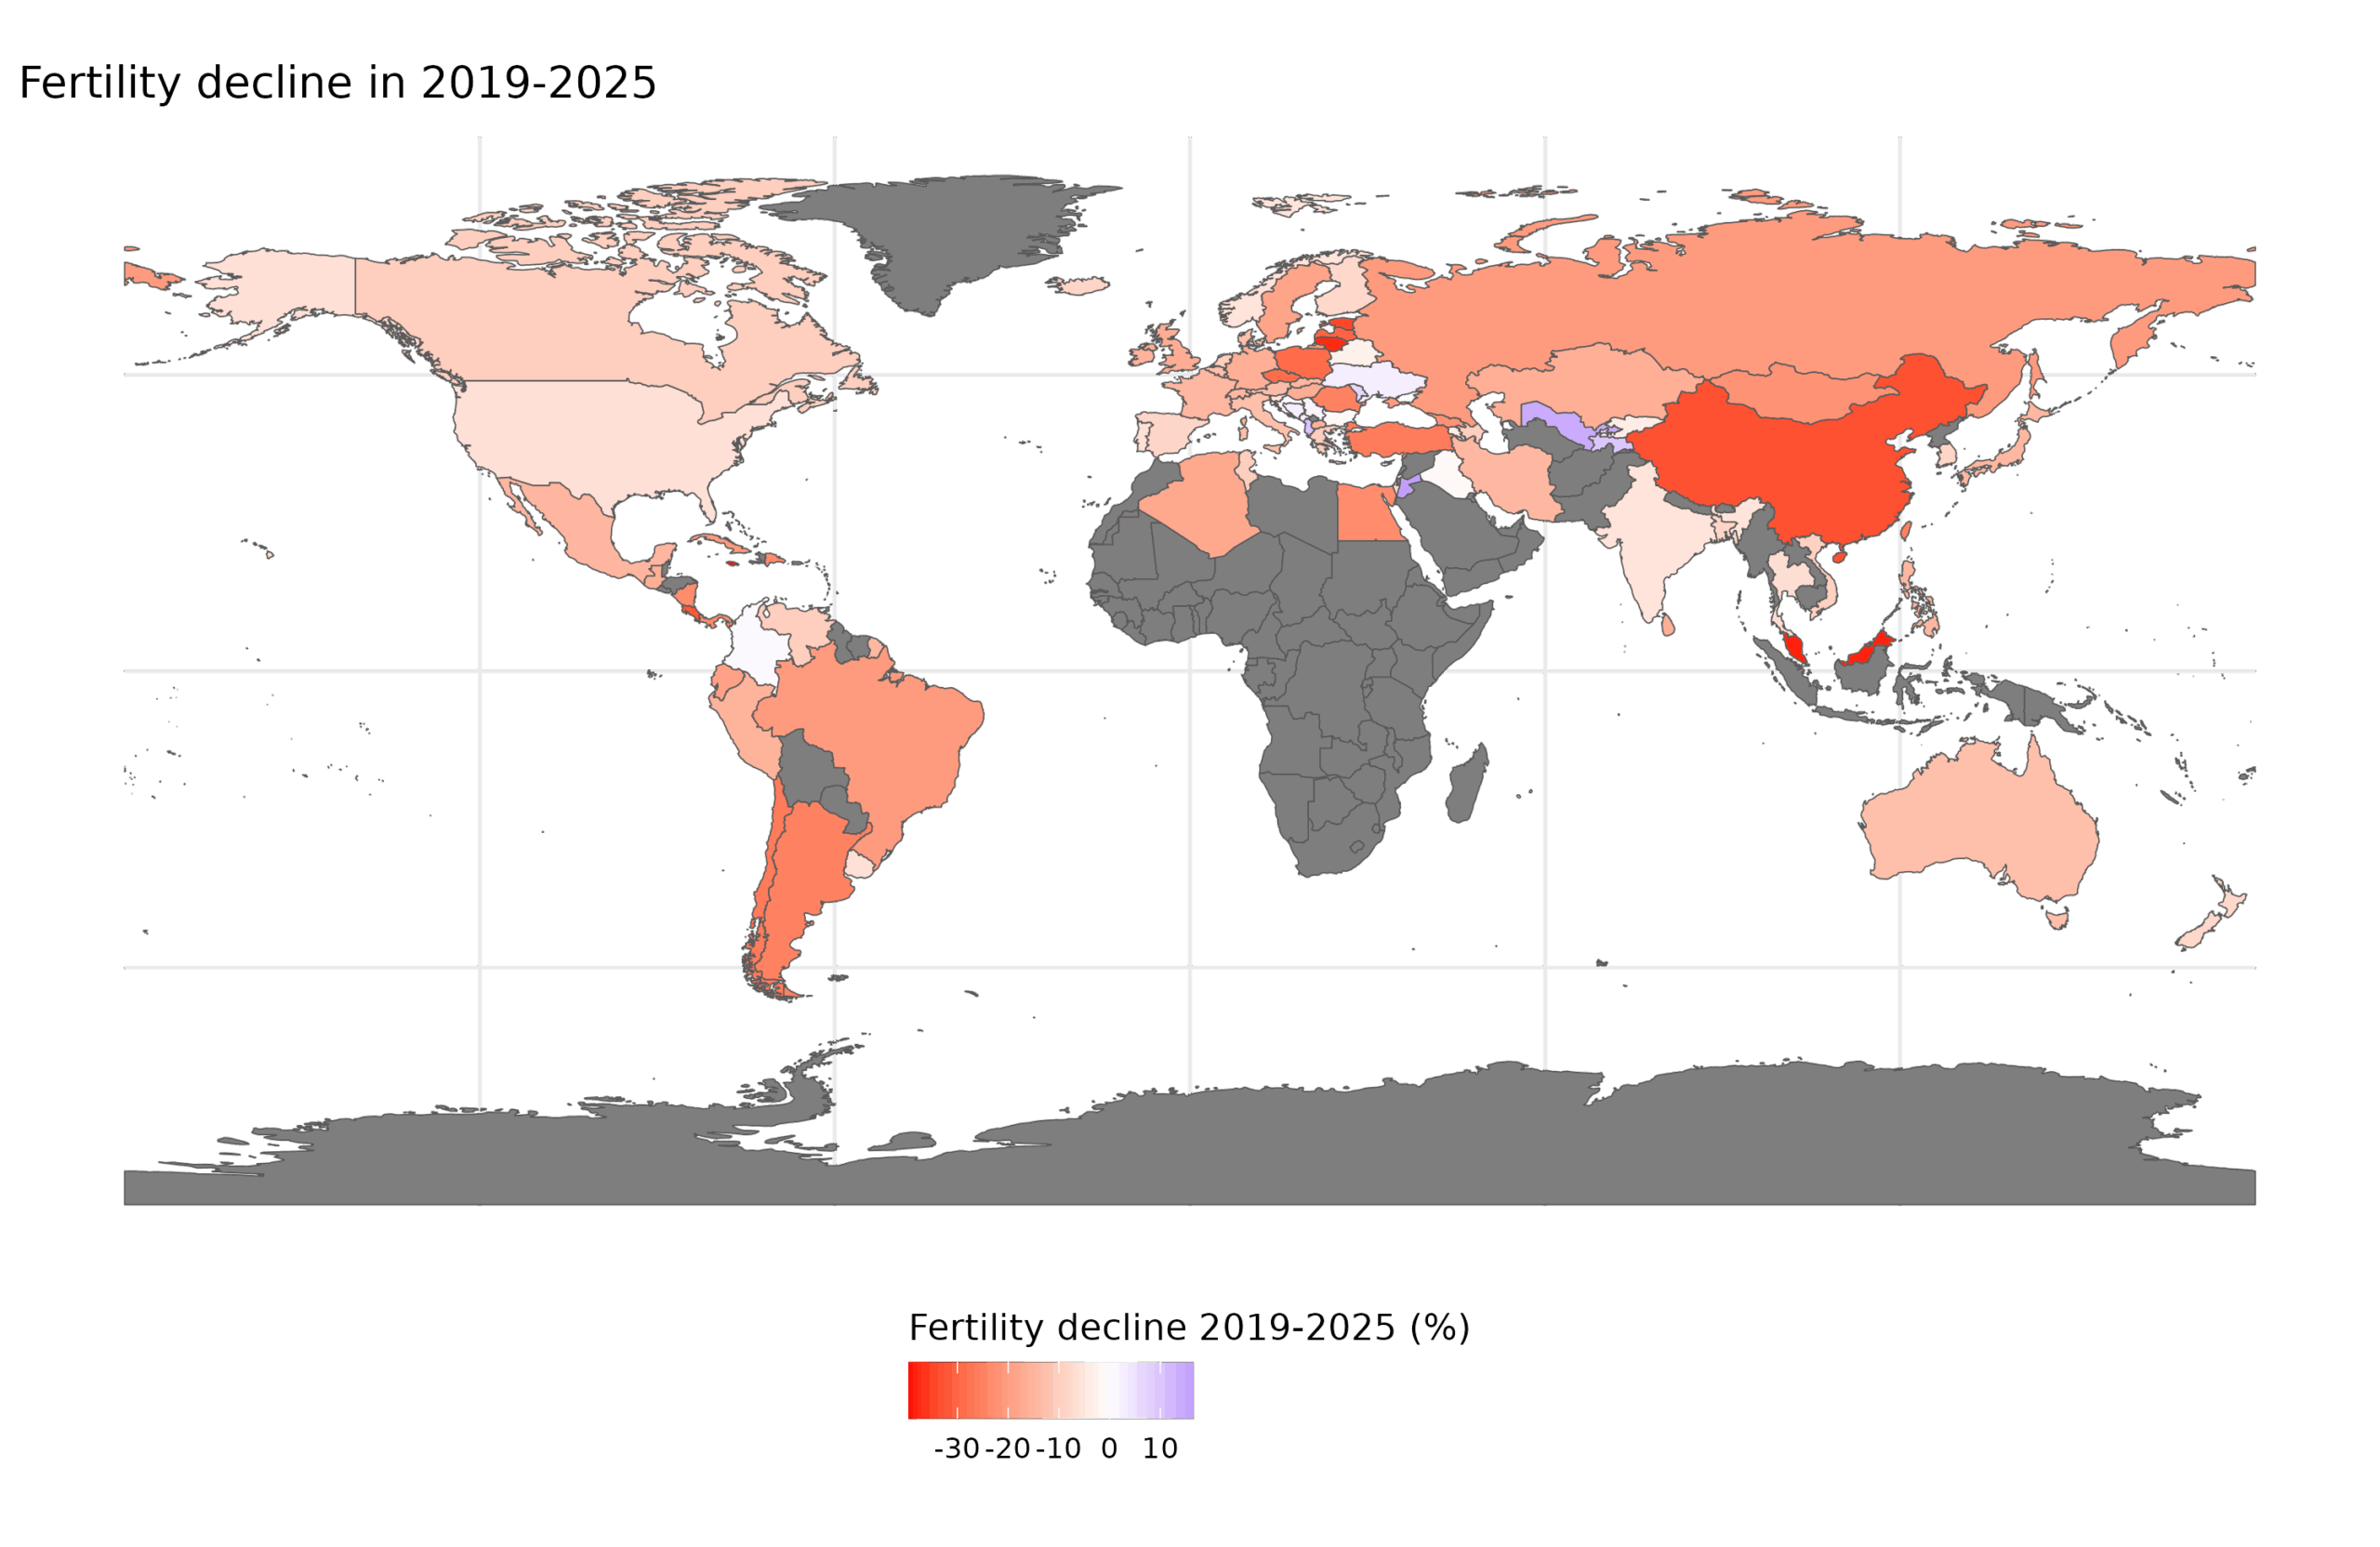
I had GPT4 convert the data to tabular format for loading into R. So let's just map the data and see if we can see any obvious patterns in relative decline. I am here interested in the post-COVID decline, so I calculated the percentage decline since 2019 (using TFR from OWID sourced from the UN). The map of decline:
The 2015 data covers only 92 countries, where the 2019-2023 data covers all 238 'countries' (which is about 200 + various colonies). Now what explains the quickened decline? Is there a quickened decline at all? The data is quite messy with many implausible values. For instance, supposedly in 1967 Romania had a 91% increase in fertility from 1.87 to 3.59. Actually, that one was real due to the communists banning contraception. Ok, so what about China in 1962 which saw a 58% increase (3.9 to 6.1)? Actually, that was real too, also because communists. Right, so maybe some of the booms are real, what about the biggest decline, North Korea in 1951? From 5.0 to 2.6? I don't know if it is real, but it is also on Wikipedia, and it was in the middle of a war related to, you guessed it, communists. OK, maybe the data are fine, at least from 1950 to now. Using the data I calculated the annual change, and the summary of the world is this:

Looking at the mean and medians, we get the overall world picture, which is roughly a worldwide mean (unweighted between countries) decline of 1.3%. Fertility was slowing its decline until the finance crisis of 2007, and things only got worse since then. There is a dip for 2022 (-2%), but it's not particularly noteworthy. Perhaps the 2023 time series ends too early, so we need to look at the partial 2025 data compiled by Birth Gauge. Looking at the map, we see that things are going particularly poorly in parts of East Europe and East Asia, so we might formula the "East"-in-the-name hypothesis, I guess (hopefully, data will be found for East Timor soon).
In any case, even though we don't see particular convince evidence of any extra fast post-COVID fertility decline worldwide (and more fancy modeing failed to detect any change in the slope), perhaps there is some heterogeneity we need to or can explain. The theories I've heard are:
COVID vaccines have some detrimental effects on fertility in some way or another (this doesn't look plausible based on early results).
COVID lockdowns interfered with pair bonding and thus eventually family formation, causing some delay and decline in fertility rates (but Sweden doesn't have a smaller decline than rest of the Nordics).
New addictive video entertainment sources such as TikTok came out, and these are so addictive people forego making families.
So to test these, I needed a measure of COVID vaccination coverage for fertile adults (say 18-45). I couldn't find this anywhere, but the total population % receiving a full dose is a sufficiently good proxy I think. The alternative is the number of shots per person (that I used previously to study the health benefits), which can fail as a proxy if old people are given 5 boosters while the 30 year olds are unvaccinated. For COVID lockdowns, there is a stringency measure that summarizes the various government efforts (school closings, bar closings, mandatory tests and so on). I didn't have any good data on use of additive short video services, so I will ignore them for now. So, here's the correlations for post-COVID decline:

The 2 different lockdown measures didn't differ much (r = 0.95), so their combined metric is fine (r's .98). The 2019-2025 decline shows some correlations with the putative predictors, but they aren't impressive:

Even without any controls, none of these reach even p<5%, the best being vaccine coverage, which is p=7%. Really, the best single predictor is just the world regions:
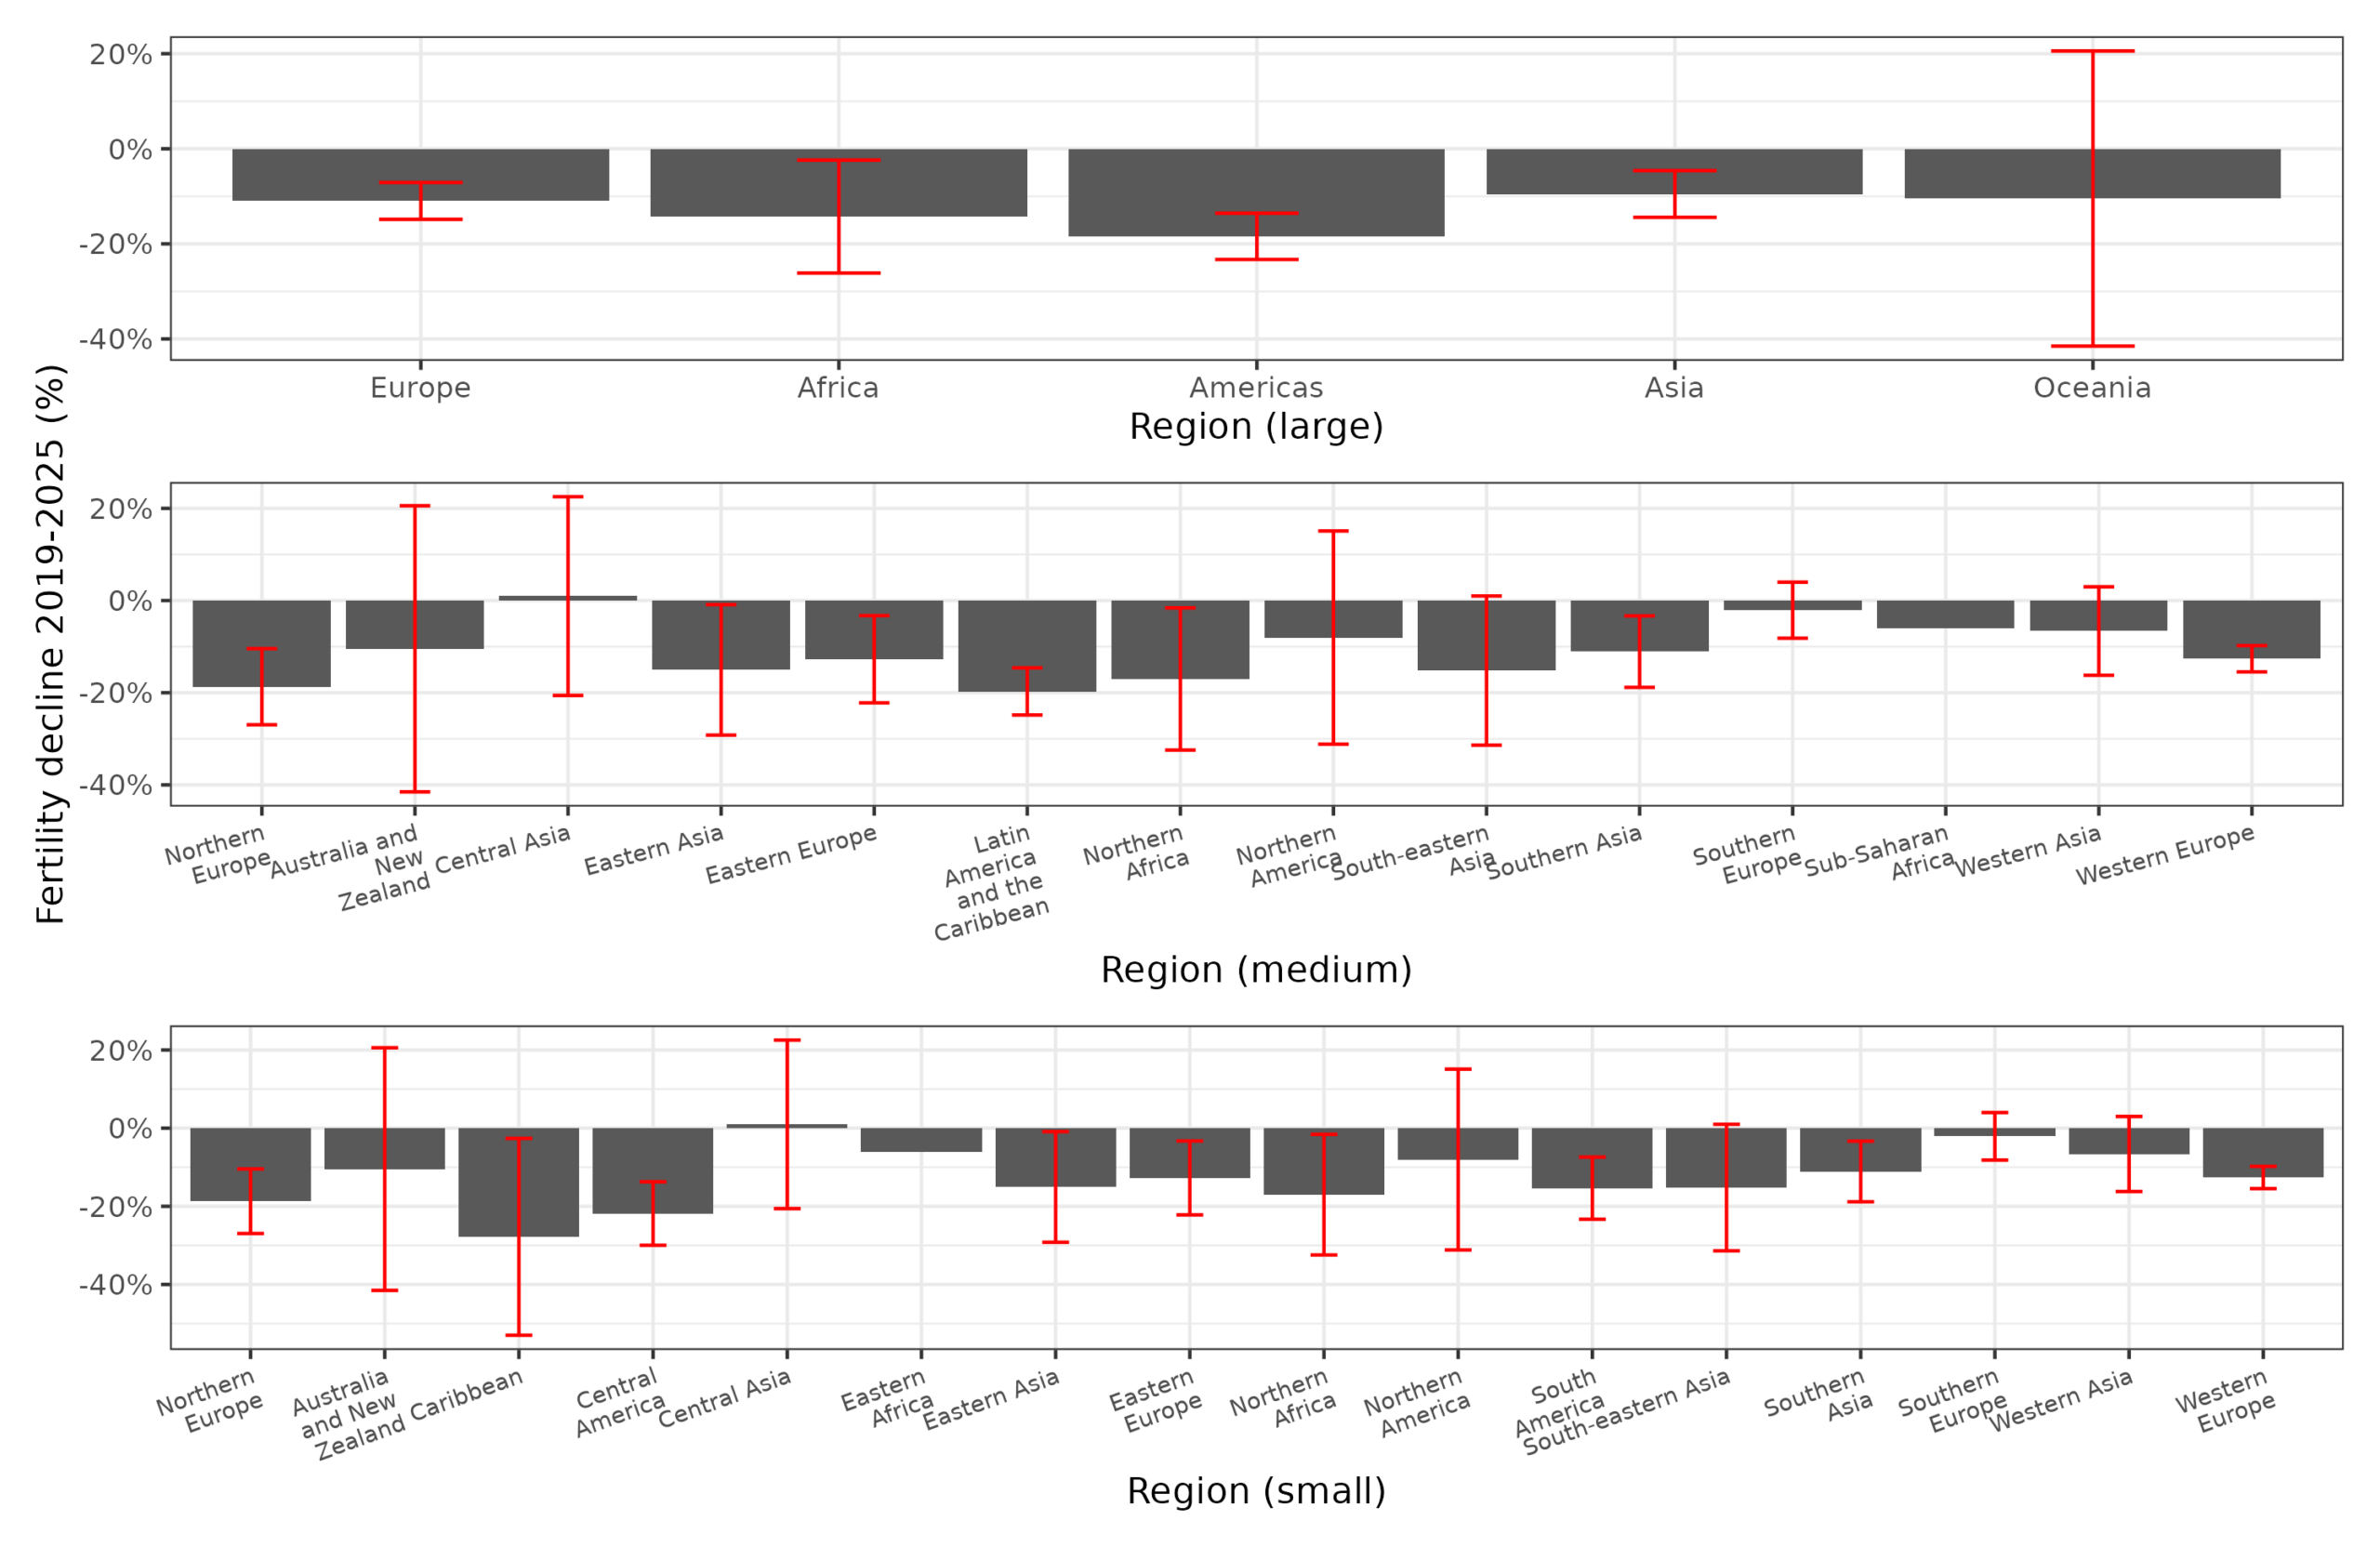
Nothing really stands out to the eye and the error bars, except maybe southern Europe having a minimal decline (already low fertility). The 'East' hypothesis was also debunked using the 2025 data. Finally, we can run some regressions to assure us that any signal isn't being hidden by other variables:

Models 1 and 3 is the explanatory variables with HDI as a control for country development. There's a slight signal (r²=4%) for the 2025 data but nothing else. Adding the world regions in models 2-4 shows some signal since some regions have less decline than northern Europe (the reference class). The model looks like this:
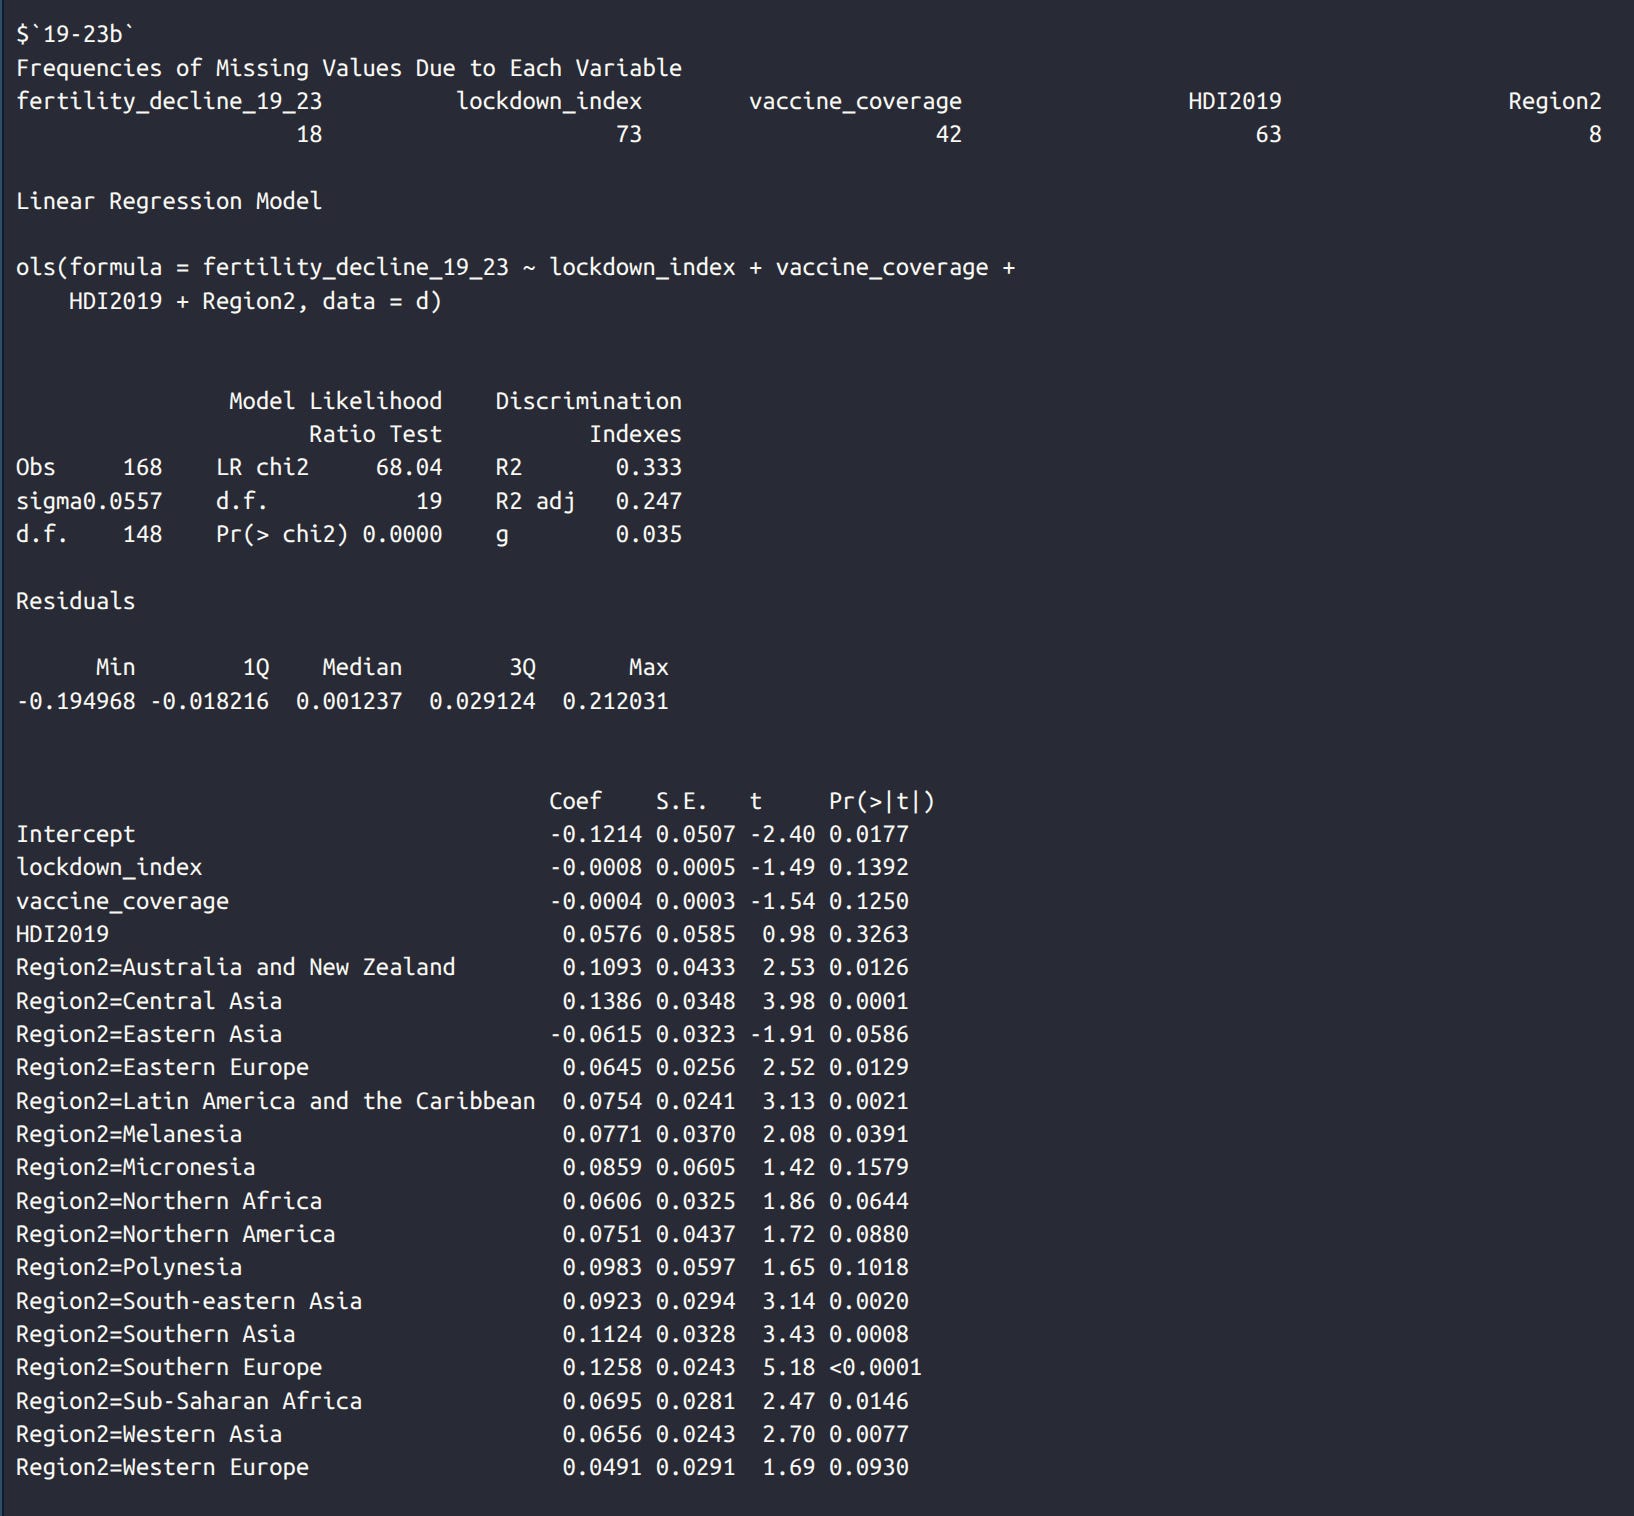
Finding such regional effects is unsatisfactory because they don't tell us anything in particular about the causes. It could be anything from the genetics of people in those regions, to local climate factors, or local wars, local culture, or anything really. Note that model 4 uses the larger continental regions because there are too few countries to use the smaller ones. One could edit the data a bit to modify them (merge regions with few countries) to make this possible, but it didn't seem like this would tell us anything more useful, so I didn't do this. Here's the model projections for the medium regions from model 2 (2019-2023):
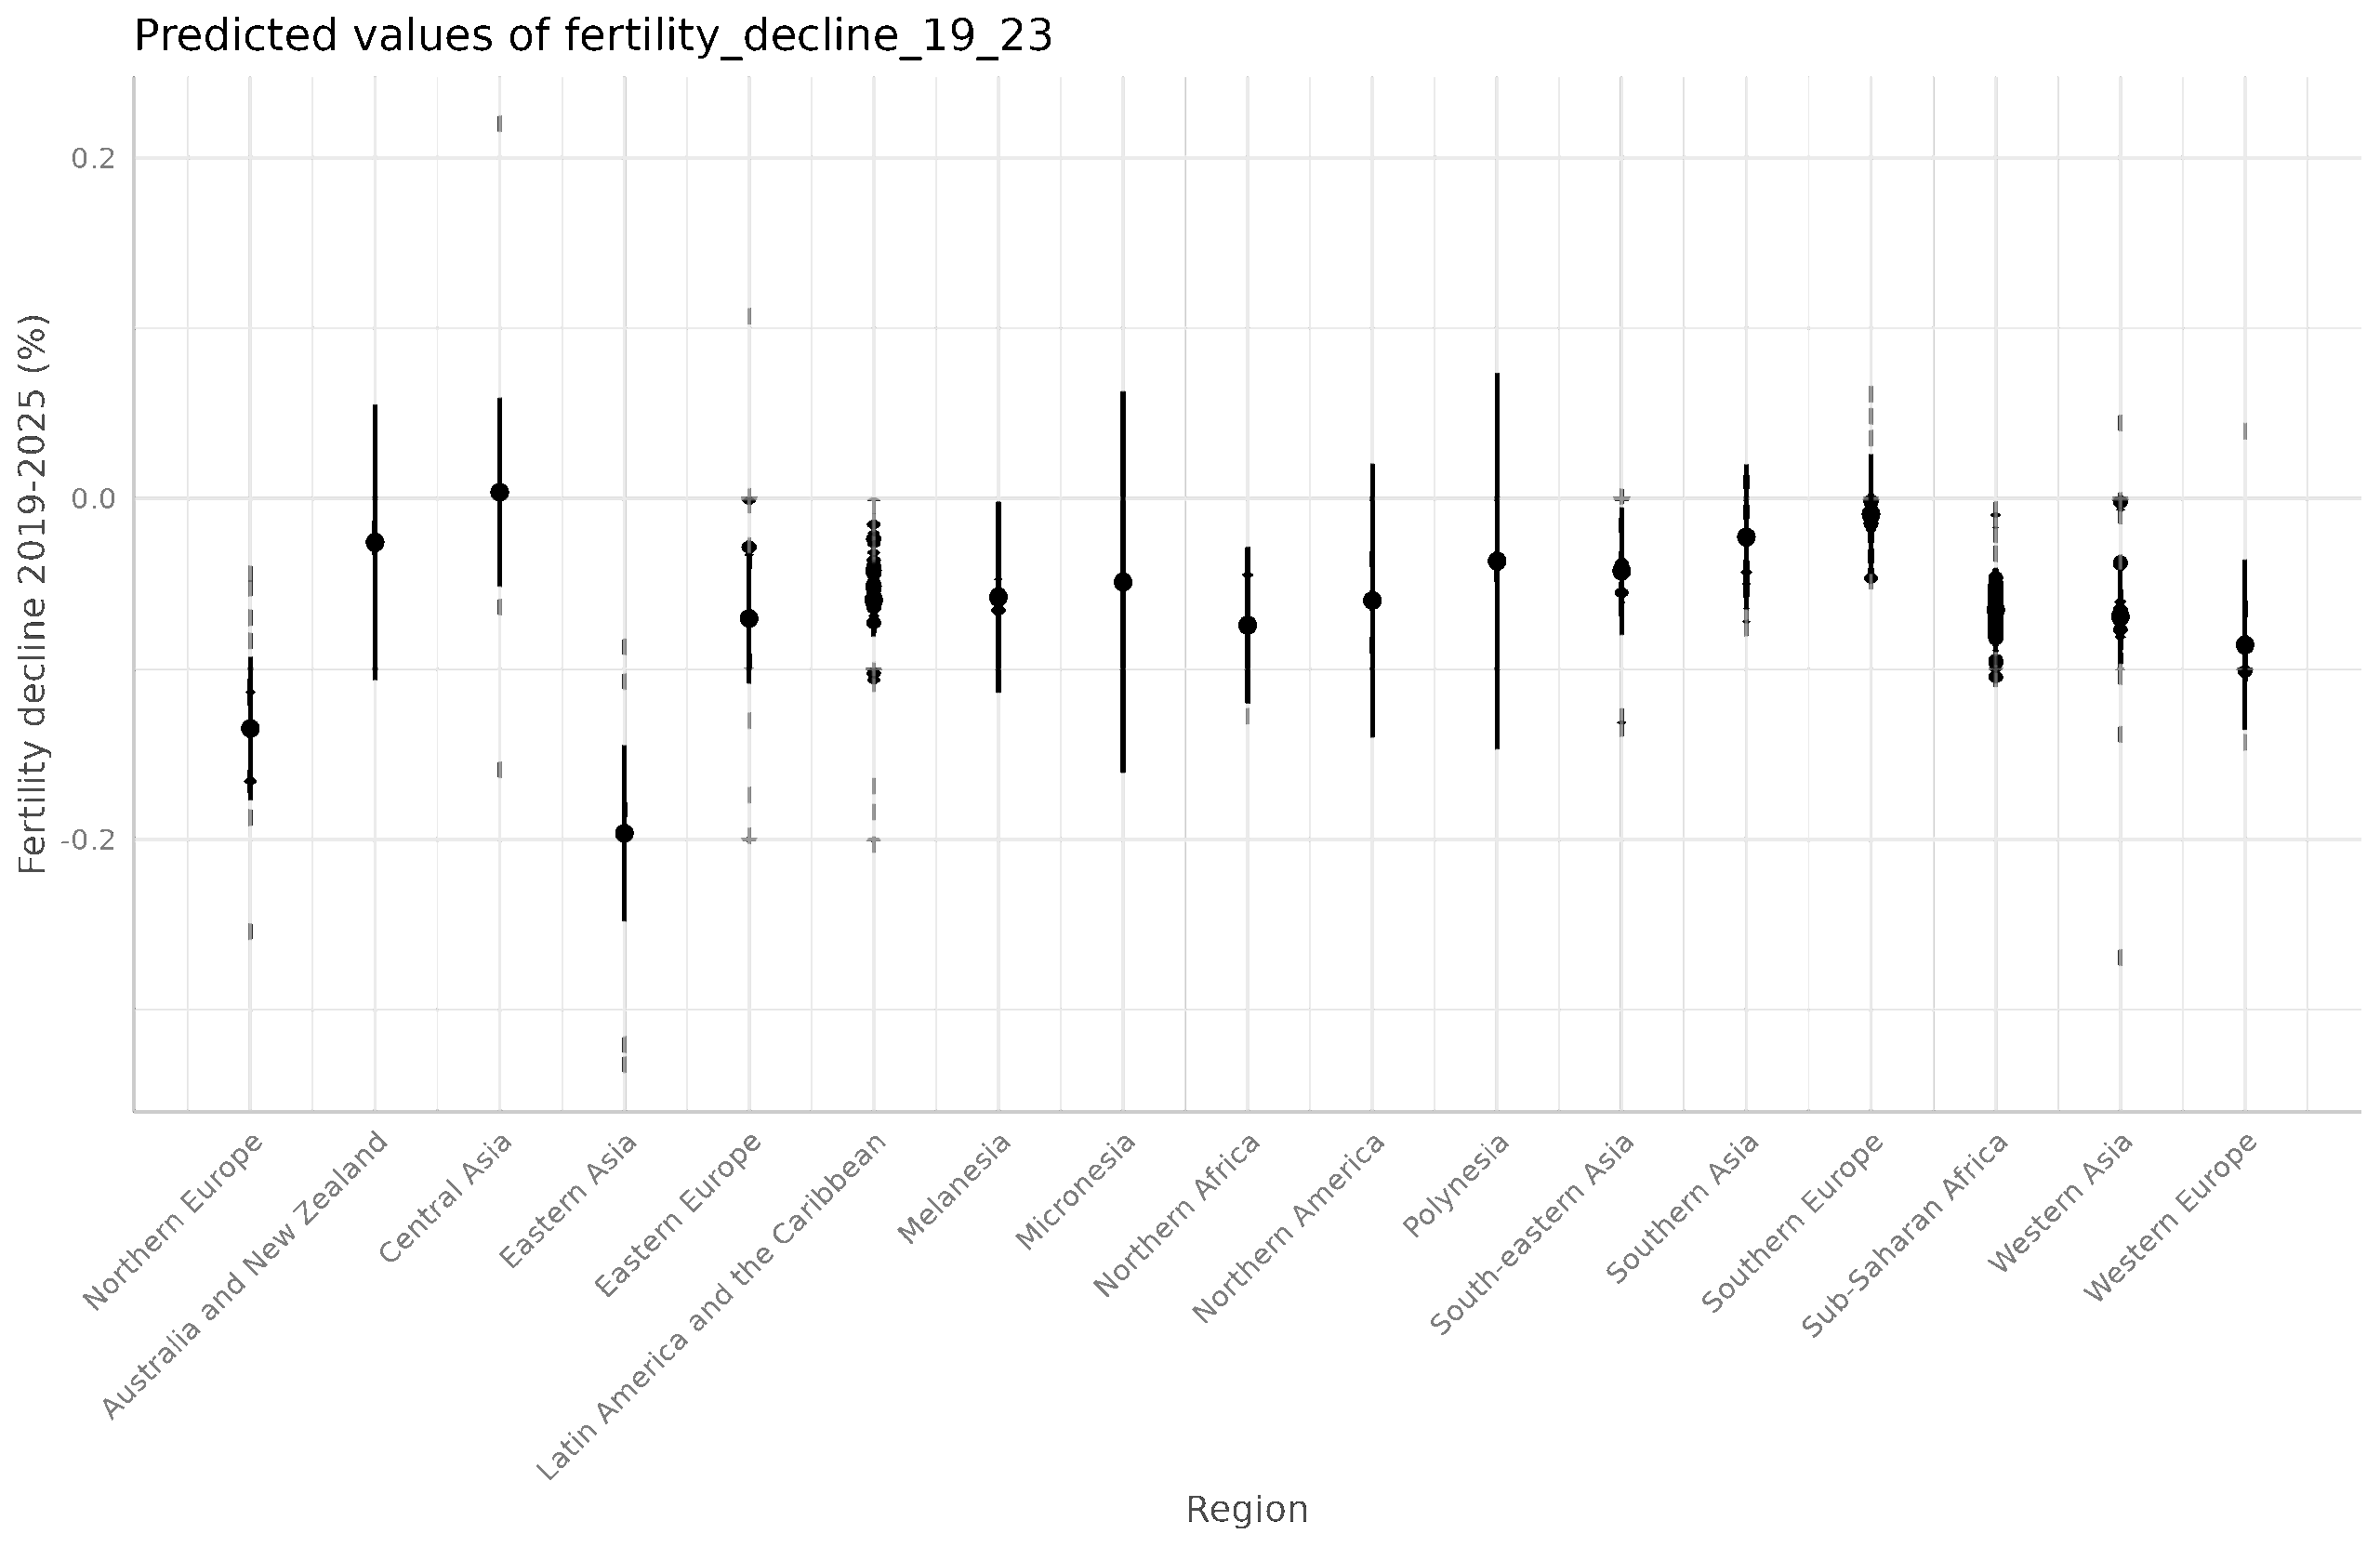
These just tell us the same thing as before, namely, that Eastern Asia and Northern Europe had stronger declines. This is unfortunate since these regions are very nice, but at least Southern Europe did fine (didn't decline much further, that is).
Finally, models 5-6 approach the situation from another perspective. Instead of trying to predict the change in fertility, we just try to predict the fertility in 2023 or 2025 using the same predictors as well as the 2019 fertility. This can be good to try because change scores can be problematic for statistical reasons. This of course results in a great model fit because fertility rates are highly stable (model r²'s 99% and 87%), but the explanatory variables didn't show anything of interest either. There aren't any obvious non-linear effects either, which we can see if we plot the 2019 vs. 2023/2025 fertilities:

The 2025 values are more noisy probably because the values are extrapolated based on the first few months of data for that country.
Overall then, the findings are:
There isn't any evidence of a strong post-COVID fertility decline globally speaking. This was the opposite of my opinion before examining the data! My mistake was probably thinking too much about the South Korean population doom.
COVID related variables don't predict variation in declining fertility, and neither does HDI. There are some regional differences of unknown cause with larger declines in Northern Europe and East Asia.
It appears to be a collapse in dating and new marriages in some countries: https://swprs.org/covid-vaccines-and-fertility-2/. New marriages declined massively in some countries.
Naomi Wolf has referred to a higher miscarriage rate amongst vaccinated women compared to unvaccinated in different countries.