
What makes a good computer game?
An analysis of 60k Steam game ratings

What makes a better computer game? While we can discuss game design (e.g. I studied skill vs. randomness before), we can also take an empirical approach. What we need is a large number of games, their features, and their ratings. I stumpled upon this video analyzing the games on Steam (Valve's platform, the largest):
Helpfully, he released all the data on Github (data covers until October 2024), so you can download them too. His video covers the scraping and data exploration, so I'll skip it here. It should also be noted that others also scraped Steam and analyzed but it was a longer time ago or are paywalled.
One issue he didn't discuss is that steam ratings cannot be taken at face value due to sampling error. On Steam, ratings are binary: either you like a game or dislike it (vote up/down). The proportion of likes to total, proportion of up votes is the obvious score. However, this works poorly for games with few ratings. In the trivial case of games with 1 rating, they either achieve a score of 1 or 0. If we ranked all games solely based on this approach, all the top games would be those with only a few ratings, mostly 1 rating. This is the same issue as when I looked at rates of top movies by country, top sportsball players, or any other count-based score with a low frequency (e.g. rare cancers or violent crime in subnational units). The website SteamDB offers an up-to-date ranking of all games:

Most of these will probably be familiar to the gamers among you (unless you have bad taste!). However, these aren't the top rated games according to the naive approach. Rather, the scores have been adjusted. The method they use is curious. As far as I can retrace the internet history for this:
2009: Evan Miller discusses why the average score is a bad estimate for sorting purposes. He proposes that people calculate a confidence interval ("Wilson's score") and use the lower bound.
2014: Someone writes a commentary on this, proposing another method.
2017: SteamDB has been using the lower bound CI for years, but a Reddit poster comes up with a new method, and SteamDB changes to it.
SteamDB's blogpost explains their reasoning and method:
I looked over some alternatives, including Wilson's formula that SteamDB used, but I didn't quite like any of them. Some sites seemed to have pretty good sorting formulas, but what exactly those formulas were not disclosed. So, I sat down to create my own, starting with trying to word the rules by which Steam's games should be sorted.
Games with more reviews should have an adjusted rating that is closer to their real rating, because the more reviews we have, the more certain we are that the score they give us is correct.
All ratings should be biased towards the average rating — 50%.
And that's all, really. It just needs to be a little more precise: “For every 10x the reviews we have, we should be 2x more certain that the rating is correct.” Almost good, but I can't quite figure out what “2x more certain” means. But it sounds like it should be equivalent to “2x less uncertain”, and I can work with that.
Clearly at 0 reviews we're 100% uncertain as to what the rating should be. Let's stretch that a bit and say that we're 100% uncertain at even just 1 review, then we can apply the earlier thought. So at 10 reviews we should be 2x less uncertain, that is 50% uncertain. At 100 reviews, 25%. 1000 reviews, 12.5%, and so forth.
So given a game with 100 reviews of which 90% are positive, we're 25% uncertain that this 90% is the correct rating. So we're 75% certain that it is the correct rating. In other words, 75% of the final rating is 90%, and the other 25% is the average rating of 50%, which also nicely fits with our second rule. This gives us a final rating of 75% * 90% + 25% * 50% = 80% This looks good, and these rules can be translated into a formula that gives us the adjusted rating with respect to the number of reviews and the “real rating”.

Readers of this blog will hopefully notice that this is a reinvention of the Bayesian wheel, a kind of pseudo-Bayesian approach. First off, the prior is set to 0.5, apparently assuming an uninformative uniform distribution (or other distribution with mean at 0.5). In fact, this prior is quite wrong:

The average rating for games is about 77%, not 50%. This is typical of ratings data, as e.g. IMDB ratings don't have a mean of 5.5 despite being on a 1-10 scale. This may reflect self-selection bias to some extent since movie watchers and gamers don't watch stuff at random, but stuff they expect to like, so maybe the real means would be at the midpoint were it not for this selection bias. The curious curved lines are there for mathematical reasons. A game with 10 ratings cannot have scores other than [0, 0.1, ... 0.9, 1]. If you look at 1e+01 (10) on X axis, you can see that all games have average ratings in this set. Similarly, for the trivial case of n=1 rating, the only options are [0, 1]. This minimum granularity is in fact used in statistics to find scientific papers with impossible values for fraud or other anomaly detection (GRIM, GRIMMER, SPRITE). If a study reports that the % of male in a sample of 35 students was 30%, we know something is wrong because this isn't possible to achieve (10/35 = 28.6%, 11/35 = 31.4%).
Anyway, back to the ratings. The more sensible way here is to use an actual Bayesian method. As a matter of fact, estimating proportions correctly based on sparse data is of interest in many areas of life, including baseball. If a rookie only gets 3 chances to hit, but he hits all of them, his batting average is 100%, better than the best players. However, it would be unwise to immediately sign him on with a big contract because we should immediately realize he was merely lucky. Similarly, a player who hits 0/3 should be not immediately discarded. So we should take into account the likely performance of any given player (the prior) and add this information to their (so far) revealed data. David Robinson wrote a blogpost in 2015 about this scenario, using a Bayesian method called empirical Bayes. Normally, with Bayesian statistics, a reasonable prior is revealed to you in a dream, but with empirical Bayes, you just estimate the prior from the data itself. Using this adjusted estimate of the mean score for all games with any data (90k), we get this:
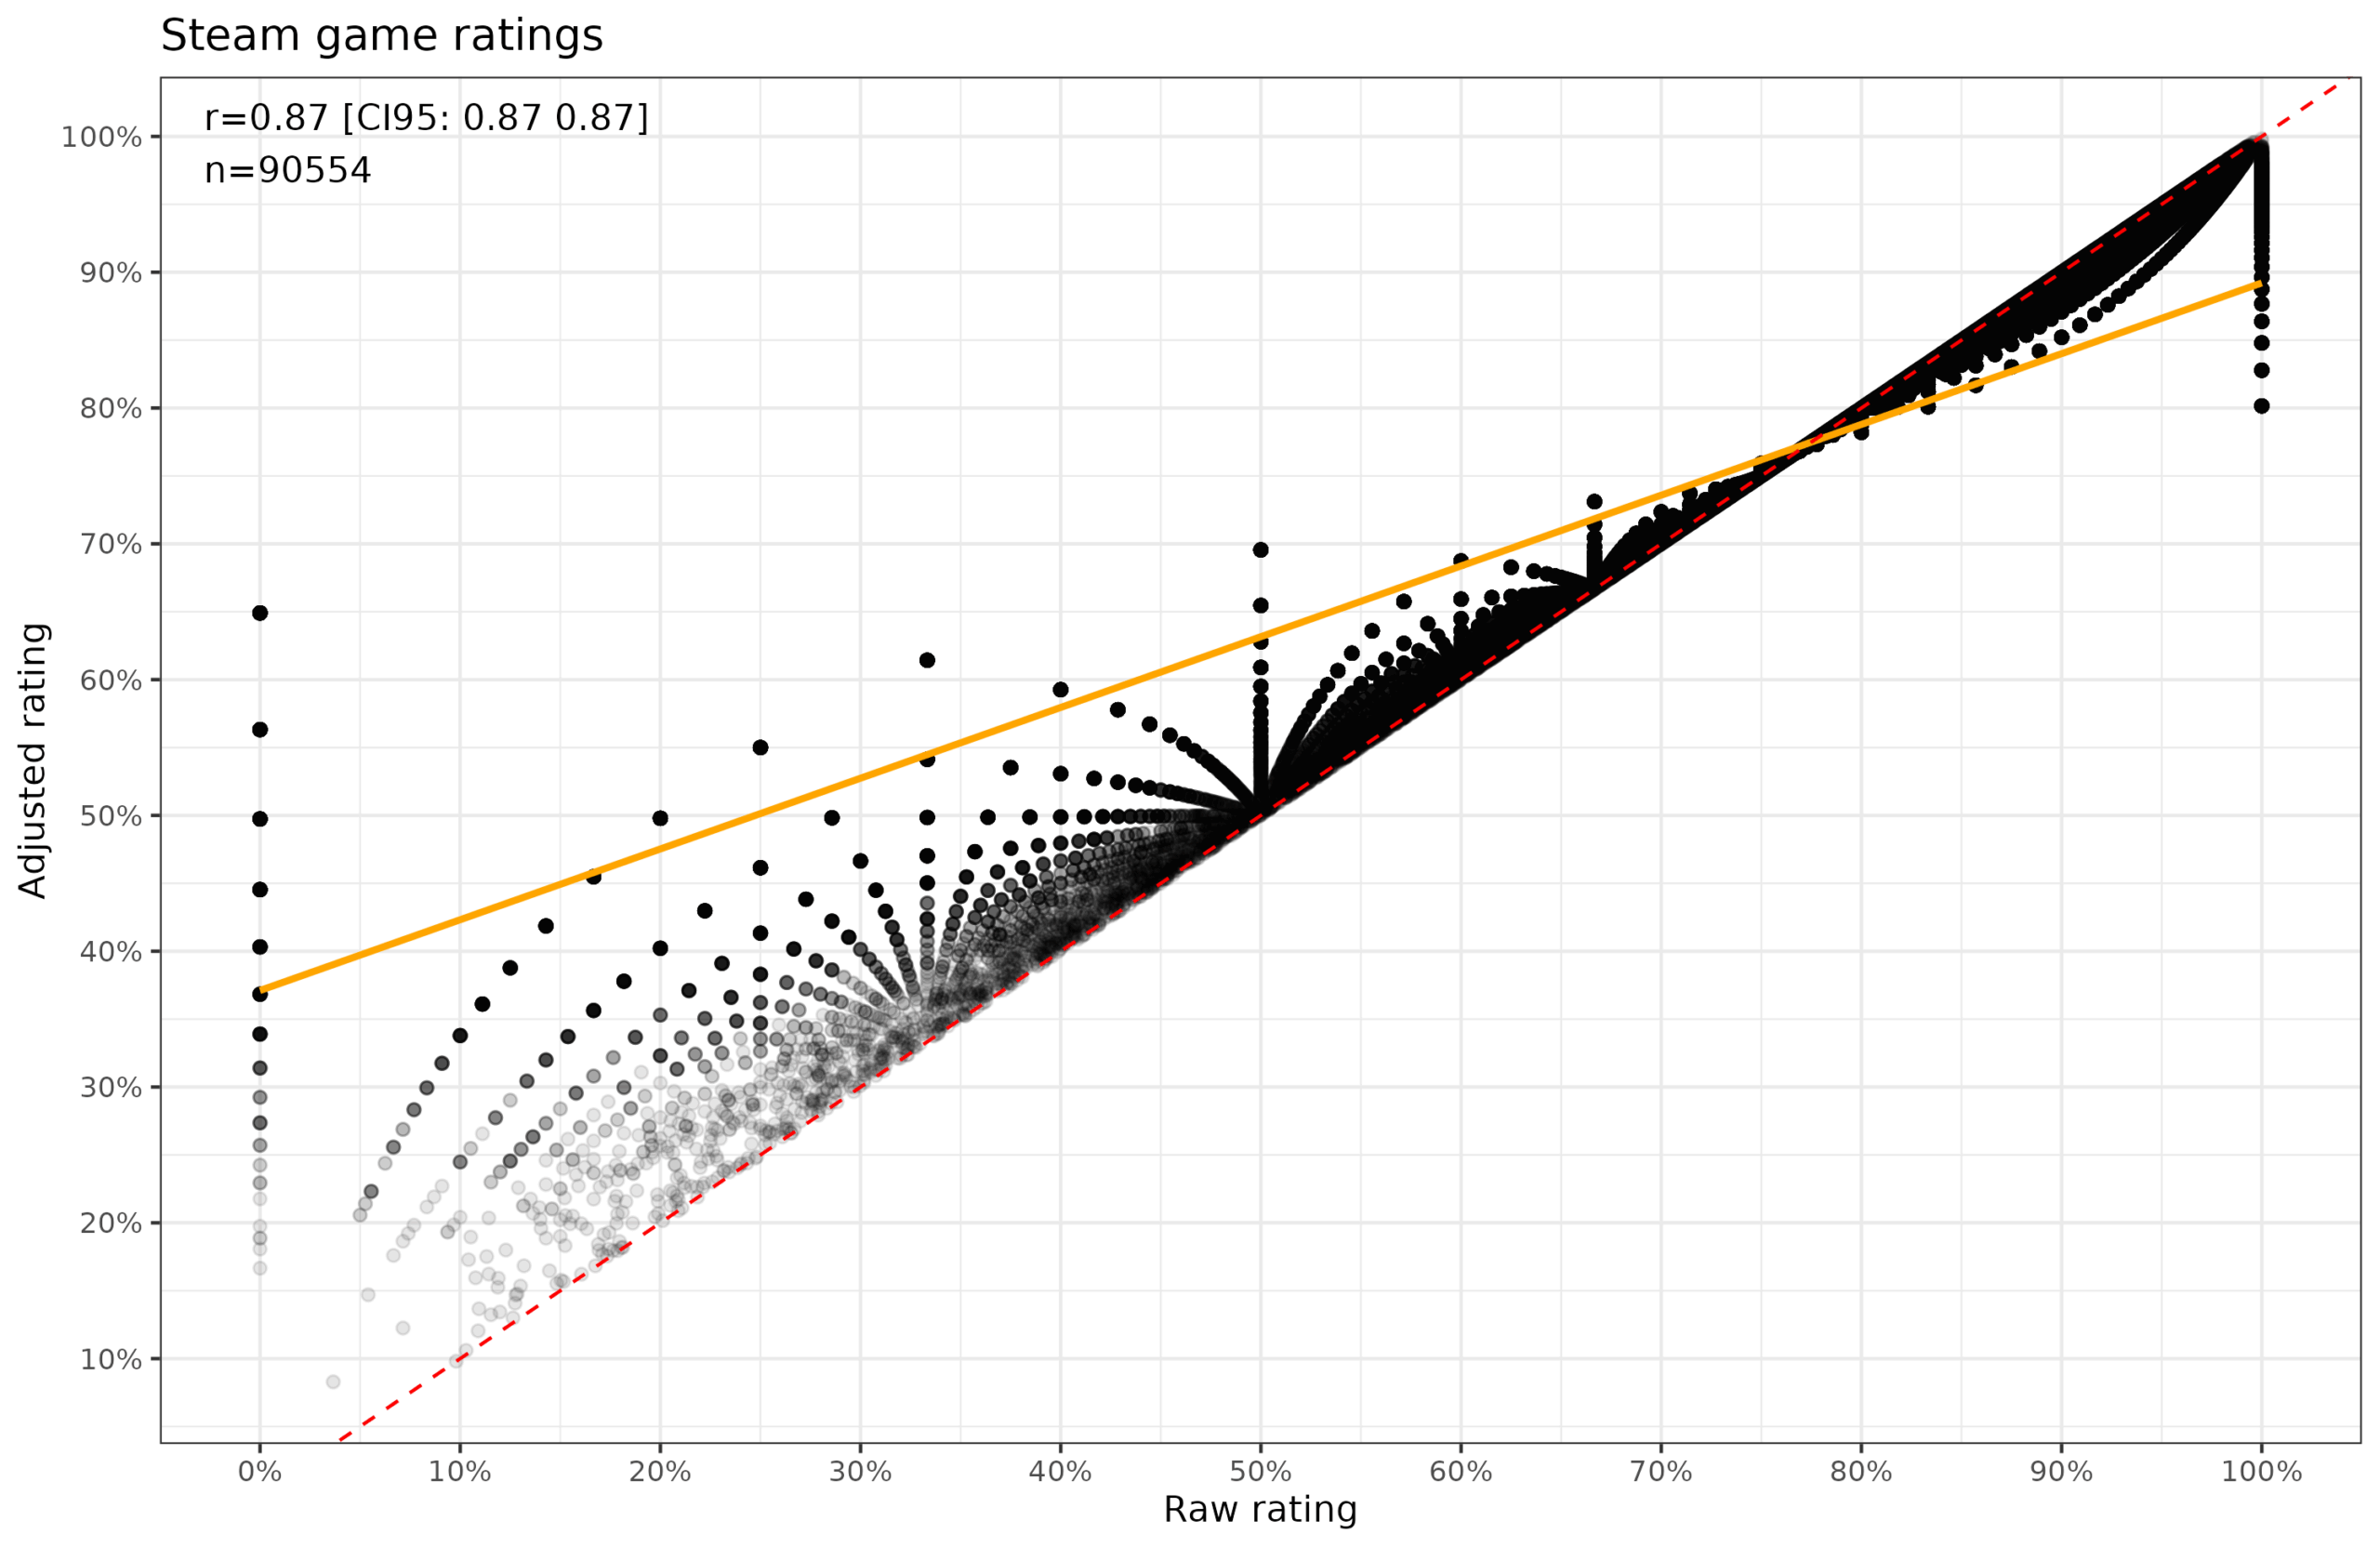
Thus, the games with an initial mean score of 0% have been moved upwards (leftmost dots) depending on how many datapoints they are based on. Similarly, those with perfect scores based on few datapoints are moved down a bit for the same reason. Thus, a game with only 1 rating, achieves an adjusted mean rating of either 0.649 or 0.802.
There are still issues left because the Bayesian model assumes a constant prior, whereas we see in the plot that games with many reviews have higher means. This is presumably because gamers choose to buy and play better games overall, however, it can also be self-selection in people choosing to play games they would personally like. It is possible to model this as well, but in Robinson's blogpost, this made little difference, so I didn't bother. There are also some games with fraudulent reviews. One game achieved a score of 100% based on 727 ratings. Applying your own informative prior, you might guess that this is either Indian or Chinese, and you would be right (it's Chinese). On the other hand, maybe it is just good (It's a hot girlfriend who drinks beer with you-simulator). I am not sure we can find a purely statistical way to remove fraudulent data (I would check whether the game has the appropriate level of attention on other platforms, and if not, discard the data).
I filtered out the games with less than 10 reviews (60k), and moved on to predicting game ratings. First off, we have release date:
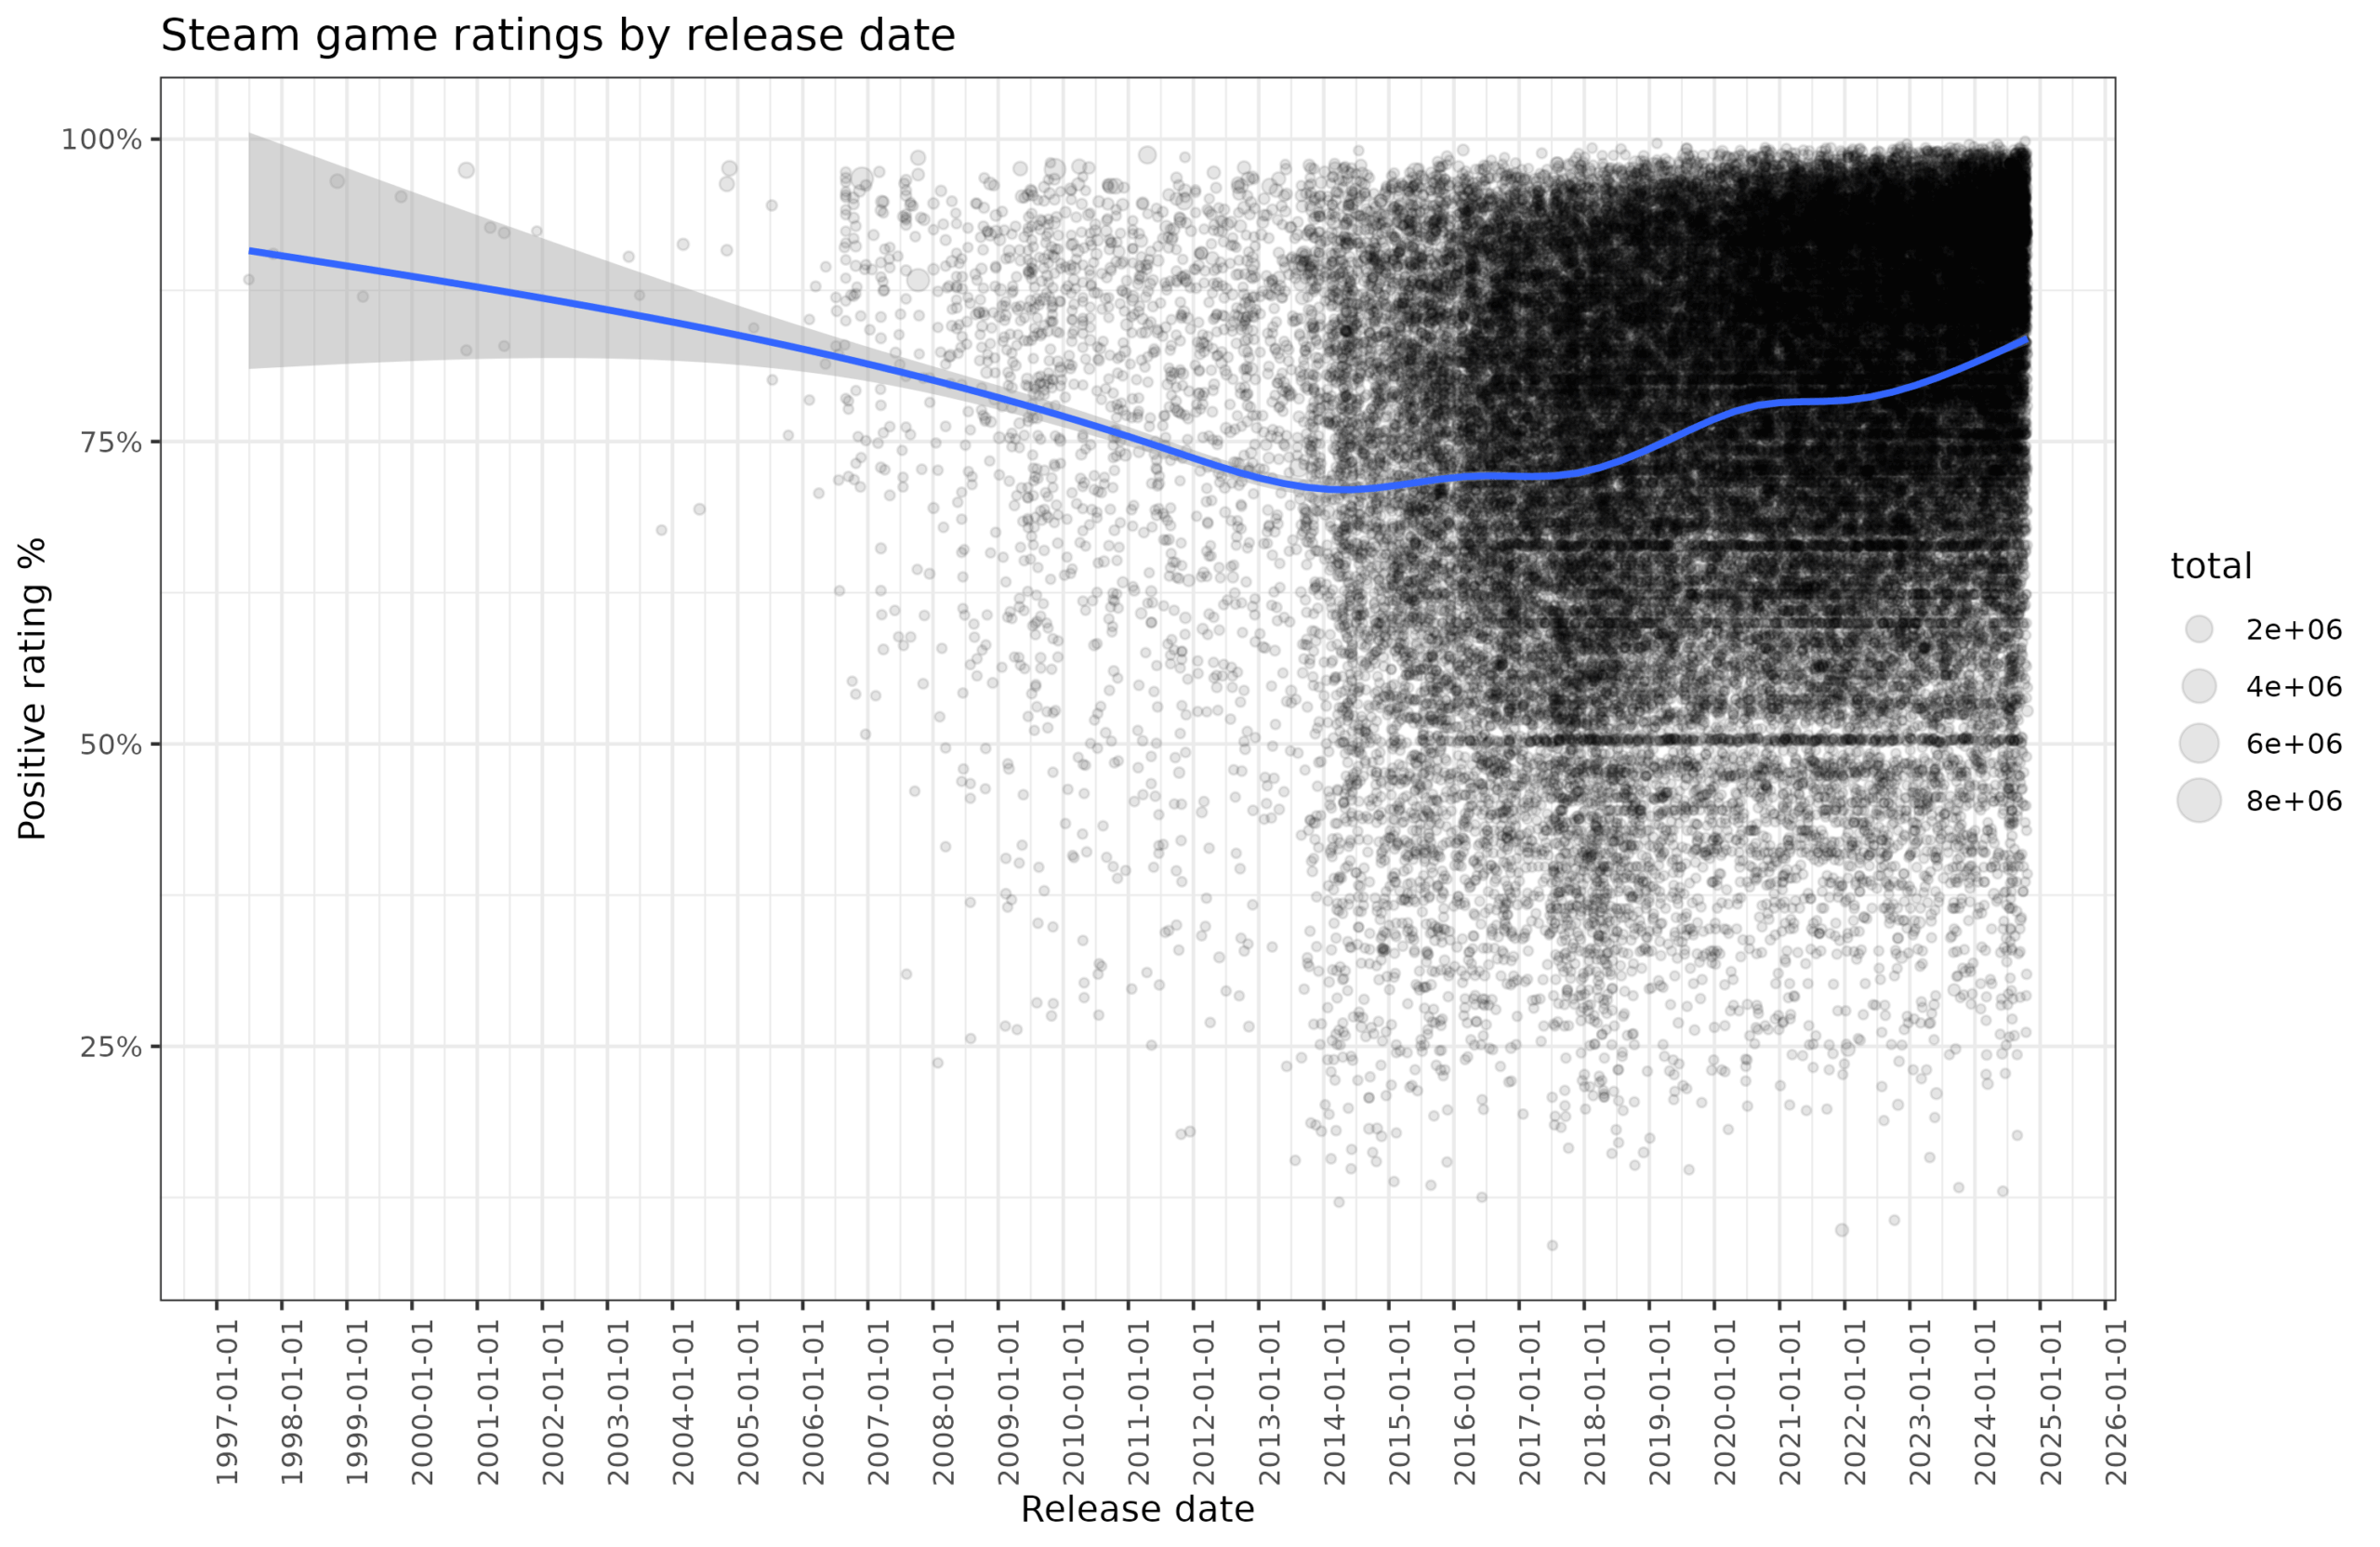
It appears that old games were really just better, but also that newer games are getting better, and the worst games are from around 2014. However, since Steam only launched in 2003 with Valve's own games (especially Counter-Strike), the games from before that must have been added retroactively. My guess for the left side declining pattern is that no one bothers to add old games to Steam unless they are particularly good and can be sold (again). For newer games, my hunch is that newer games really are better because technology improved, both in terms of making games visually appealing and also in terms of making it easier to build them. The latter is important because that is what allows many games to be made by small teams. In fact, of the highest rated games, about half are made by small teams ("indie").
Next up, let's explore the tags for games:
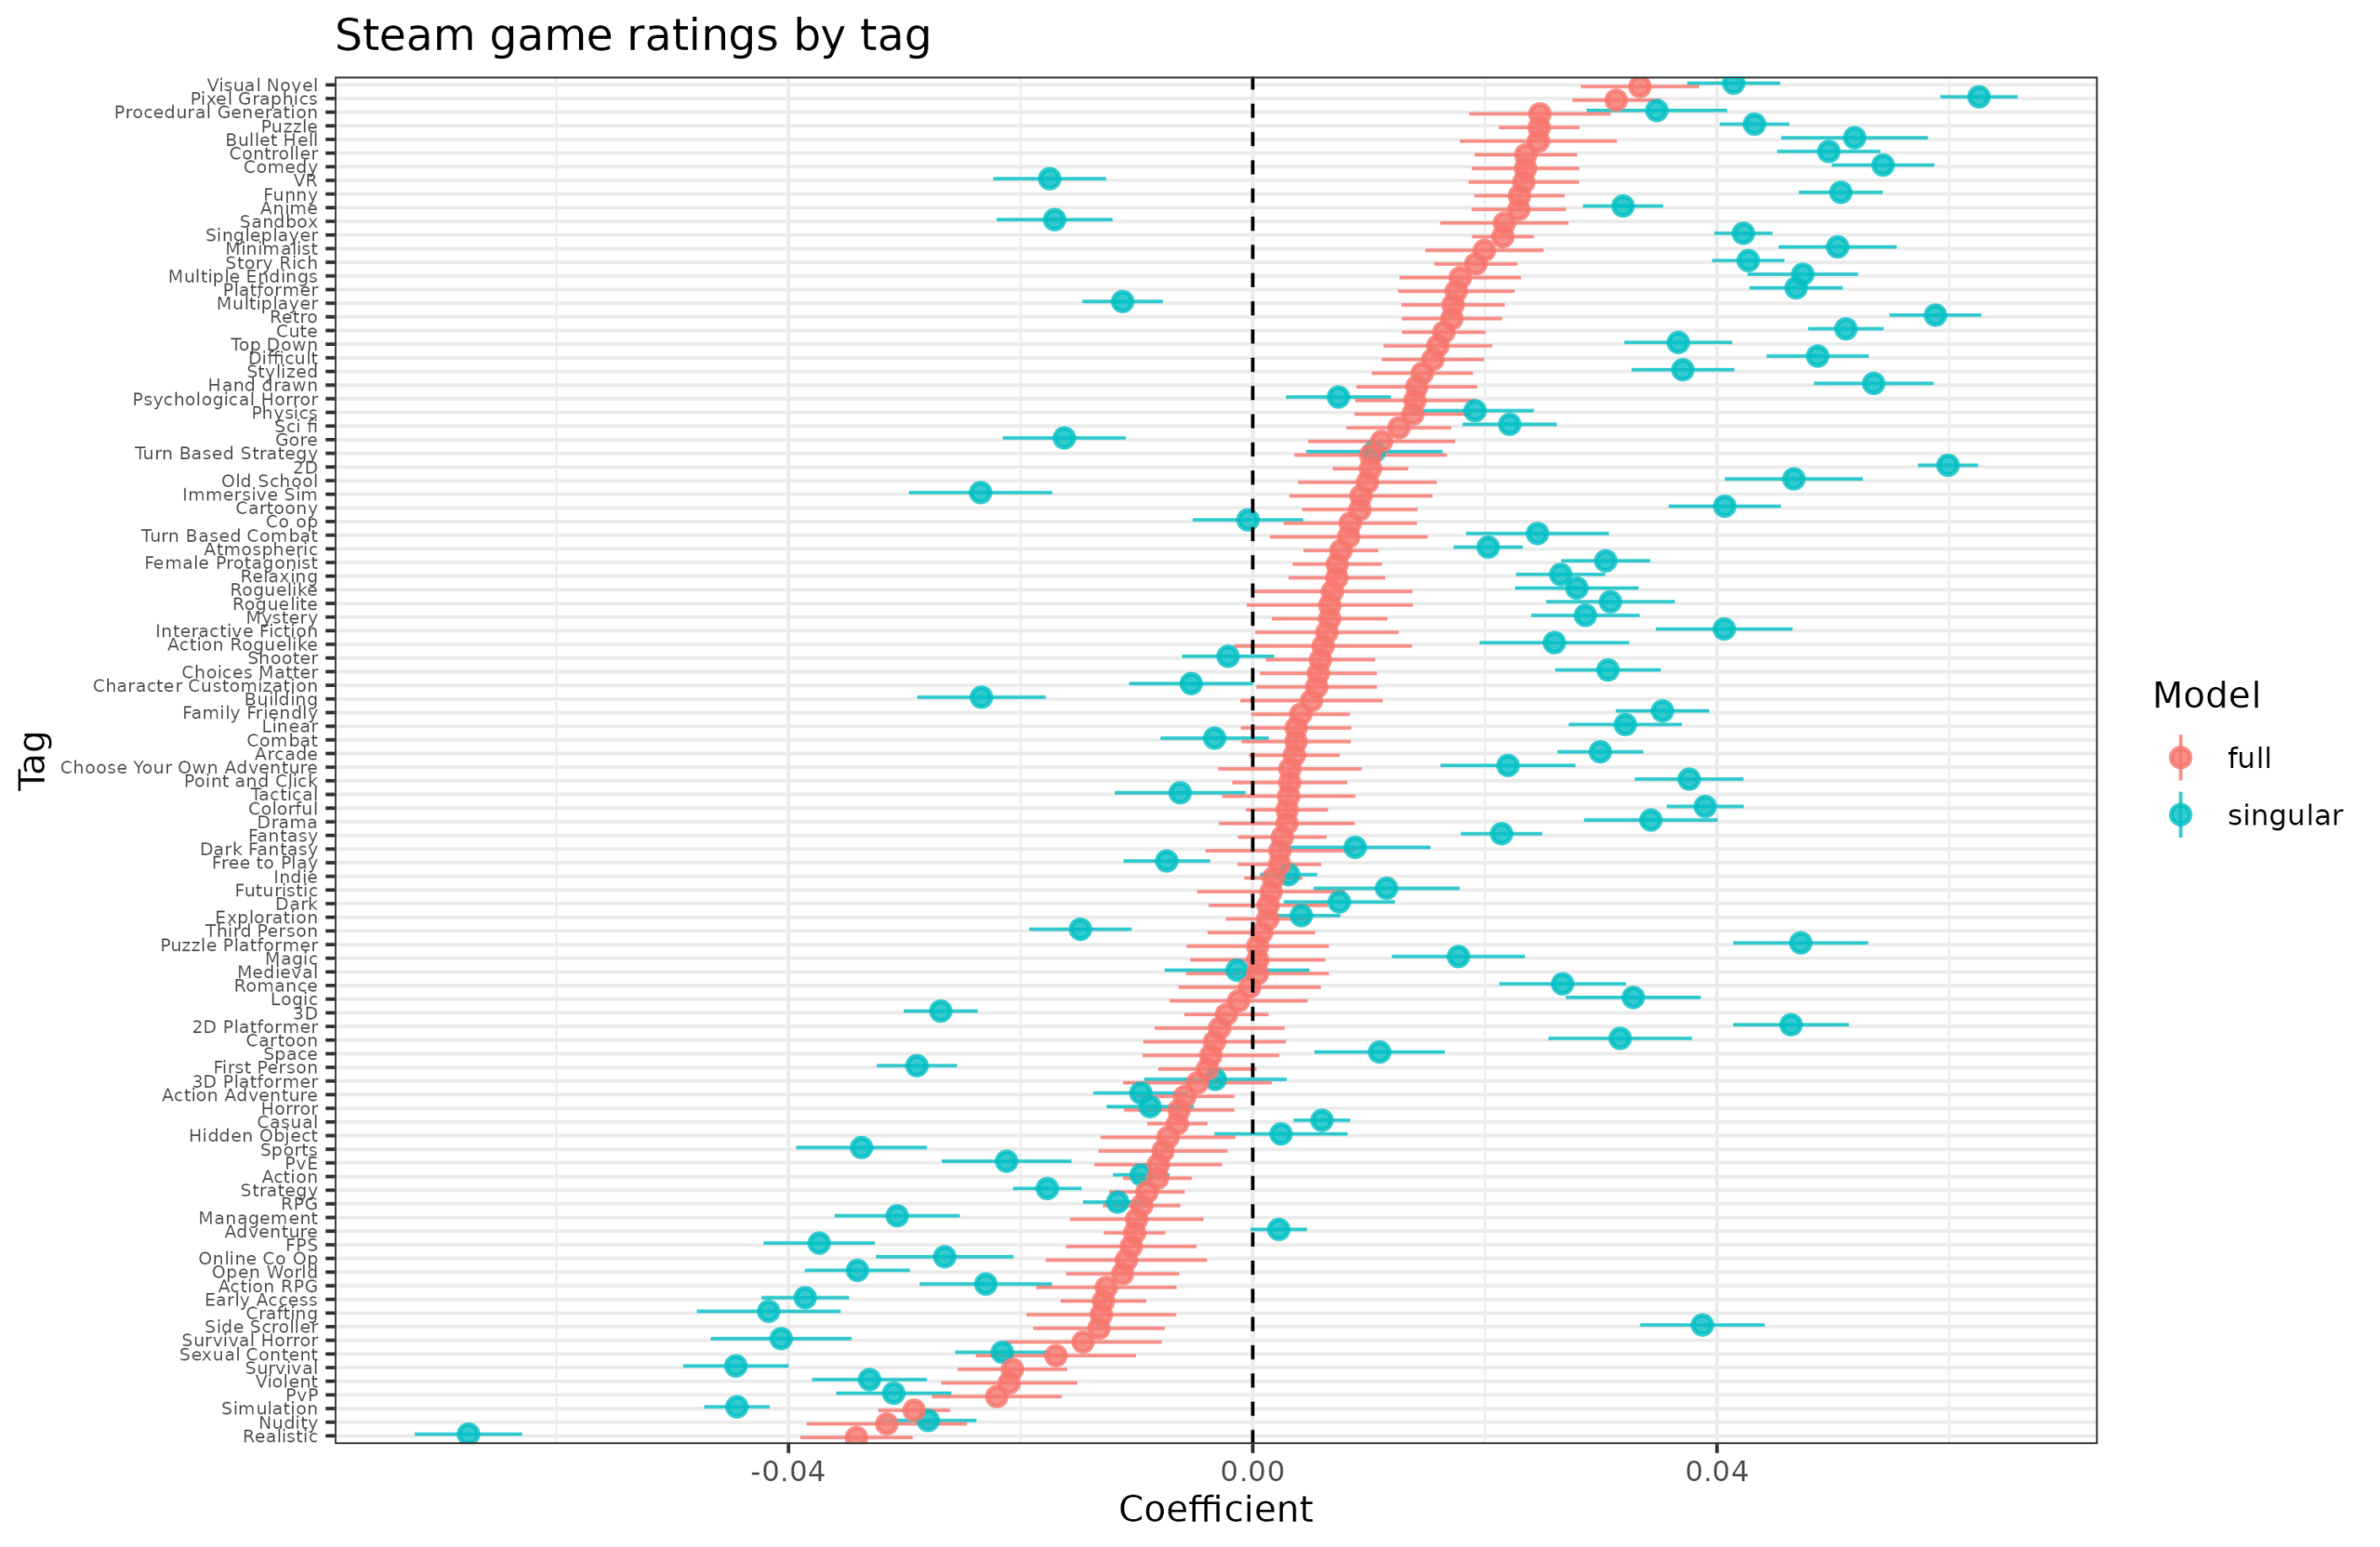
I crammed in as many as I could for this plot. Each row shows 2 model results for a given tag. The turquoise dot is when the tag is used as the only predictor (+ release date) and the red is including all the other tags. There are some interesting results. Realistic is apparently a bad thing to describe a game, as it is the worst tag to have. Maybe real-life sucks (according to gamers) and we don't want to repeat that experience. The sex games are also bad (nudity, sexual content). Some other results are strange. There is both a tag for multiplayer and for singleplayer. Deepending on how you define things, these may be mutually exclusive, or a game may have both, but not neither. In this case, they seem to mean whether one can play alone and whether one can play multiple people, thus making it possible to have both. It turns out that including both in a regression makes both effects positive (red dots), but if they are modeled independently, then multiplayer has a negative effect. My guess is that many games are not tagged correctly (it's impossible to have neither, unless I guess there is no game at all) and that these games tend to be relatively bad. We can check this idea:
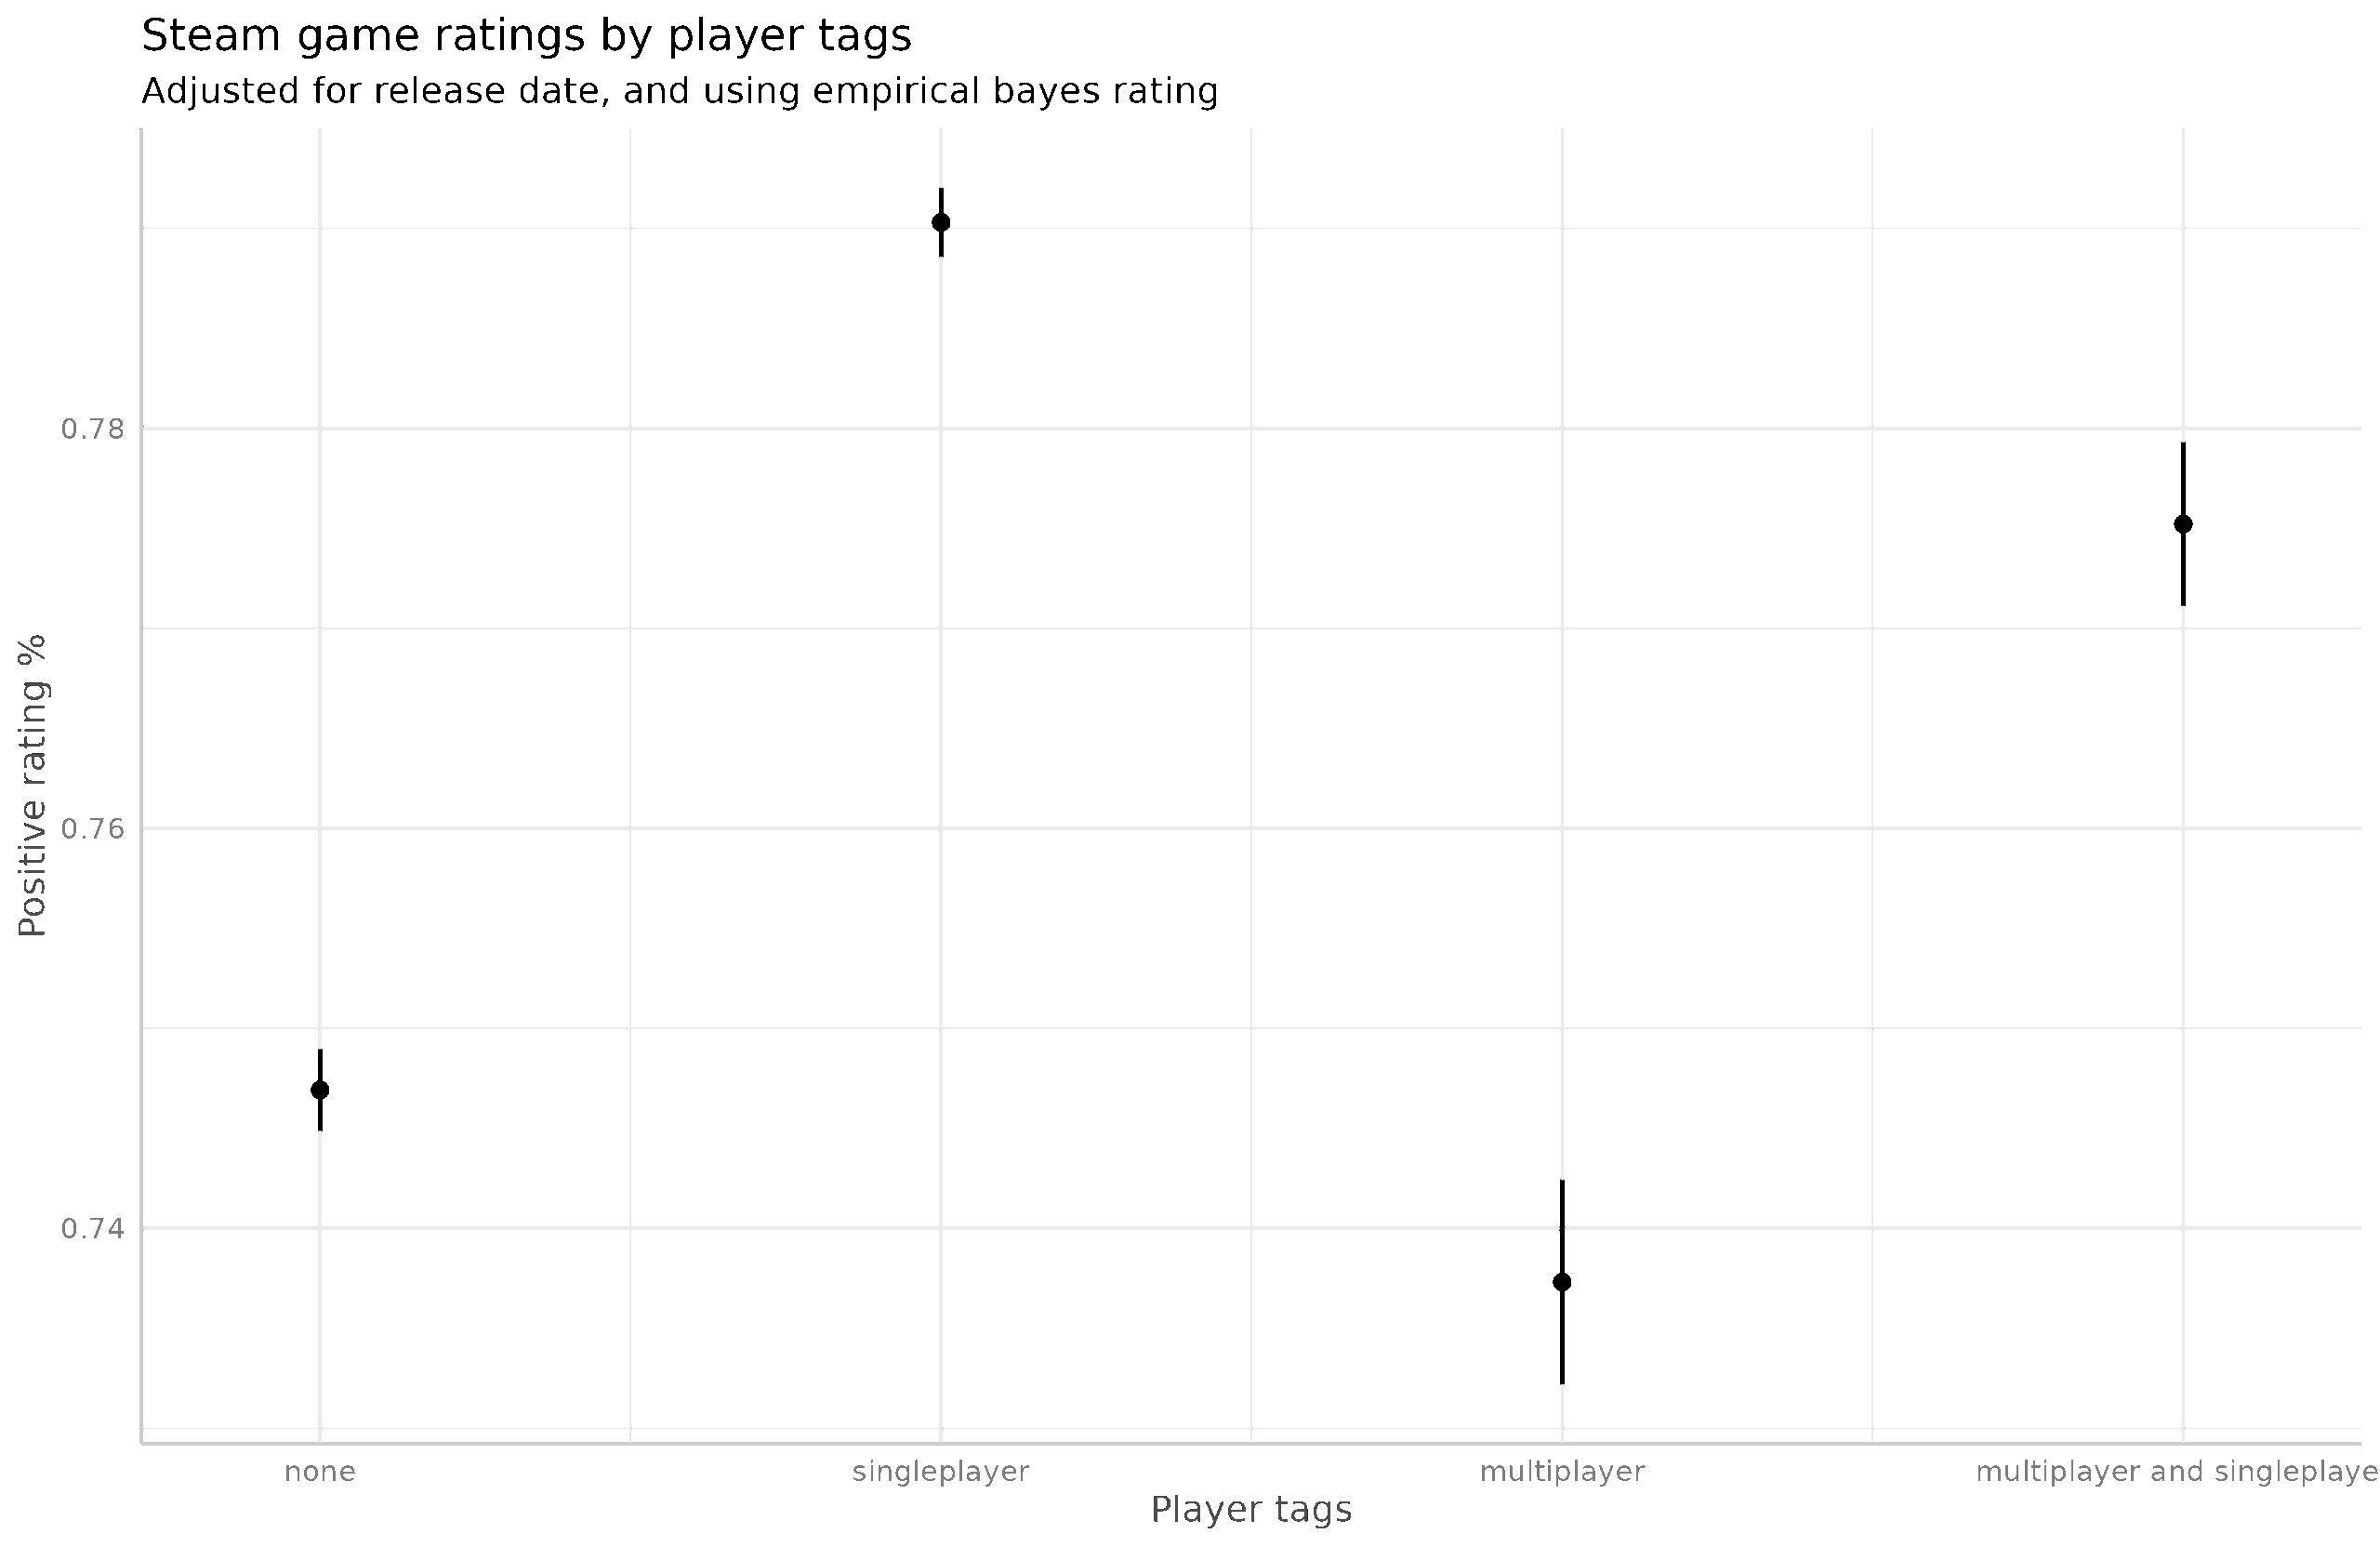
It looks correct based on a model where we split them up into the 4-options. Multiplayer without singleplayer is a bad gamble for a game developer, and so is not having the tags at all.
How well can we predict game ratings? Well, there are ~450 tags, but some of them have very few games with them. If we include only those tags with at least 100 games, there are 409 tags. An additive regression model with these tags gives an adjusted r² of 21%. But probably we expect interactions to occur. If we restrict ourselves to 2-way interactions, there are 83k interactions to test (409 * 408 / 2). However, because many of the combinations of the tags are rare, we don't (can't) have to test all of them. Based on a requirement of having at least 20 games with both tags, there were about 30k interactions to test. I tested them using regression including release date as a covariate, and this was the result:

No signal of interactions would result in a uniform distribution (equal density everywhere) but instead we see a very clear signal (a lot of small p values on the left side). Some examples of the combinations with signal:

All of these are far beyond chance even adjusting for multiple testing (last 2 columns). So for instance we learn that action and adventure don't go well together (negative beta), while free-to-play and indie go well together. Some of the results are funny, for instance, romantic puzzles? Doesn't sound good, and the results indicate it isn't (-0.08). Female protagonist and sexual content? I imagine the lesbian or female-dominance market is quite small, so this probably wouldn't do well with the mostly game gamers and it doesn't.
Finally, modeling this kind of data is mostly beyond the ability of regression models, so we need machine learning. I asked uncorrelated to throw the data into xgboost and he did. Doing so yields this result:

The trade-off with using machine learning is that we don't really understand how the model works. But it does a lot better than the regression, showing that those interactions have real validity. The linear model with 409 tags achieved adjusted r² of 21.2% (r = 0.46) while xgboost achieved 35.2% (r = 0.593). It would appear, then, that developers might want to try one of these models because they make a new game based on a bad combination. Or they might see it as a challenge. Maybe one can make a good game with puzzles and romance.
Alternative hypothesis for the time trend -- it's selection:
- Newer games are played by less discerning and newer gamers, who give more lenient ratings
- Older games that people still play enough to get rated on steam tend to be good.
It's quite a disappointment to see games turn up as a topic here. I hope it isn't a taste of things to come.