
What really predicts fertility? A principled look at country time series data
Urbanization is the most promising looking candidate for intervention

We have an endless amount of articles trying to show that this or that variable is a plausible causal candidate, and hopefully something we can do something about practically speaking. No article I’ve seen did a systematic comparison of different proposed variables, so it is somewhat difficult to judge the relative evidence for them. To remedy this, I decided to try to produce such a systematic comparison. Here’s my approach:
I used country level data with total fertility rate (TFR) as the outcome. I used time series data so that we can include country fixed effects (FEs) which by design removes all between country variation and only uses the within country variation (fixest). This avoids most confounding factors that are stable between countries (language, culture, neighbors, geography).
I used raw TFR and log(TFR) as outcome in parallel models. The latter model approach will estimate percentage changes instead of absolute. In raw units, the change from 4 to 2 TFR is the same as 2 to 0, but the latter is 100% and the former is 50% change. It’s not obvious that causal factors affect TFR in raw or percentage units.
I examined results for core OECD (core, not Turkey etc.) and the world at large, since it is possible that causal effects are different for developed countries and those in the world at large.
Since it wasn’t clear how to control for the effects of time, I used 3 approaches: no control, linear, and FE. The main models used yearly FEs, the most strict standard.
One cannot strictly prove causality even using country FEs, since it is possible something else is covarying across time with TFR within units. If something is truly a causal factor, we would expect it to have a consistent sign and effect size (in raw units) across model specifications and countries (the latter done using a mixed effects model via lme4). This gives us two metrics for such variation (coefficient of variation).
A variable may be consistent across countries and model specifications but have trivial effect size. Since they are all on different scales because different units (e.g. female employment rate % vs. GDPpc $), I used the 2000 cross sectional world sample to scale all variables to SD metrics. Thus, the effect size here means that when the predictor increased 1 year 2000 country standard deviation, the TFR/log(TFR) changed by X. Alternatively, I used the within-countries R2, which is a model fit metric. A variable that is important should have a non-trivial R2, but a trivial variable may have a large R2.
I could start with the main results and maybe you wouldn’t read the rest, so I will start with the details and you can skip ahead if you want the main findings. First, should we use raw or log(TFR) as outcome? Do predictors predict raw changes in TFR or percentage changes? The models are difficult to compare directly, but we can backtransform the log-TFR predictions to TFR scale and see which parallel models predict more accurately:
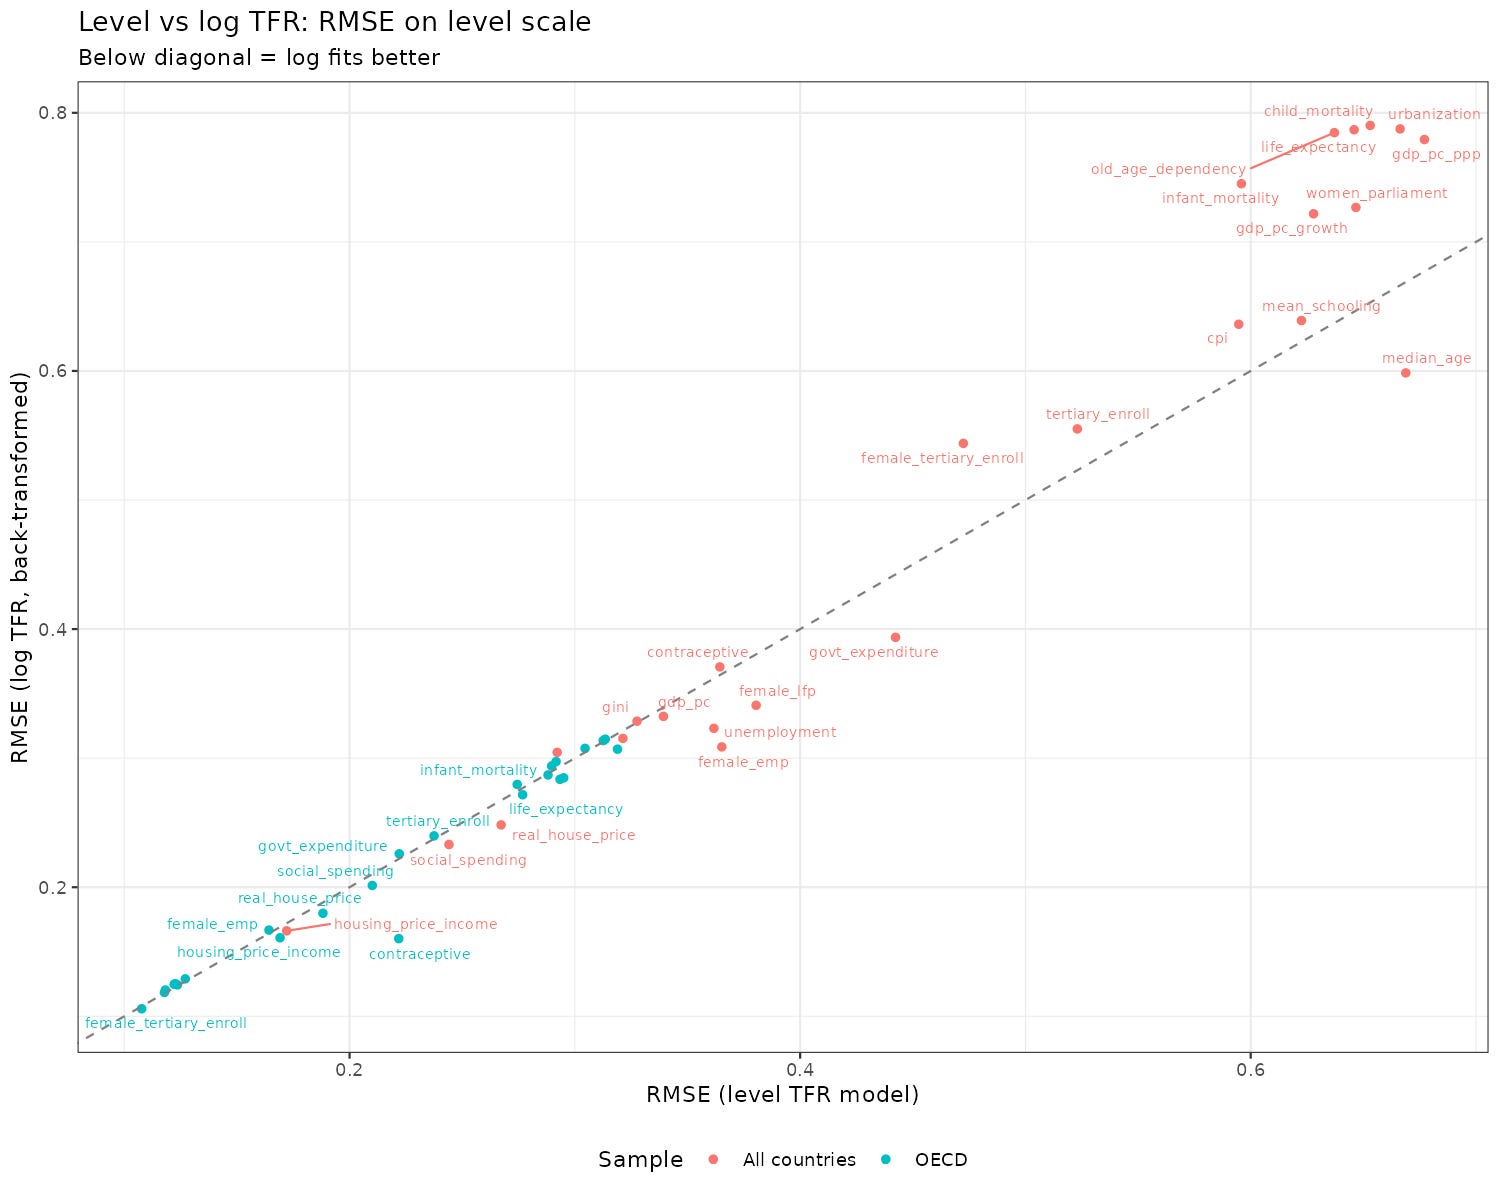
Overall, there is some edge to the log-TFR models which is mainly seen for the global dataset. The reason for this is that among OECD countries, the TFR variation is already small, so the difference between TFR and log-TFR would be hard to see. Thus in general we should prefer the log-TFR models in the model specifications.
Regarding the standardized effect sizes, they look like this:
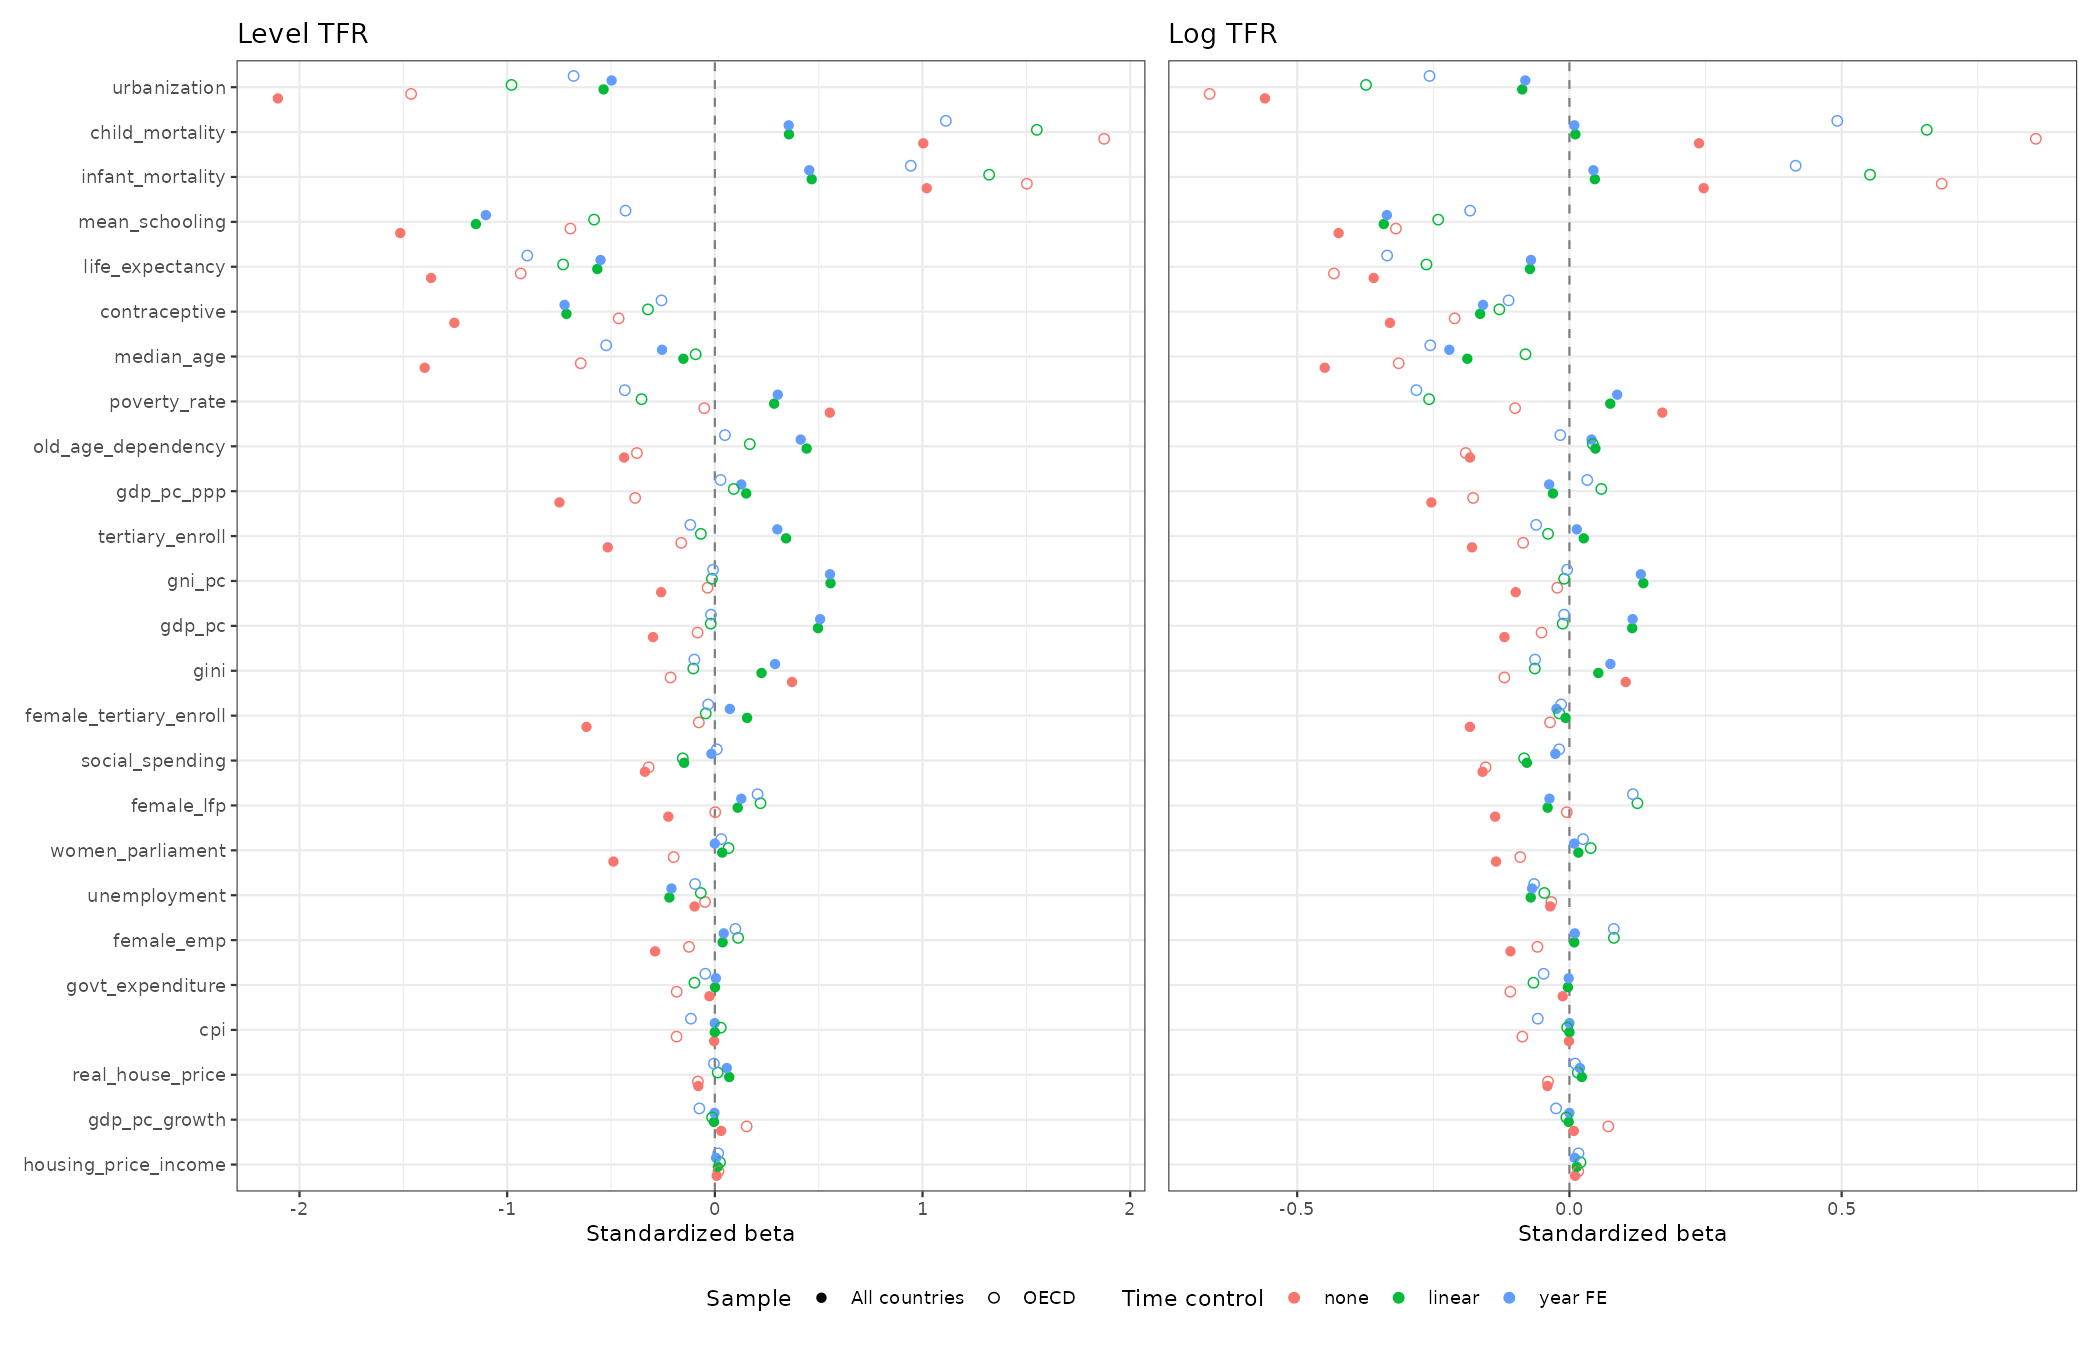
When the full and empty circles in matching color are not near each other, it means we get different estimates from the OECD subset and world at large. This could be consistent with a causal factor having a nonlinear effect, or it may be because of confounding that is reduced or enhanced in one of the datasets. For the variables with non-trivial effect sizes, though, we see that they consistent in direction except for one: GDP per capita ppp. This variable has opposite signed effects whether we study OECD or the world. This is impossible given a linear causal effect, but perhaps possible with a nonlinear one. The same pattern is seen for poverty rate, which seemingly has opposite effects in OECD and the world. We can also just compare the model fits between linear and nonlinear models in general:
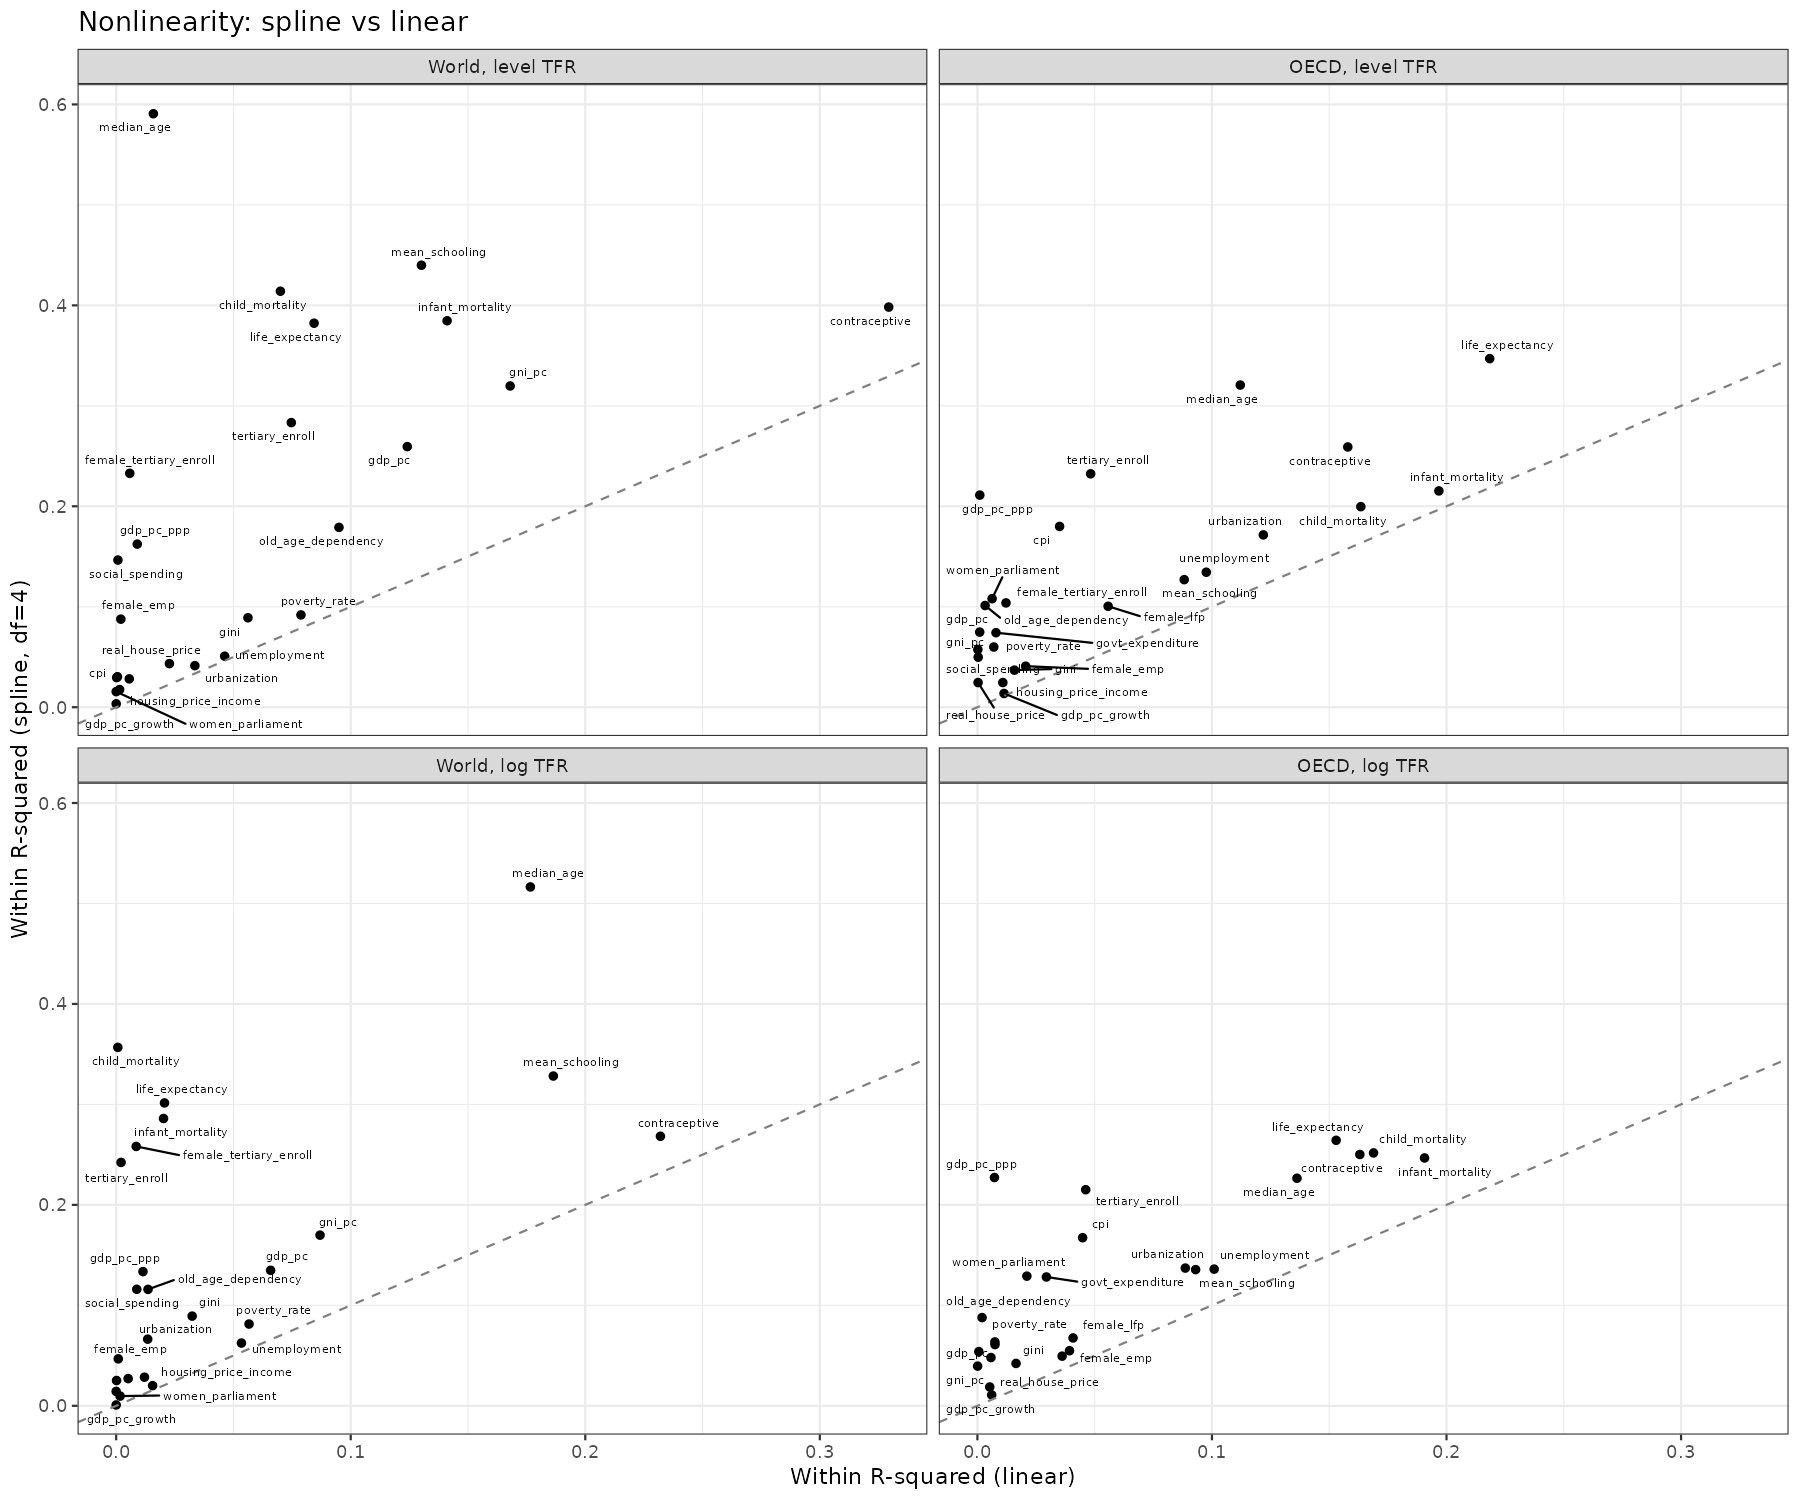
So it turns out that most variables benefit from nonlinear forms (splines), which is not reassuring for any causal explanation. Who can believe, for instance, that child mortality has this kind of causal effect:
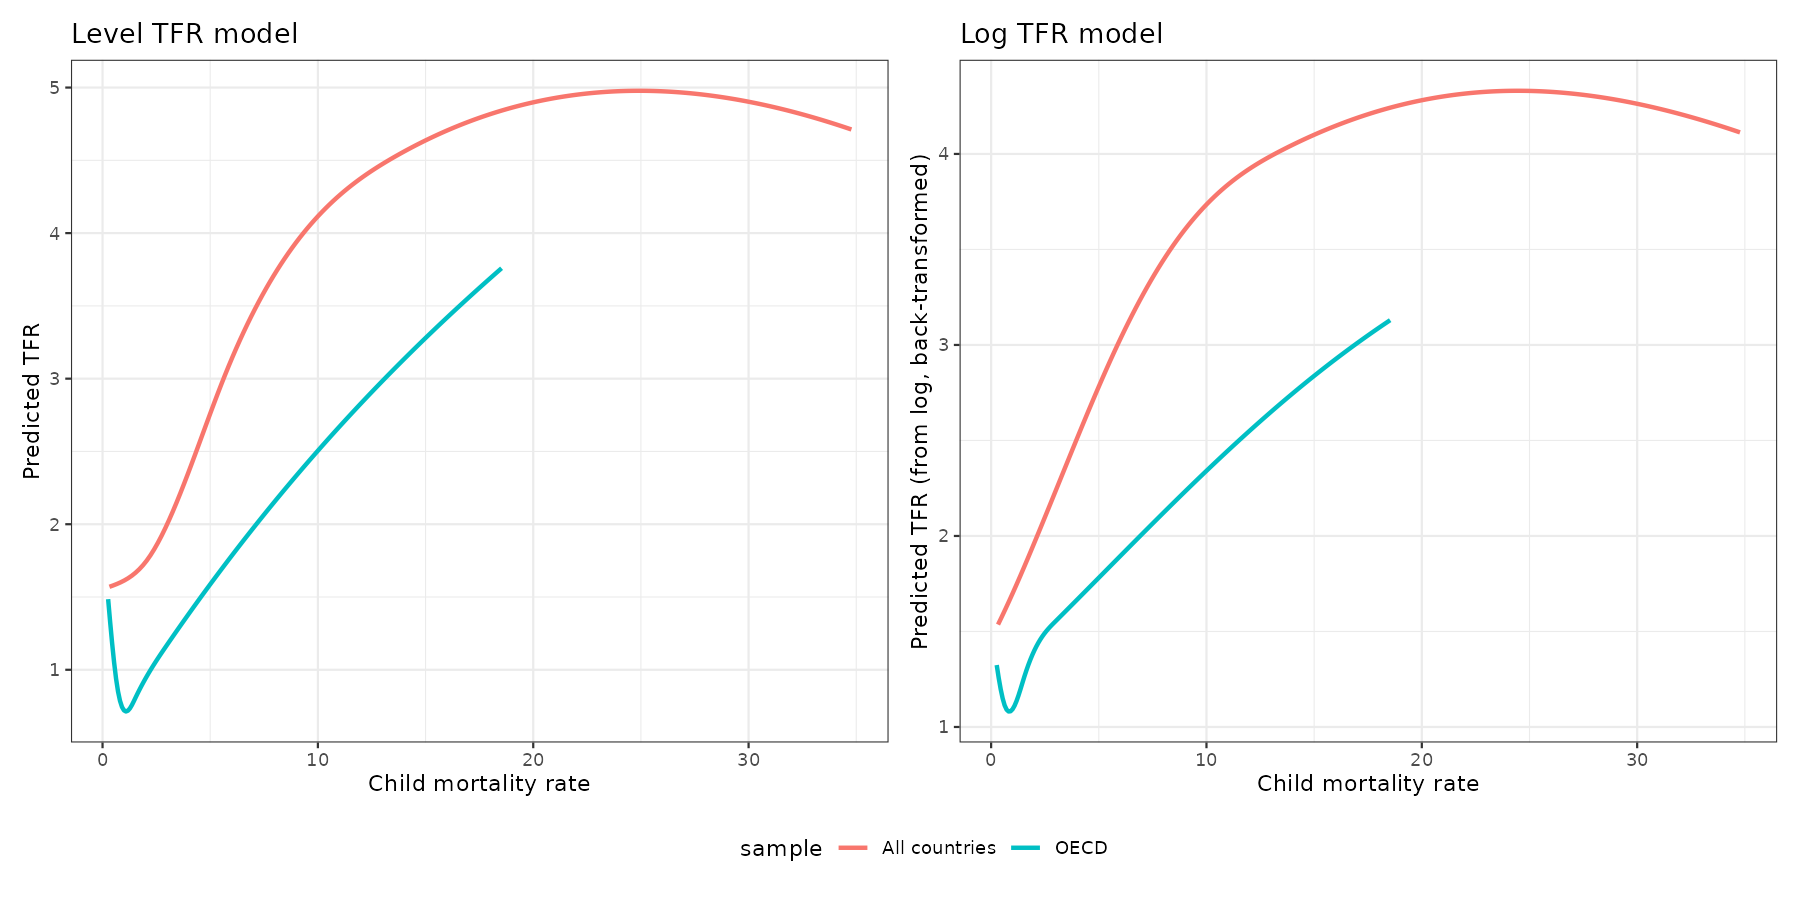
The checkmark pattern in OECD is clearly impossible and reflects some kind of confounding that somehow evades the dual fixed effects (country + year). These non-monotonic checkmark curves gained some fame years ago when researchers found the same thing for HDI:
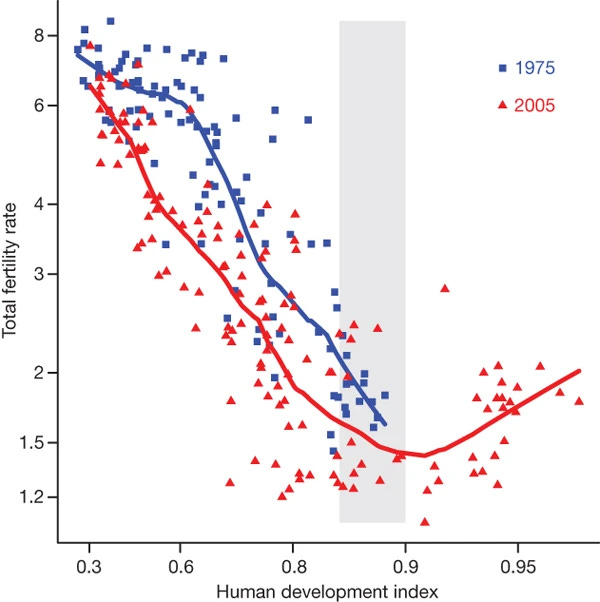
This result provided a lot of hopium for some years but now it looks like this:
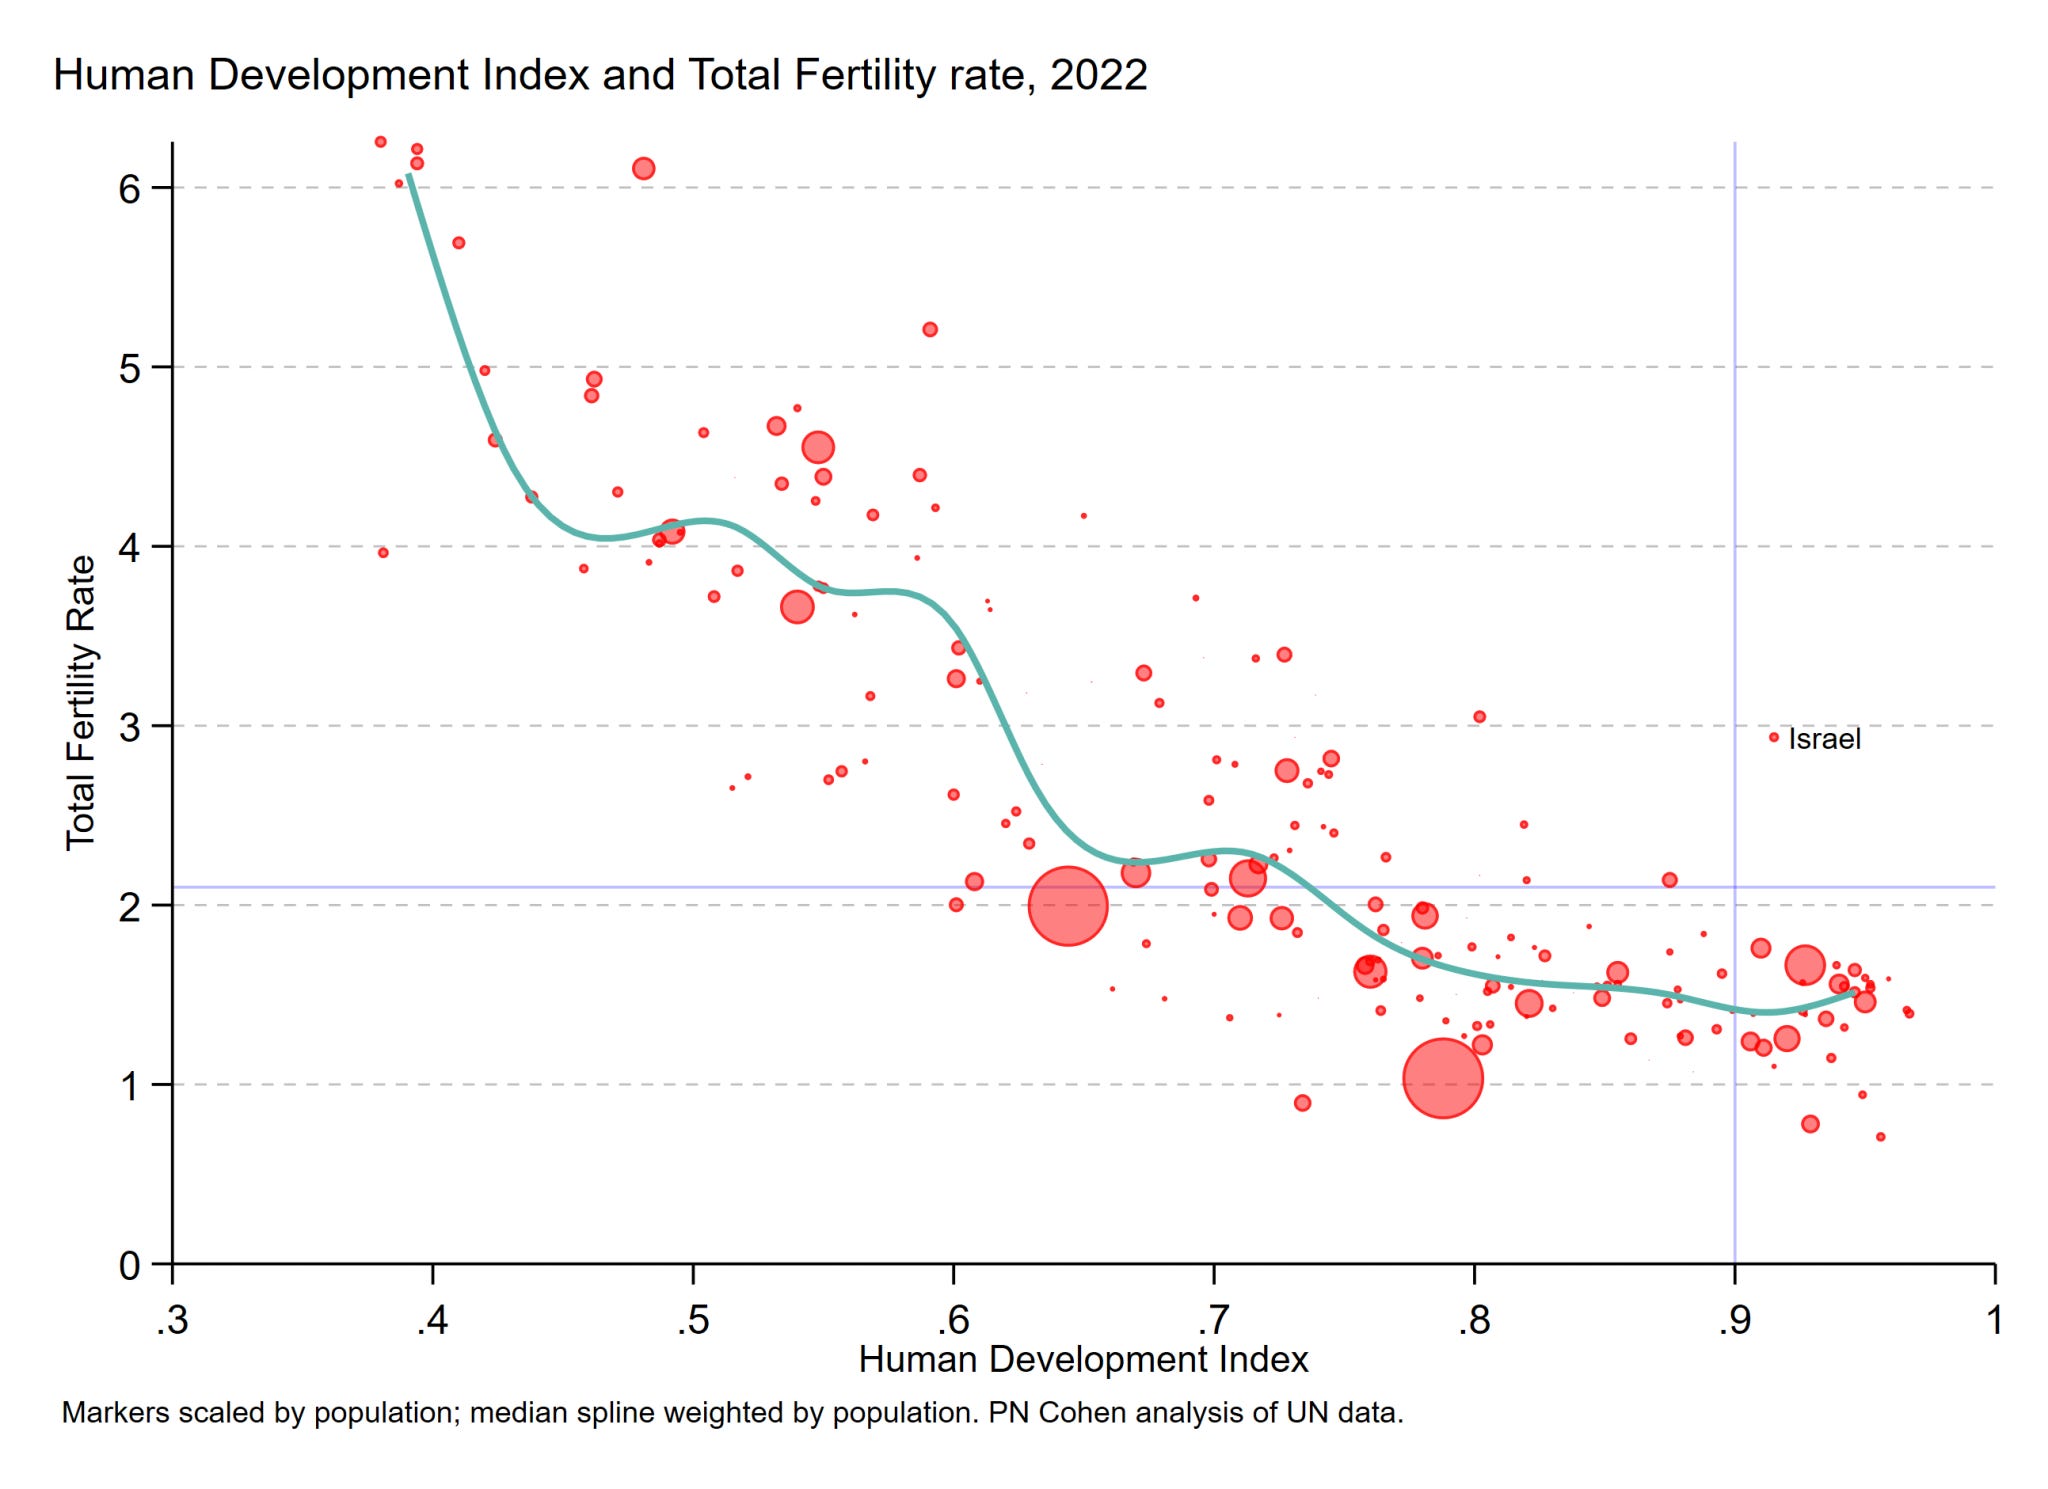
Gone is the hopium result but I still see it posted from time to time. One can in fact get an even less credible version of it even using the dual fixed effects:
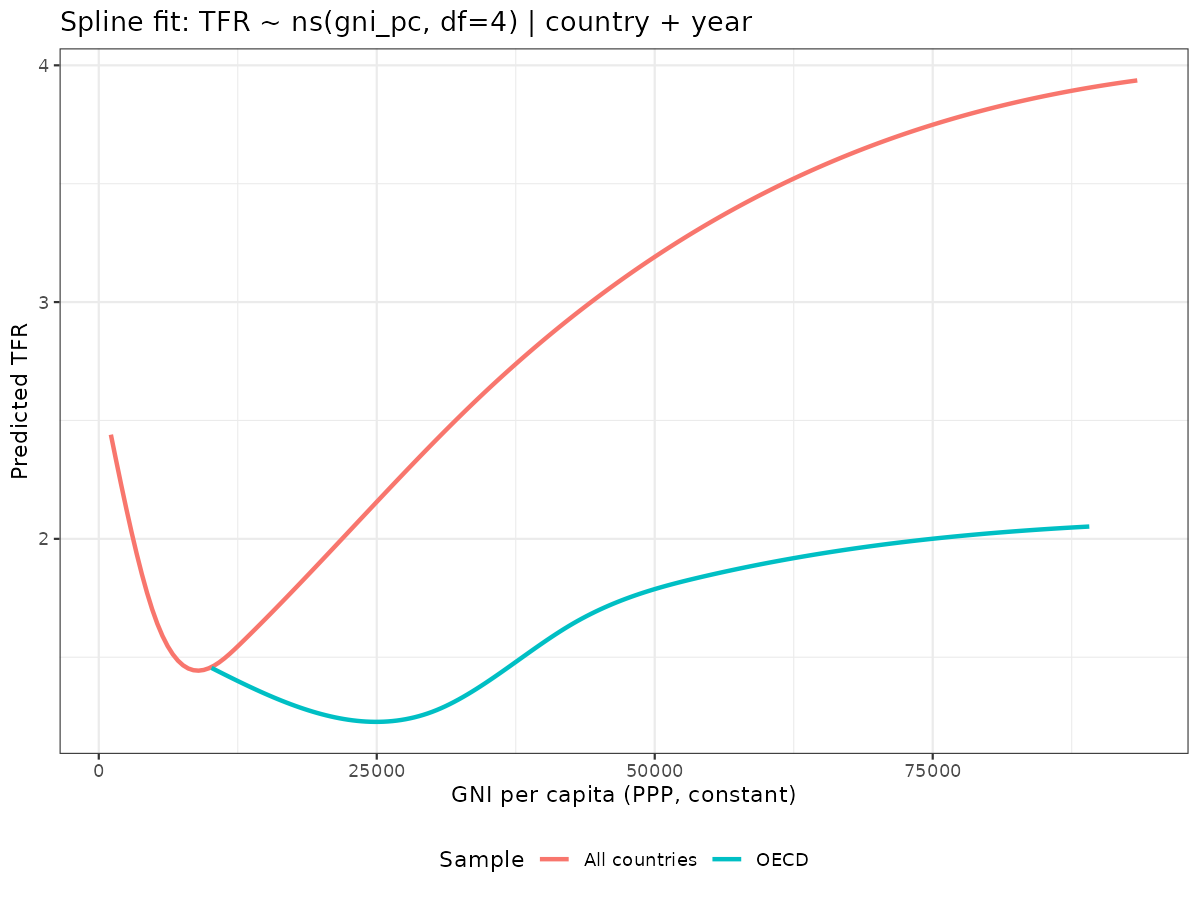
I think what happens is that despite the country FEs, the spline function has flexibility to capture the Arab oil states having high fertility at increasing wealth. A strange case of linear models being more appropriate than splines despite large detectable nonlinearity.
Overall, the final summary table for results is this:
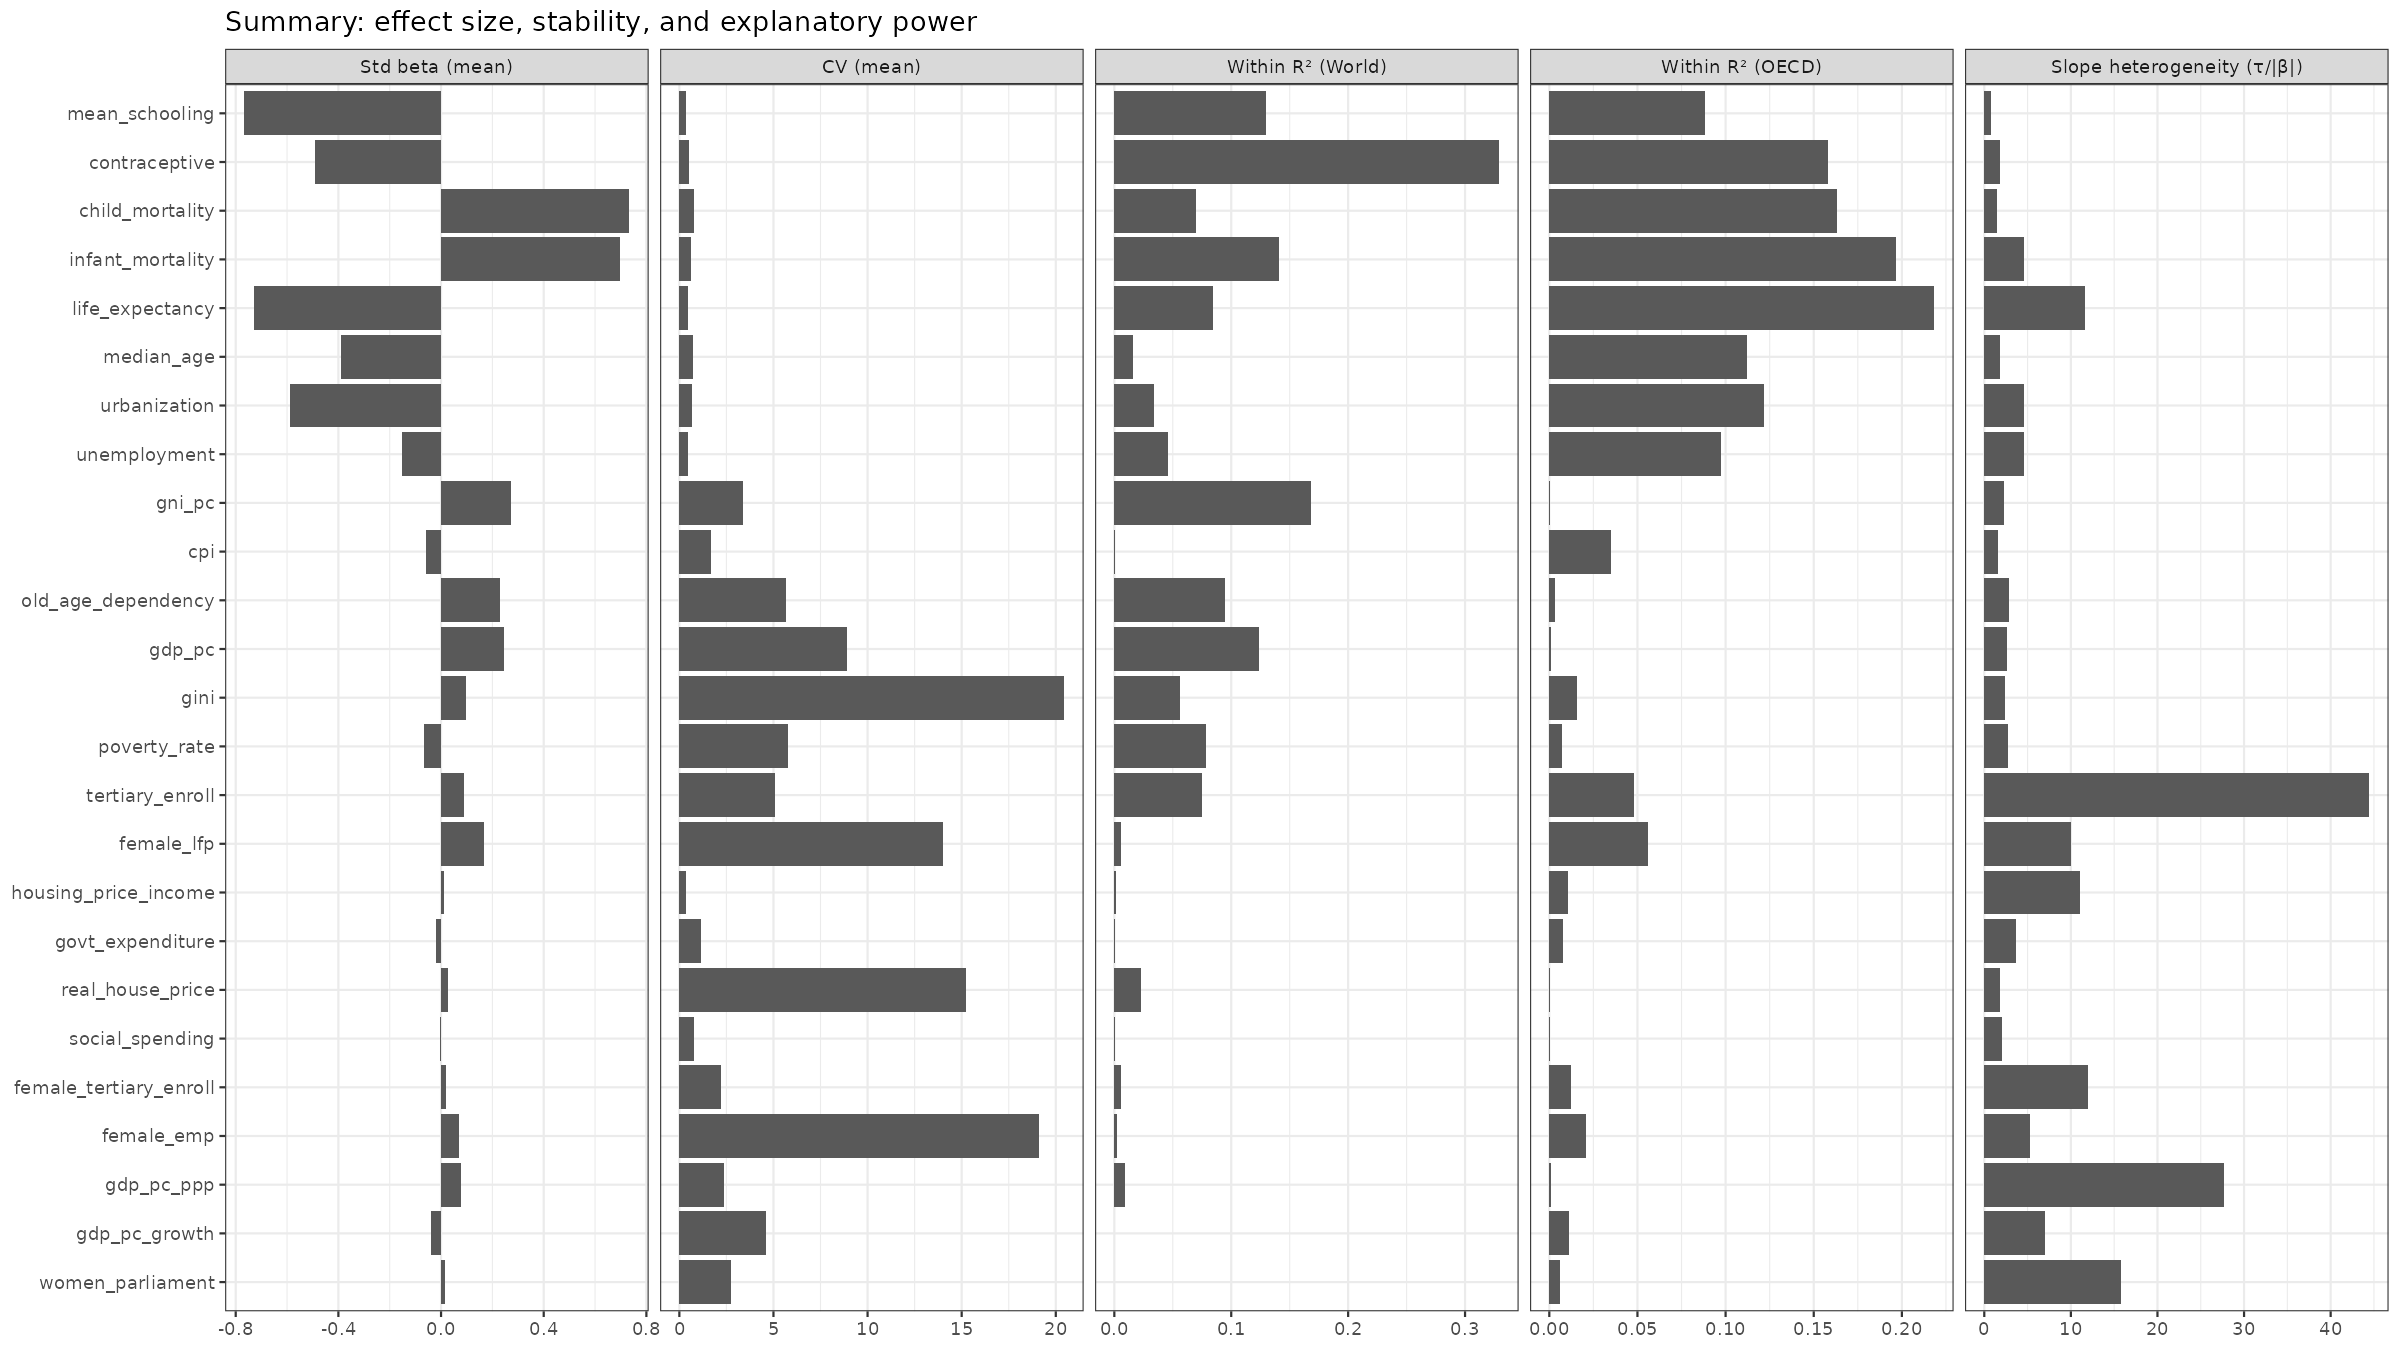
The most likely causal effects are those that 1) have a sizable standardized effect, 2) small variation between model specifications, 3+4) a decent r² within countries on average for both OECD and the world, 5) small variation among countries. The plot ranks these metrics taken together. Thus, years of formal education for adults is the single most promising variable. This is strange because if so, we expect it to chiefly relate to women in higher education, which is the years of schooling that primarily block/postpone fertility. However, female tertiary education % we have as a separate variable and it found nothing. This is the same result I found before using different methods. This result is also not in line with individual level results (UK results):
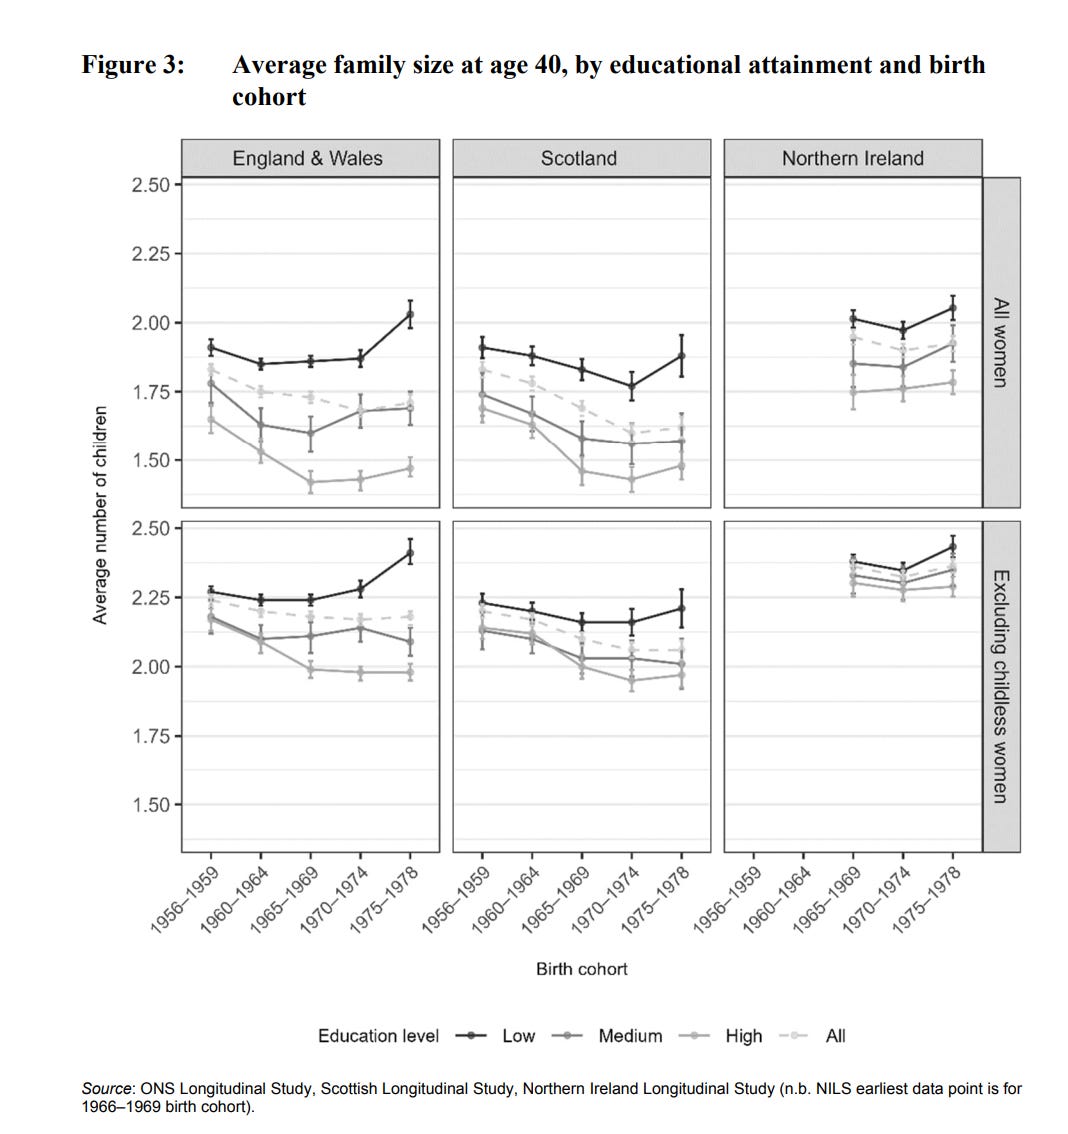
Fertility is here measured as number of children a woman has at age 40, which is almost the completed fertility value. There’s a clear educational gradient by educational attainment related to post primary education, which is the exact one we don’t find in the country level data.
OK, so the education results are strange, what about the next finding? Contraception. It passes with flying colors and has an obvious causal mechanism. Next we have 3 health measures -- child/infant mortality rate and life expectancy -- which show consistent results. There isn’t an immediate causal mechanism here, but there is a large literature on how mortality salience supposedly has effects on desired and realized fertility. The evidence consists of various priming studies (dubious) and some observational (women in Africa having more children as a function of how many funerals they attended). Nothing is entirely convincing, but maybe.
Median age is a bad variable, but I’ve kept it for inclusiveness. Why is it bad? Well, having more children decreases the median age, so it is caused by the outcome itself. It’s also affected by general health and development, which makes it about the same as the ones above, just measured in a different way.
Urbanization is an interesting variable. Aside from contraception, it is the only one that governments can realistically do something about. It shows a much larger R2 inside the OECD than outside, which is probably because among the world’s countries, other factors are much more important, but among rich countries, urbanization is important. More Births has compiled tons of indirect evidence of urbanization measured in various ways, such as housing size and density. Every map of cities and TFR show something like this:
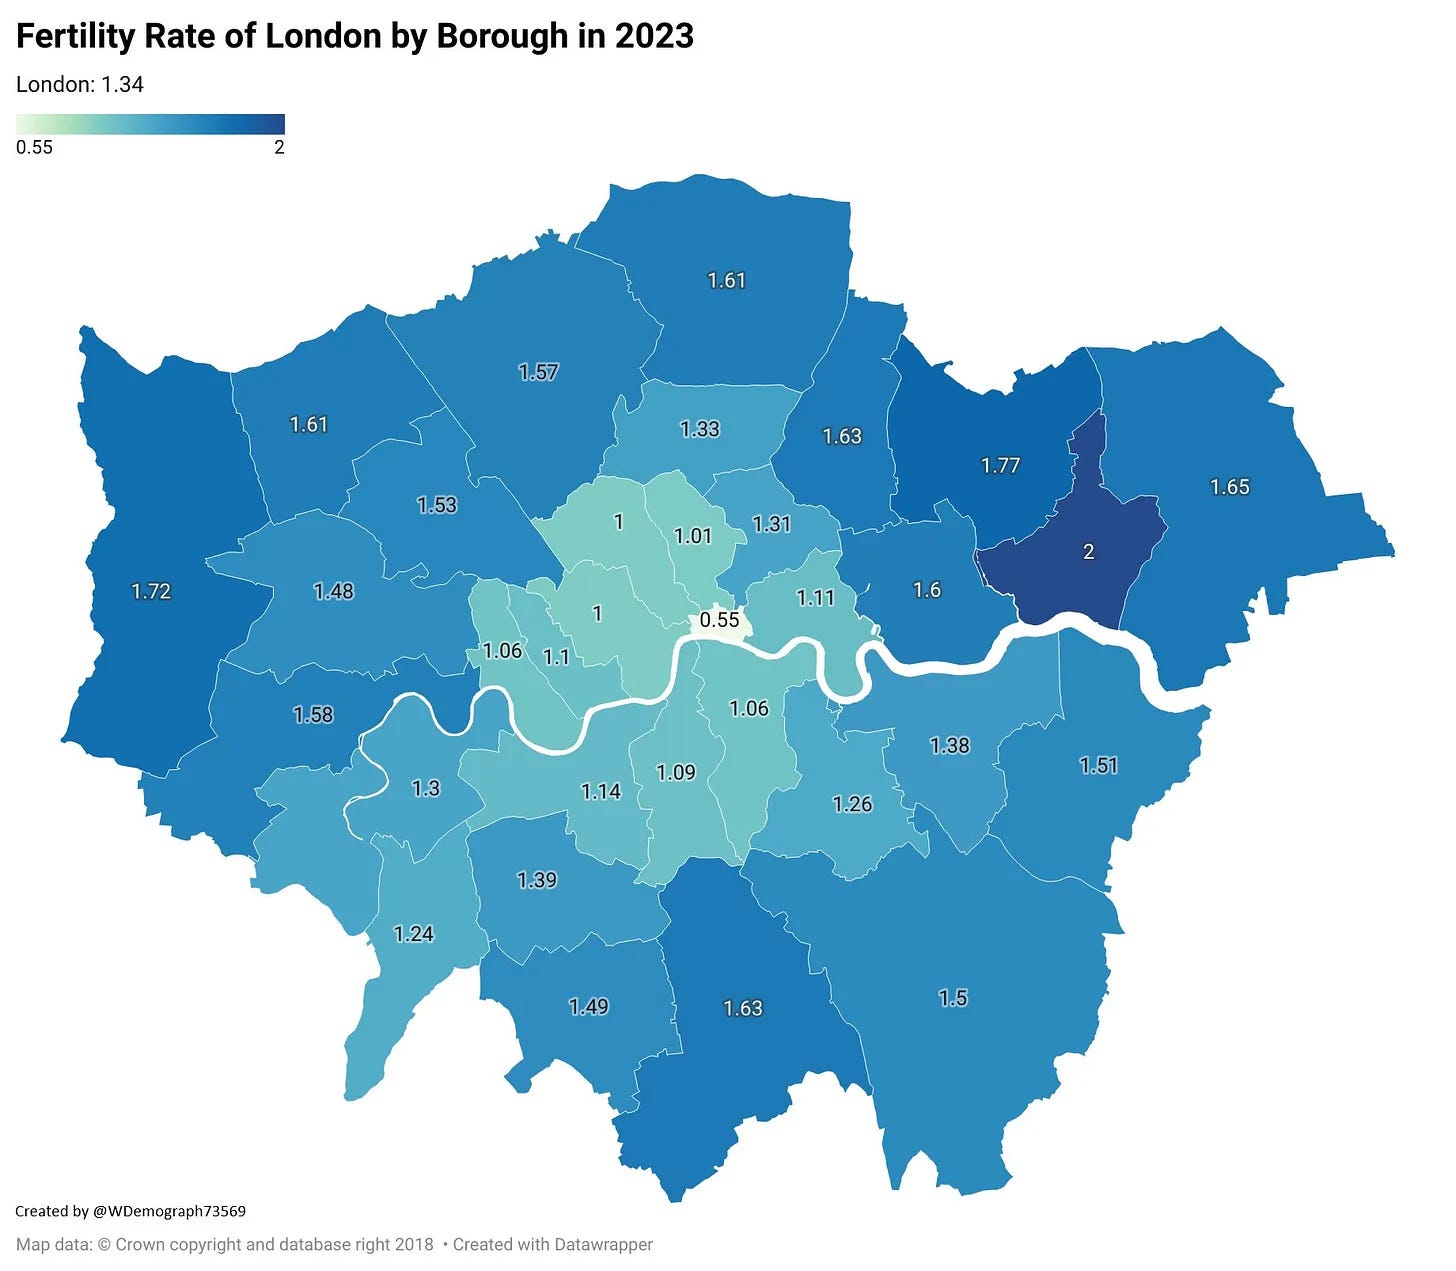
These kinds of map are of course not conclusive evidence because people don’t live in random places. When people want to start making family, they usually leave inner cities for a house further out, which in part causes this pattern by concentrating the voluntarily childless in cities. What we need is an experiment where people were moved around at random, some to better/larger housing. It would appear this is possible using the Moving to Opportunity dataset, but it is not publicly available. If you have access, please send it to me so I can check. I couldn’t find any published study looking at the fertility of the people receiving the grant for moving, as everybody is busy p-hacking the outcomes for the children (4000+ citations already).
All the remaining predictors did not produce patterns consistent with a simple causal model. This includes GDP/GNI and their variants, government size/social spending, house to income ratio, inflation, inequality, female employment. Maybe some of these things matter, but we can’t detect it here.
I think the general conclusion of this exercise is that if one is willing to try many model specifications and data subsets, one can surely find some cool looking plot and write it up with some exciting but speculative story and then submit that to one’s favorite journal of p-hacked results. However, a systematic search of variables just found that various measures of overall health all negatively predict fertility (infant/child mortality/life expectancy/median age), which isn’t very useful. Even if this is causal, I don’t think governments will be telling their voters soon that their plan to boost the fertility rate is to kill 20% of newborns at random. The only potentially tractable variables were years of schooling, contraception, and urbanization. Regarding the years of schooling, we find the awkward result that the effect seems primarily related to primary schooling, not tertiary schooling. For contraception, I mean, governments could ban it or discourage it, but citizens would just buy it elsewhere since demand is so strong. There is no realistic way to severely limit access to contraception in this day and age. We’ve also seen that banning abortion has only marginal effects. This leaves us with urbanization as a plausible actionable cause. The problem here is that the modern economy works by division of labor and this is much easier when there is a lot of people around, that is, with cities. To reverse this urbanization trend would require ability to do highly productive labor from home, or substantially improving commuting travel times or discomfort. Both of these are possible. A more general conclusion is that using country-level data does not seem to afford us ability to find stuff of interest, aside from ruling out large effects of certain things. We must turn to randomized experiments, if governments were interested in doing them, and if not, then at least ‘natural experiments’ exploiting legal changes.
https://www.journals.uchicago.edu/doi/abs/10.1086/731812?journalCode=jle
(This paper is primarily about isolating a robustly causal variable, not whether this variable is the most consequential in TFR decline.)
I've seen so many conflicting hypotheses so it's nice to see such a sober analysis, thank you.
Do you have any thoughts on high fertility groups like the Amish and Haredem?