
Which countries make the best movies?
Also Olympics, and general rare event statistics

In a simple sense, the answer is America. But America has over 300 million people, and other countries have fewer than 10 million people. Which country makes the best movies taking population size into account? It's a difficult question actually. I have two main ideas for answering this question.
First, find a list of movie ratings by users or critics (IMDB, Rotten Tomatoes), get their ratings, and look at the top X movies. Devise a way to assign each movie to a country, e.g., nationality, birth country, or residence of the director or production company. Count the number of movies in the top X list for each country, taking care with the usual merging-splitting issues (as we will see below).
Second, start with the list of Oscar wins, a rare critic-award. Unfortunately, America cannot be compared this way because the foreign movies are in their own category, but at least they can be compared with each other.
For modeling, since this involves rare event type situation (unstable per capita values), it must be dealt with using special methods such as Poisson, log-count OLS, or Bayesian models. The residuals from the population size only model are show how well the country is doing once population size is accounted for.
Since the first involved more work than I currently have time for, I am leaving that for later, and will present the results from the second approach here. The first problem is the merging-splitting issue. Here's the most winning countries:

So far so good, except that we have:
Russia and the Soviet Union (and also Ukraine, etc.)
Germany and West Germany (further down, East Germany)
Czechoslovakia (Czech Republic and Slovakia further down)
The most obvious approach is to recode the data into the currently existing countries. Helpfully, one can click each of the countries and see their specific wins and nominations, so one may determine where they should be placed. For instance, looking up the Soviet Union submissions, we see that their 3 wins are Russian SFSR (so Russia), and their nominations (semi-finals) are 8 for Russia and 1 for Ukraine. Less easy is it to decide what to do with Czechoslovakia. If we check their win (The Shop on Main Street), it has 2 directors. Unhelpfully, one is a Slovak Jew born in Hungary and the other is Czech. The movie is in Slovak and Yiddish, but it was filmed in Czechia. Maybe it should count as half. By the way, we cannot just leave out these cases because it would mean that e.g. Germany would lose all the wins and nominations in the 1945-1991 period.
Here's the simple per capita (per million due to rarity) results:

Italy and France got many wins and nominations, but also have relatively large population sizes. Denmark did very well for a small country, and Iceland managed to get 1 nomination with a population size of only ~380k, making it the top scorer for nominations and bottom scorer for wins (r = 0.58 between the metrics, mainly because Denmark is an extreme performer in both). The problem with the per million direct adjustment is that small countries will generally come out in the top and bottom of any such list, no matter their actual latent rate. That's inherent in the larg sampling error. Here's a quick visualization:

The shaded area show the 10th and 90th quantiles. The true mean for all of these samples is just 0 (SD = 1), and there's a lot more variation in the smaller sample sizes. Thus, any list of the lowest or highest means will be dominated by small samples (top left). The case for countries and prizes is even worse because they are so rare.
One intuitive way to deal with this problem is to calculate an expected number of wins and compare with the actual number. The expected number is just the global rate per million which turns out to be 0.0105 wins and 0.0480 nominations (I think in modern data there's always 5 nominations one of which wins, so the ratio should be exactly 1:5, but perhaps not in the older data, or maybe Wikipedia is incomplete). Thus, we can simply multiple each country's population with these rates to get their expected counts and compare with their actual counts. I will focus on nominations because there is more data for these (77 wins, 353 nominations).
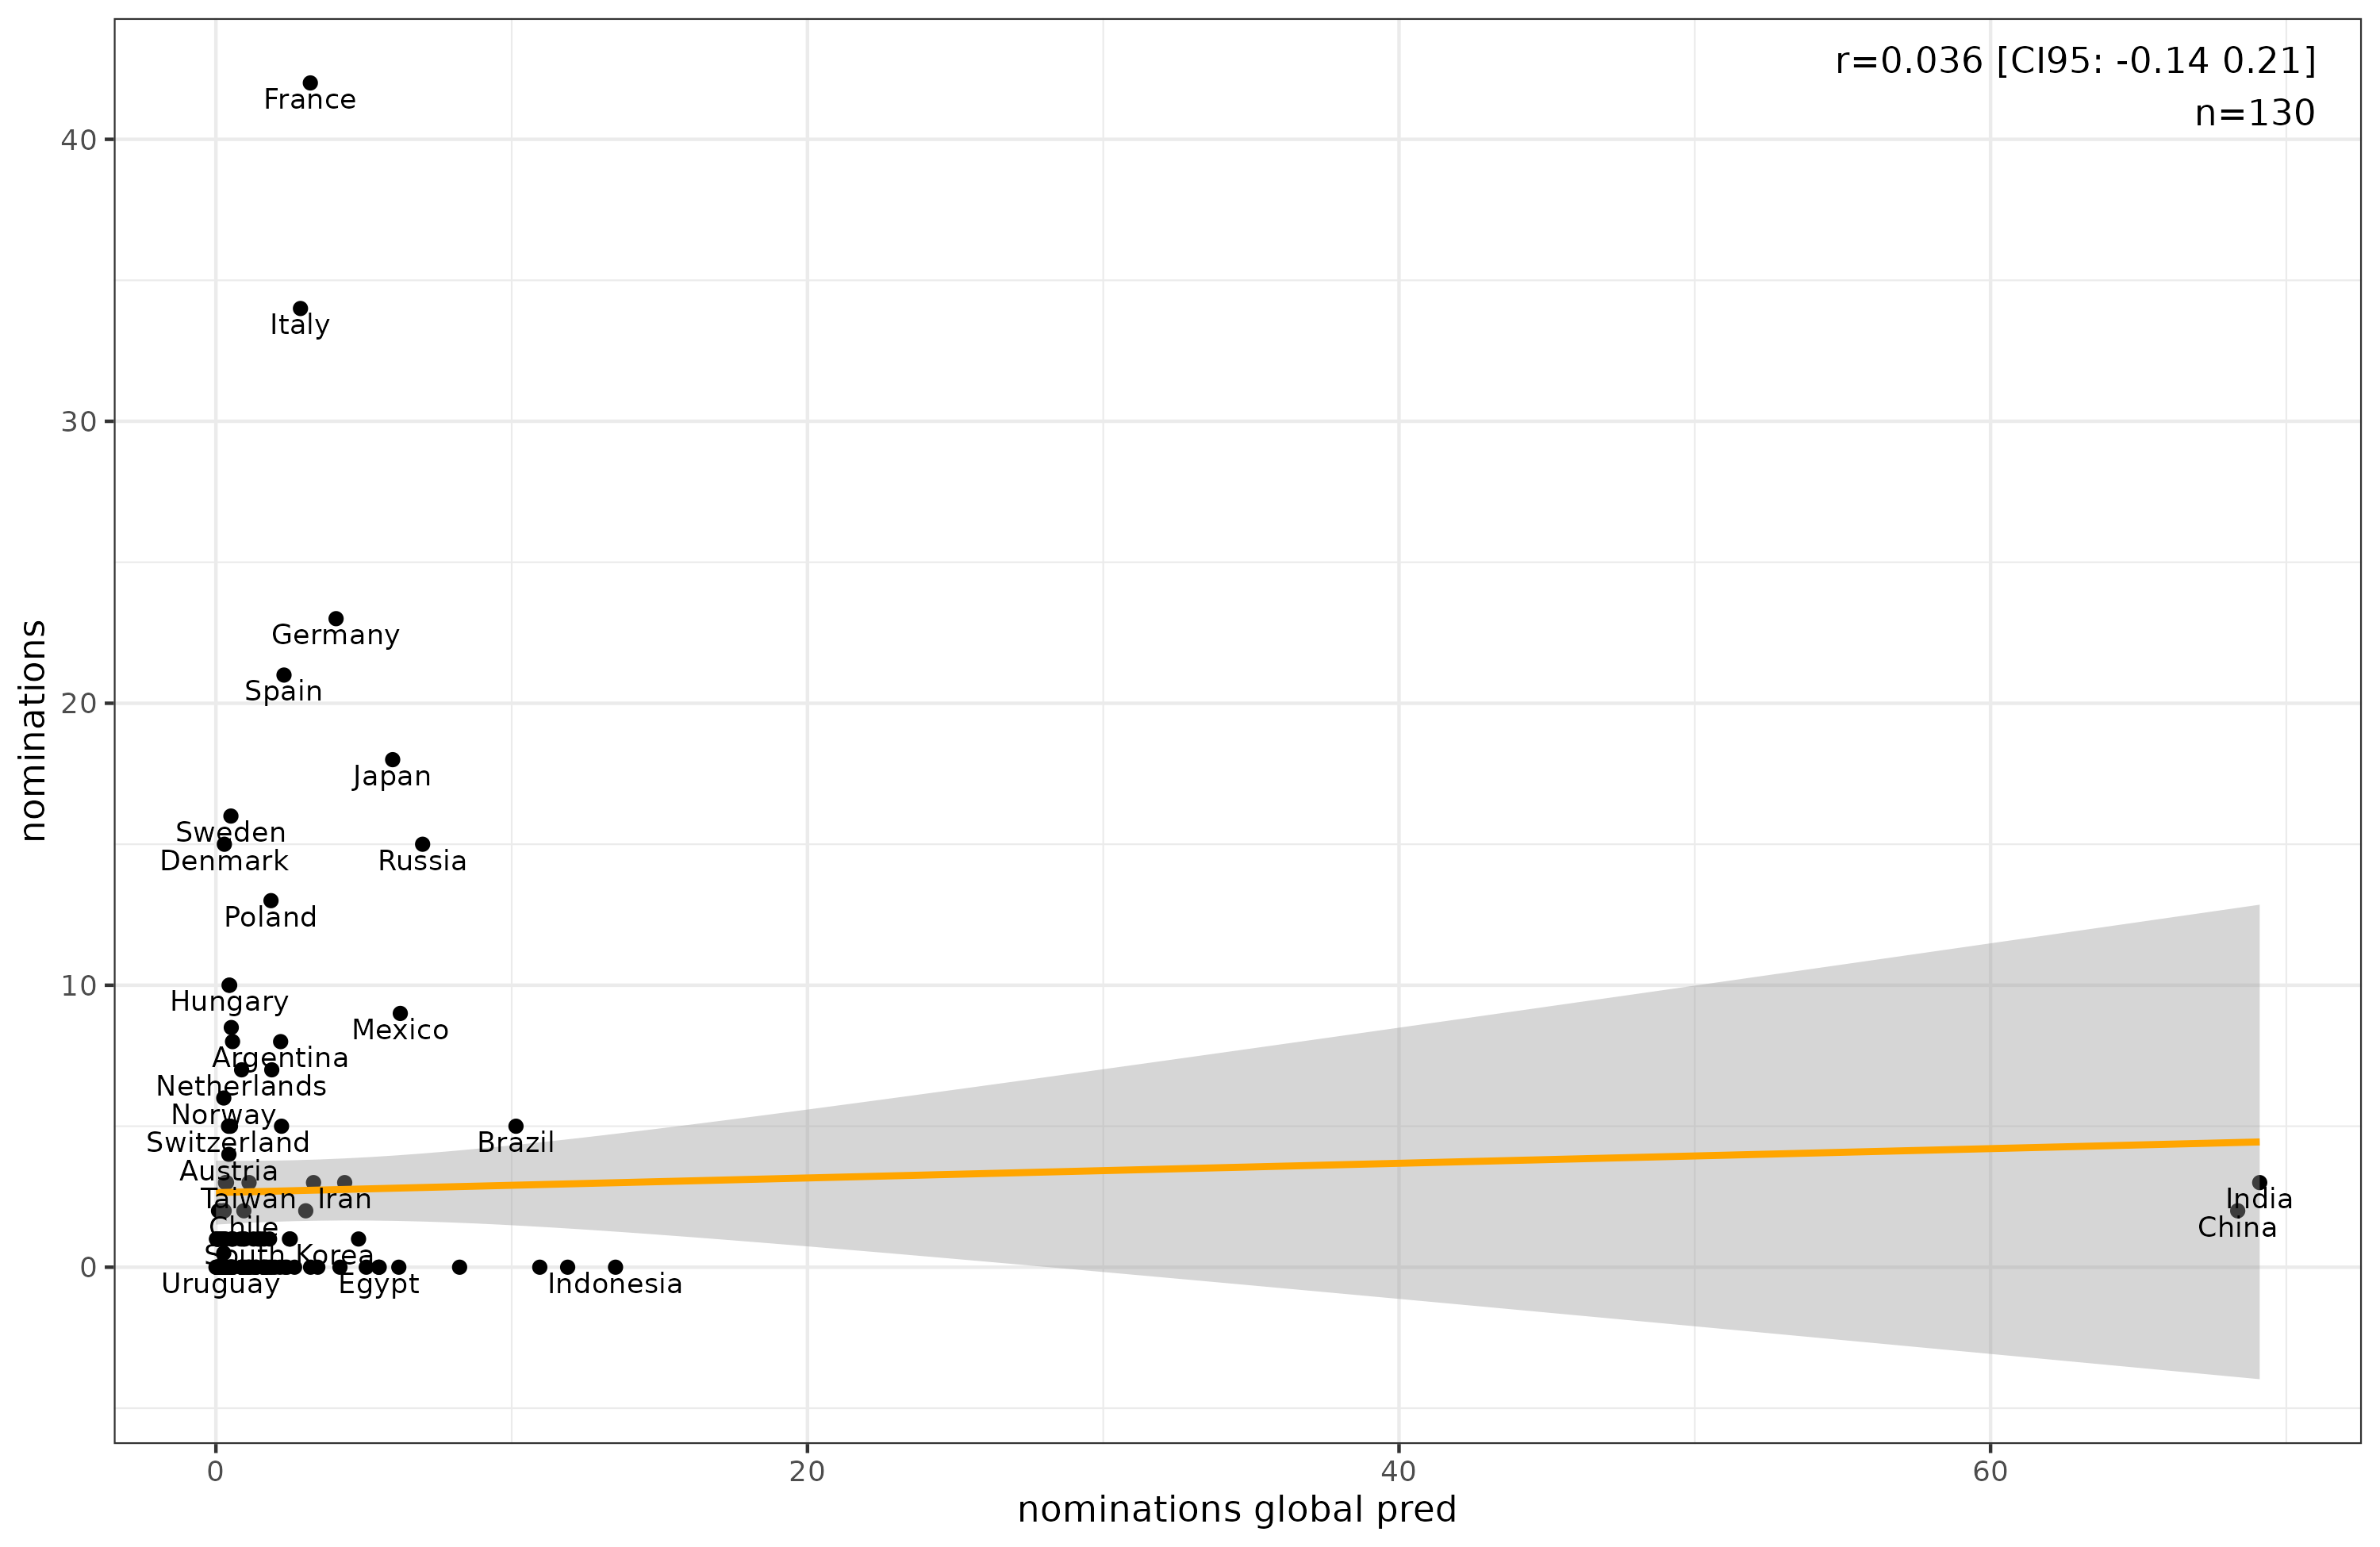
We see that population size by itself is a terrible predictor of number of nominations. The correlation across 130 countries is not even significant (r = 0.04!), mainly because of the extreme outliers of China and India. The difference between the expected (predicted) nominations and actual nominations is the residual (the error, or unexplained part). One could use this to rank countries, but it still has issues with population size. Denmark, Sweden, and Russia have 15-16 nominations, but Russia's population size is enormous compared to the tiny Scandinavian countries. Here's some informative metrics derived from this approach:

Take France as a case study. It got 42 nominations with a population of 66M. This population size means we expected it to get 3.2 nominations, thus, it got 38.8 nominations more than expected. In per capita terms, 0.058 extra nominations per million inhabitants. Denmark got 15 nominations with a population of 6M, which gave it an expectation of 0.3 nominations, so an excess of 14.7, or 2.47 per million inhabitants. While this final metric is intuitive, it is really just the familiar nominations per million restated, as Iceland comes out ahead in exactly the same way (1 nomination, 0.02 expected, 0.98 more than expected, 2.53 per million inhabitants).
One thing to realize here is that per capita is actually wrong. Winning a nomination, that is, a semi-final placement, is not a threshold function like being above some number of standard deviations higher than the mean. It is about being in the top 5 that year for all submissions. In other words, it's about being in the top 5 extreme values. The chance of a population producing a case in the top 5 is not a linear function of it's population size, but suffers from diminishing returns. Here's an illustration:
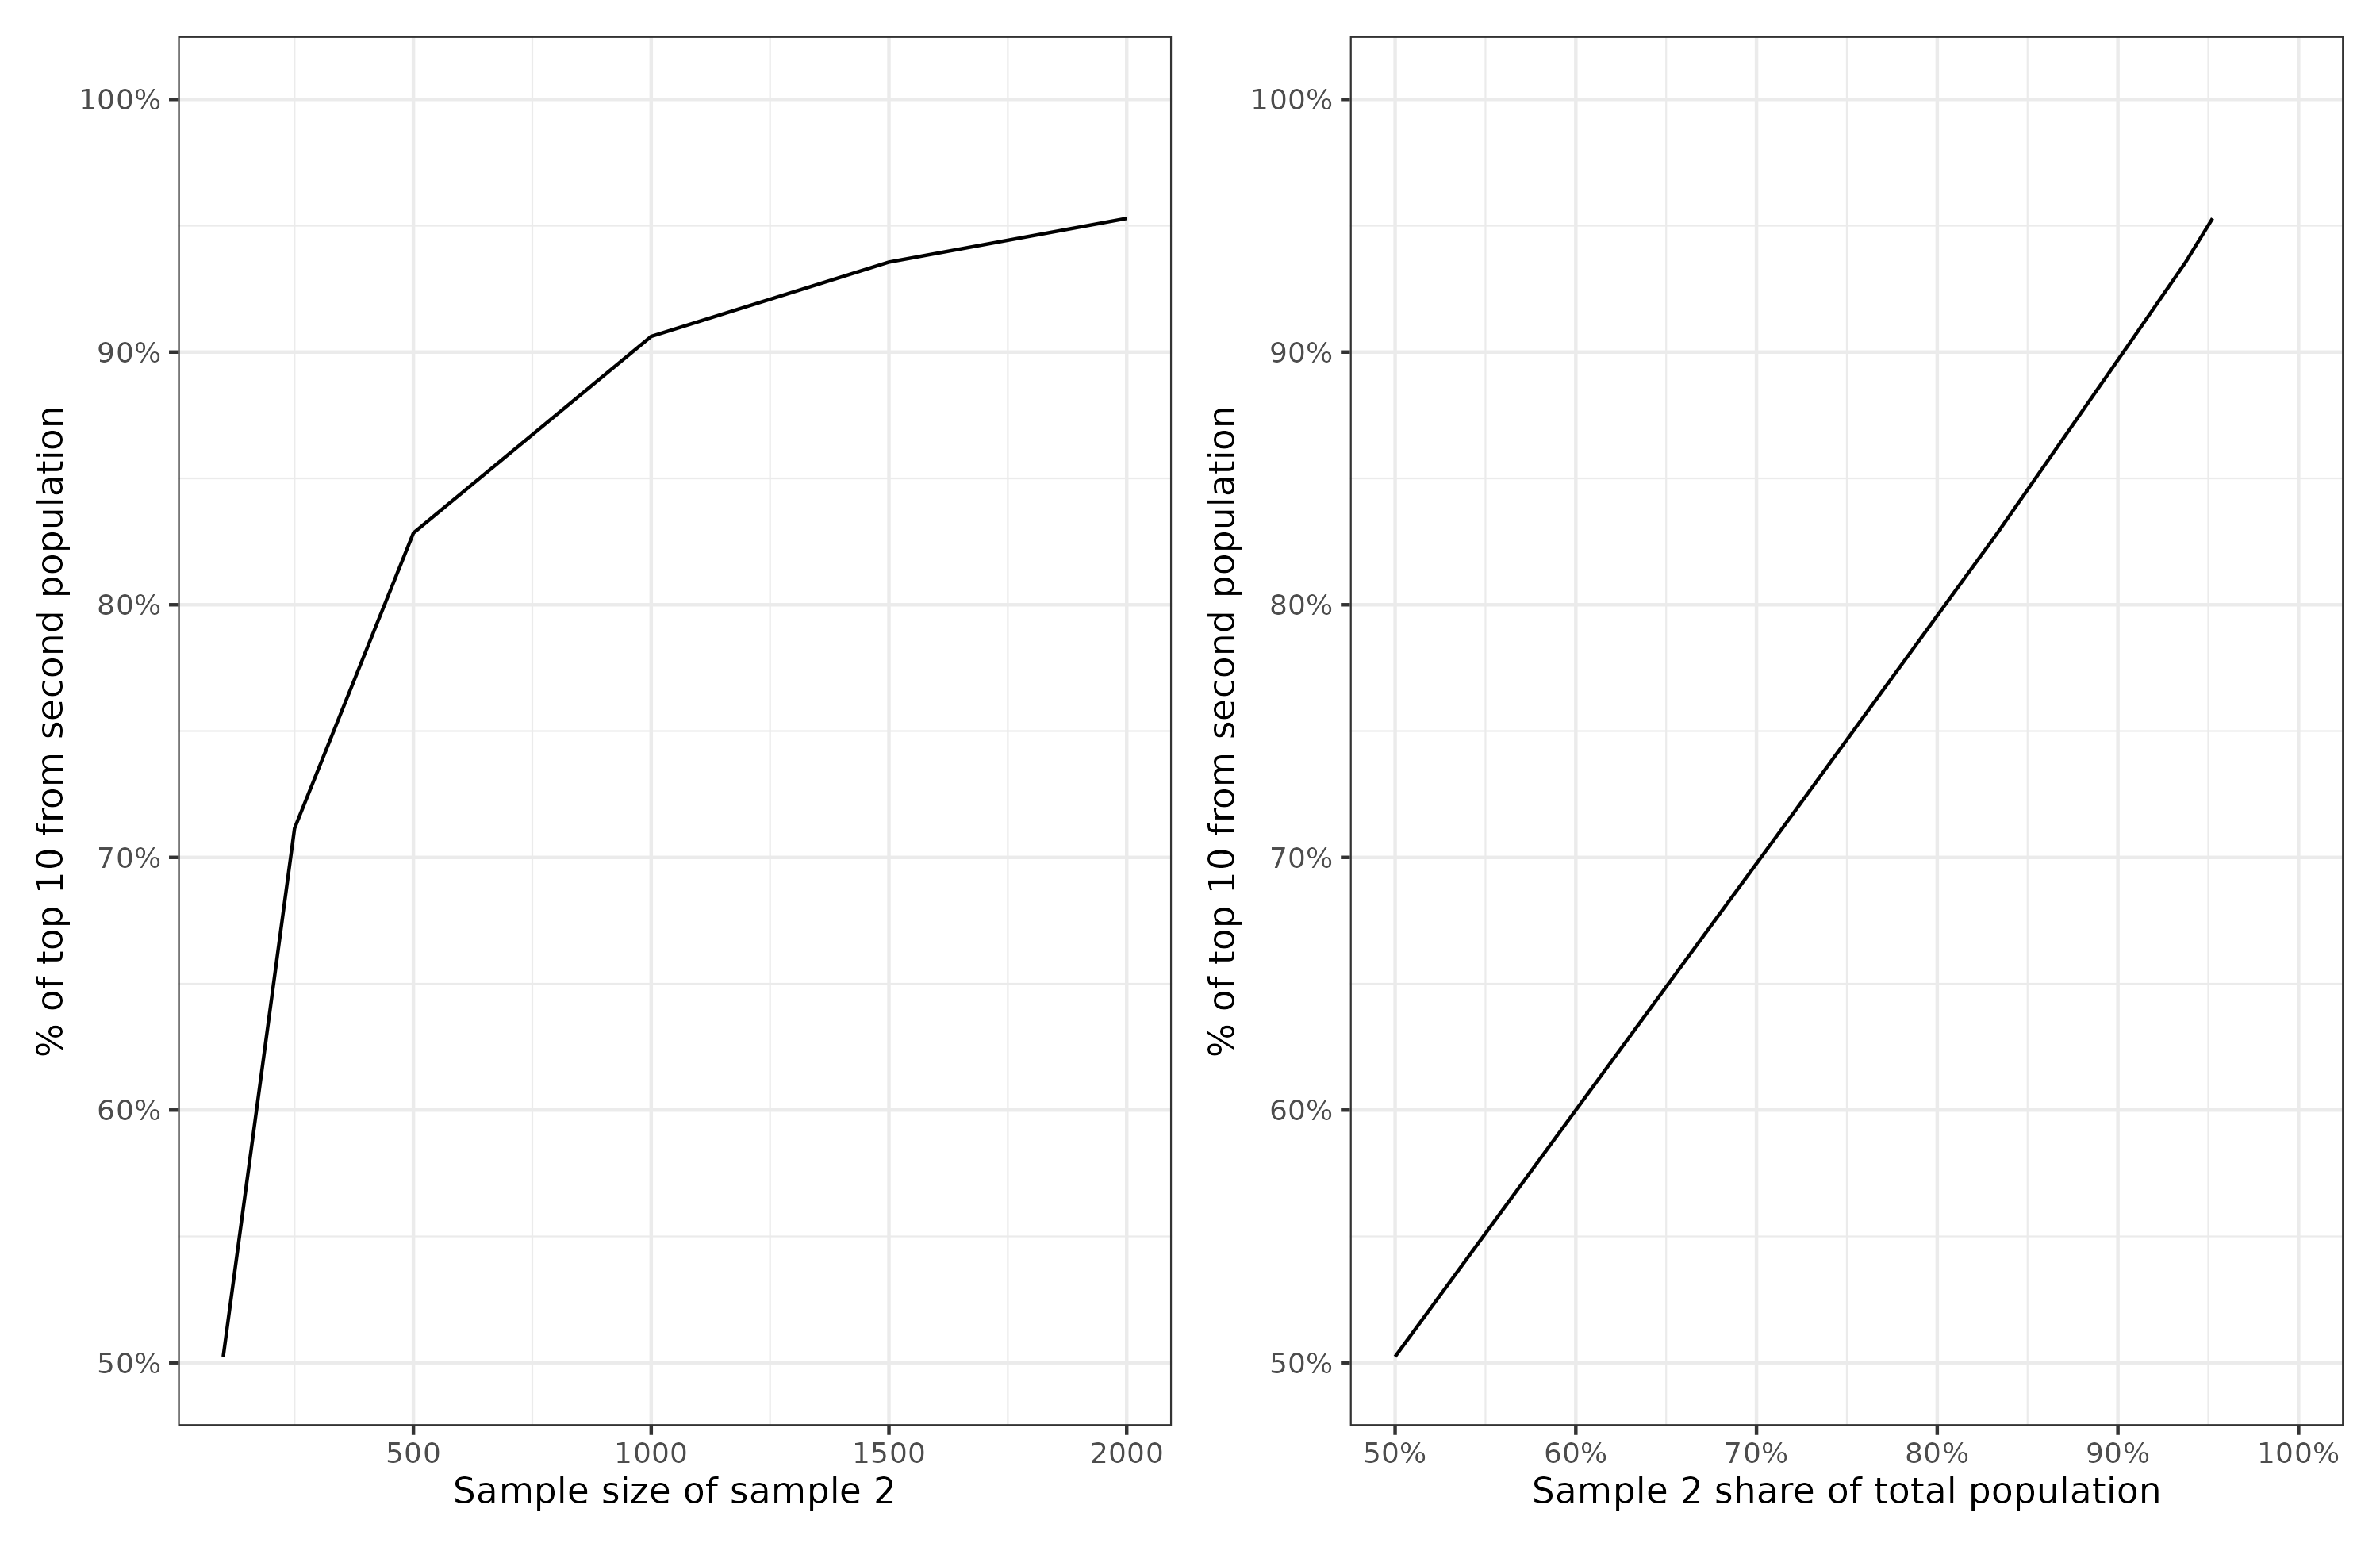
The effect of population size is linear only with regards to proportion of the total population (so, the world population in the case of countries), not with its own population.
For this reason, and to deal with the outliers, it may be wise to use a log transformation of the data. In some areas of science dealing with rare events (like terror attacks), a log-log model is often used: log(count + 1) ~ log(population) + [predictors]. This results in more well-behaved residuals. It looks like this:

This is by no means a pretty model or impressive result, but it is better than what we tried before (r = 0.04 vs. r = 0.20).
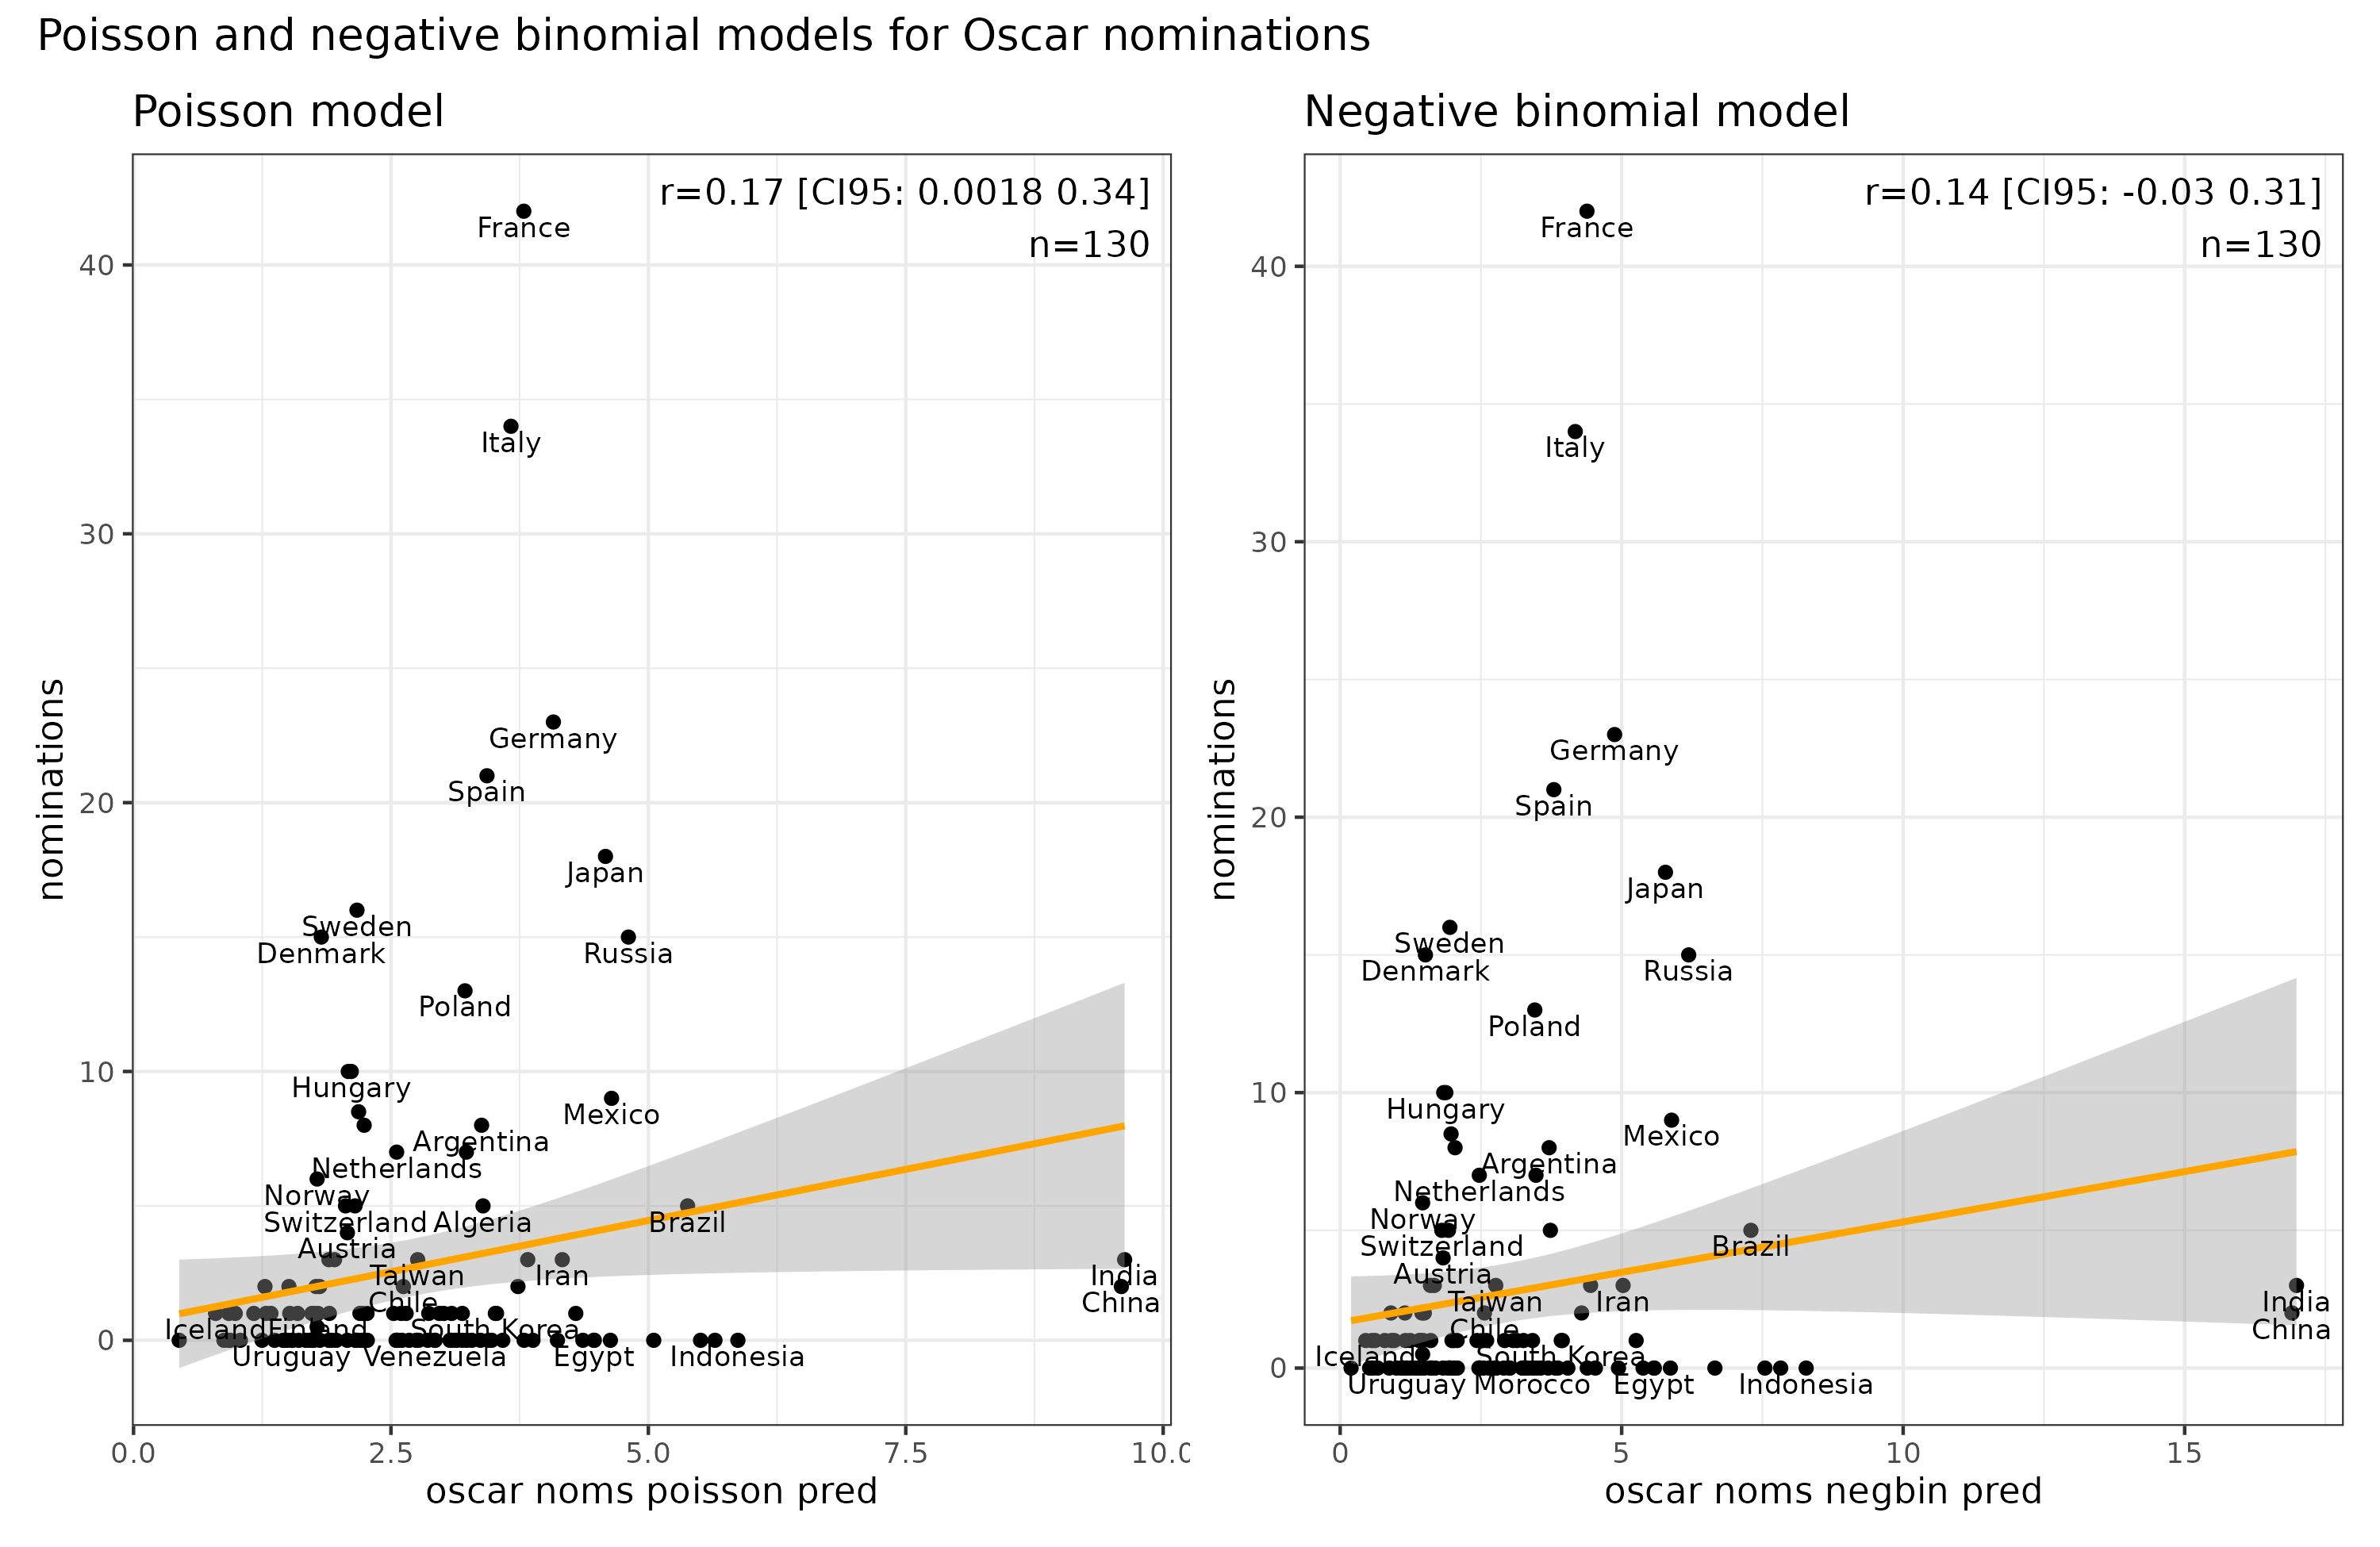
What about Poisson and negative binomial count models? I tried these too (had to multiply values by 2 because a few countries had ½ values due to shared points for a win and count models require non-negative integer data). They aren't much more impressive:
At this point maybe, hopefully, you are thinking: why not go full Bayesian? After all, we have a reasonable global prior (worldwide average rate per population) and we have some partial information about each country, and the goal is to estimate a plausible estimate given both data points. Here's the Bayesian empirical Bayes using this package.

The red values are the raw estimates (observed nominations per million), and the turquoise are the Bayesian posterior estimates. For every country, these will be closer to the global mean, but the shrinkage is stronger the less information we have about them (small population, few wins). Iceland thus shrinks from world #1 to #7, though this is probably not enough considering that the entire signal for it is 1 nomination. Looking at the countries with the highest posteriors, these are Nordics (Denmark, Sweden, Norway, Iceland), Jews (Israel), and a few small countries with 1 nomination (e.g. Montenegro). It is especially interesting that both countries with anti-communist uprisings are present (Hungary, Czechia, though Poland is further down). These are also the same two countries with the highest rates of porn stars per capita. There's something special about Hungary and Czechia with regards to free-spiritness.
Overall, this kind of ranking is roughly what one would expect, but suffers from severe issues:
The data omits the most productive country, USA.
The data are very sparse (77 wins, 353 nominations), giving very imprecise estimates for most countries.
The data reflect the opinions of just the Oscar awards, not other experts or the population at large.
The way forward I think is to get the IMDB and Rotten Tomatoes data and repeat the above analysis, using e.g. the top 5000 movies to boost the sample size. Interesting would be to look at different raters. IMDB used to provide ratings by different subgroups:

It's unclear why this was removed, and now it's not so easy to filter out votes from different countries. Some speculate this is to avoid making it obvious that some countries have very positive voters/cheat (India, Turkey).
In any case, after one has collected a lot of data, and assigned countries to each movie, one can try using national predictors to see what predicts being high quality cultural output. It's unclear whether America will be the number one taking population size into account. Recall that America seems dominant in science, but actually America's per capita performance in science is unimpressive, at the level of Greece. I expect that Nordics, Czech/Hungary, Italy, France, and Japan will still score high. South Korea has been making very nice movies since the 1990s as well, so if one limits the time span, results may differ quite a bit (sampling error aside).
On a statistical note, this is the same kind of statistical problem as when calculating who does best at the Olympics. There's a lot of writings about that problem. This post presents the raw per capita for 2024 Paris Olympics and we see the familiar small country bias.

This post presents the Bayesian estimates:
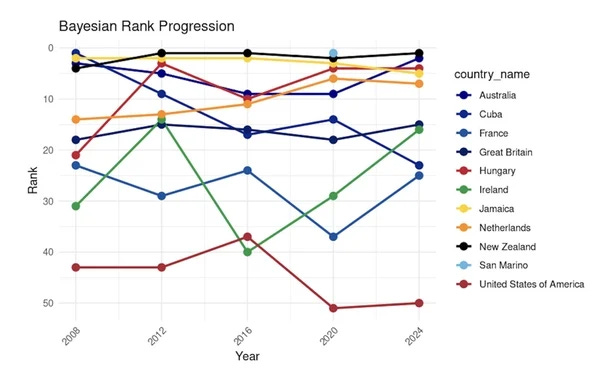
Unfortunately, only this small grainy figure. We see that America does rather poorly, ranking 50th in the world. New Zealand is apparently the true king of the Olympics per capita. I wasn't able to find a full length Bayesian analysis of the Olympics, but maybe it exists. I am not that much into sports, but maybe Steve Sailer can jump in and find it.
Oscars are an awful metric as they represent the views of american movie industry and their political values.
Italy, France and Germany used to be movie making and pop music international powerhouses until the 70's. Since then their cultural products barely get noticed in their own countries and in the rare occasions they try to reach foreign markets they do with english language products.
Would be fun to see some statistics like foreign language songs in national music charts in Europe over time. I bet korean language songs are more likely to chart in Europe than european but not in english and not local songs.
Complete cultural victory for the Anglophones over Mainland Europeans.
"Second, start with the list of Oscar wins, a rare critic-award."
The Oscars have nothing to do with critics. They are voted on by members of the US academy of motion pictures, a trade group consisting of 19 branches that work on different aspects of production. Only some branches are eligible to vote on certain awards (directors probably can't vote for best costumes, costume people not for actor). Everyone votes on best picture type stuff, but that means you're getting lots of technical voters and vapid artists giving popularity opinions rather than real artistic merit you might expect from critics.