
Who is best at the Olympics? Not America
Analysis of all the Olympics data using Bayesian shrinkage

I am not particularly interested in sports unless it involves statistics. Recently, a major topic on X is posting about this or that US winner. Stuff like this:

So let’s check if the US is exceptional. It is true that it has the most medals overall, but it is also the most populous Western country by far. It is also true that Americans are very into sports, but I think mostly as observers and to some degree as semi-professional participants with the weird college sports stuff.
Working with Claude, I built a dataset of all Olympic medalists, split also by season. We only really care about the summer Olympics since few countries participate in the winter one (a few rich countries with mountains).
The first problem with doing this is that many countries (or country-like units) split or merged during the period since the games began. For consistent counting, I created 2 datasets: all-time and modern. All-time is all countries with consistent borders since the first summer games in 1896. This means that some large countries like Germany and Russia are missing. This is because Germany was split 1945-1990 period, and we can’t just merge the data because it gives them double chances of winning. USSR included a number of countries, such as Ukraine, and we can’t easily split them. The modern data are from 1994, which includes all the East Block countries, though missing a few later splits (rest of Yugoslavia, Sudan).
Next I calculated the average population size for the same periods. Using these we can calculate the winning rates (medals / population). I use all medals for boosted statistical power, using golds only would give 1/3 of the data, and the objective difference in performance between top 1-3 is rather small. Next issue is that small populations result in large standard errors. So the top performers by the raw rates are going to be small countries/islands. To avoid this issue, we can penalize/shrink the data towards the global mean using empirical Bayes. This is the same method I used for the Oscar winners movie study. With this done, we can compare the results:
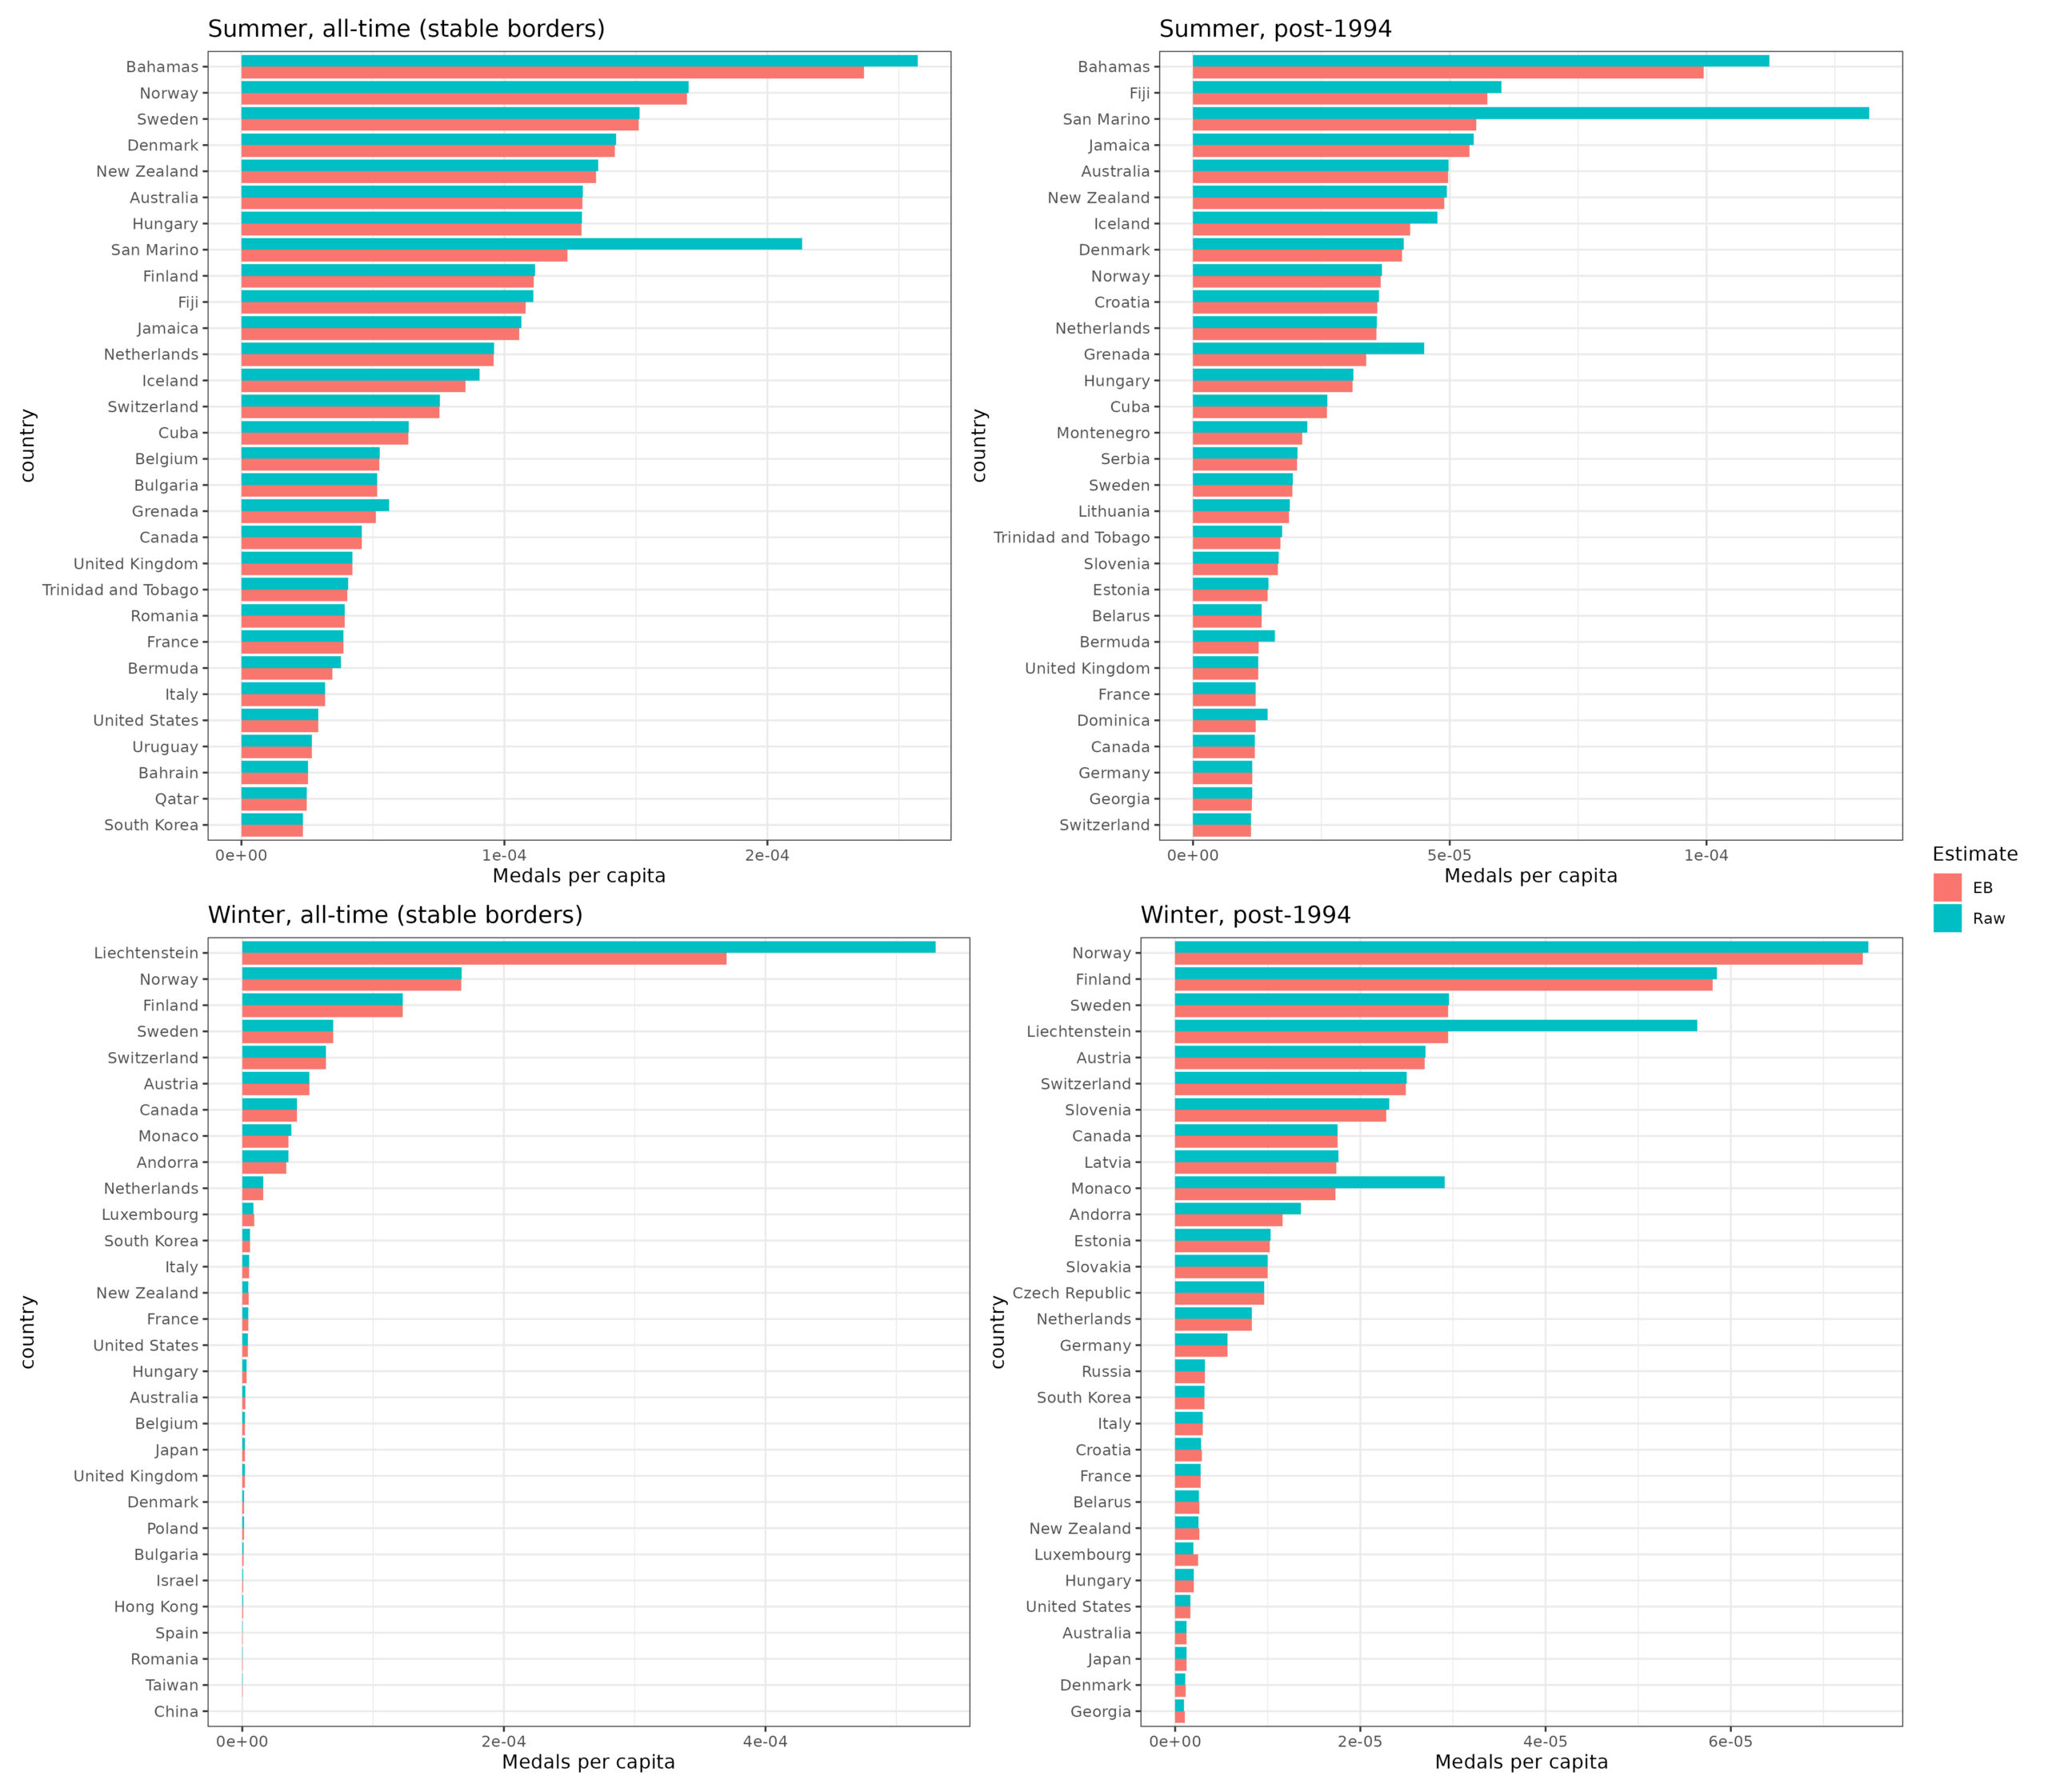
Red = adjusted and turquoise = raw rates. Notes:
For winter sports, we see both issues as Liechtenstein dominates with a tiny and mountainous country.
Fiji: It’s a tiny population and they are really into rugby (4 medals).
African/Caribbean: sprinting/track & field
Cuba/North Korea: heavy state involvement.
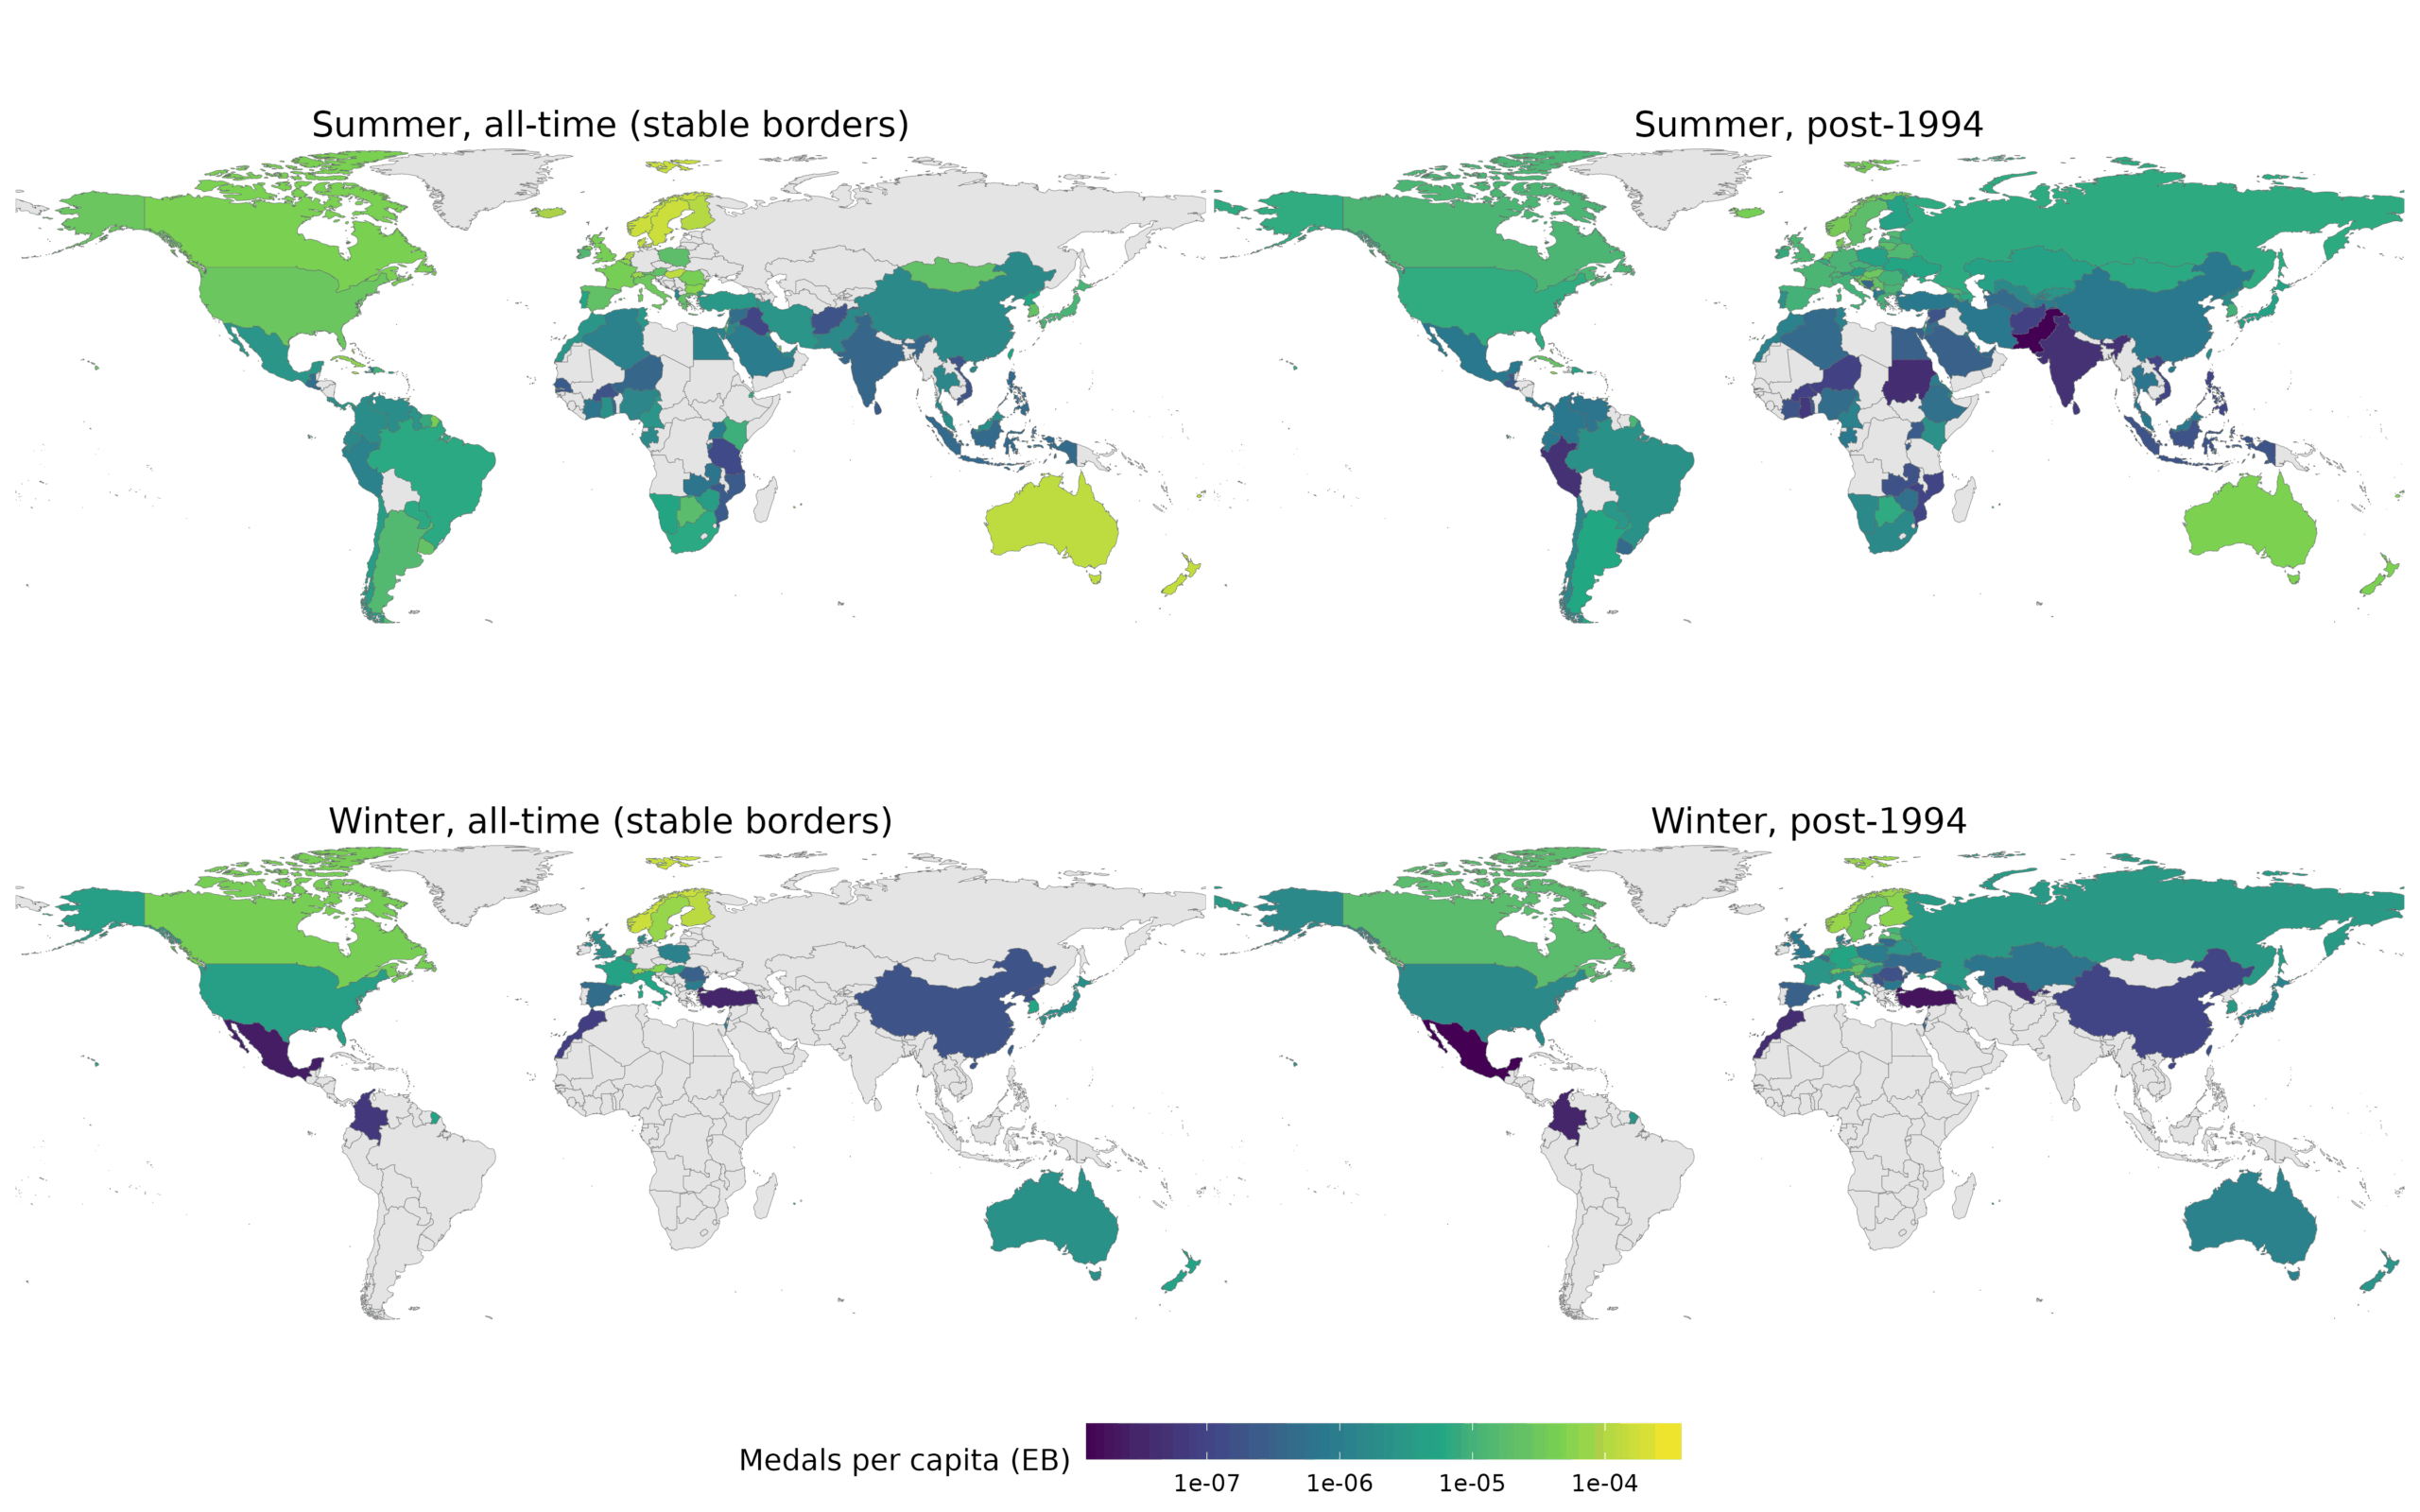
Anyway, looking at the top list for the summer data sorted by adjusted rate, we see some small countries that probably got lucky even after adjustment, as well as the Nordics, south Anglos, and a few East Europeans. USA does not perform that well. For the all time data, it ranks 26th of 116 for all time data, and 46th of 133 for 1994+ data. It’s good but not great. There’s no evidence of American exceptionalism here at all, just like for science (rank 45 of 226). Maps of winning rates:
So let’s go further and look into what predicts winning more at summer Olympics. I am not going to bother with the winter data because it is already obvious from the list above. Here I used a negative binomial since we have count data as the outcome. Our predictors are population size (average of the period), participation rate (% of games participated in, of the period), and GDP/HDI (average of the period). For the all-time data, we can’t use HDI since data only exist for 1900-present, so I used GDPpc (Maddison). For the modern data, we can use GDPpc or HDI. I compared the various models, and these are the results:
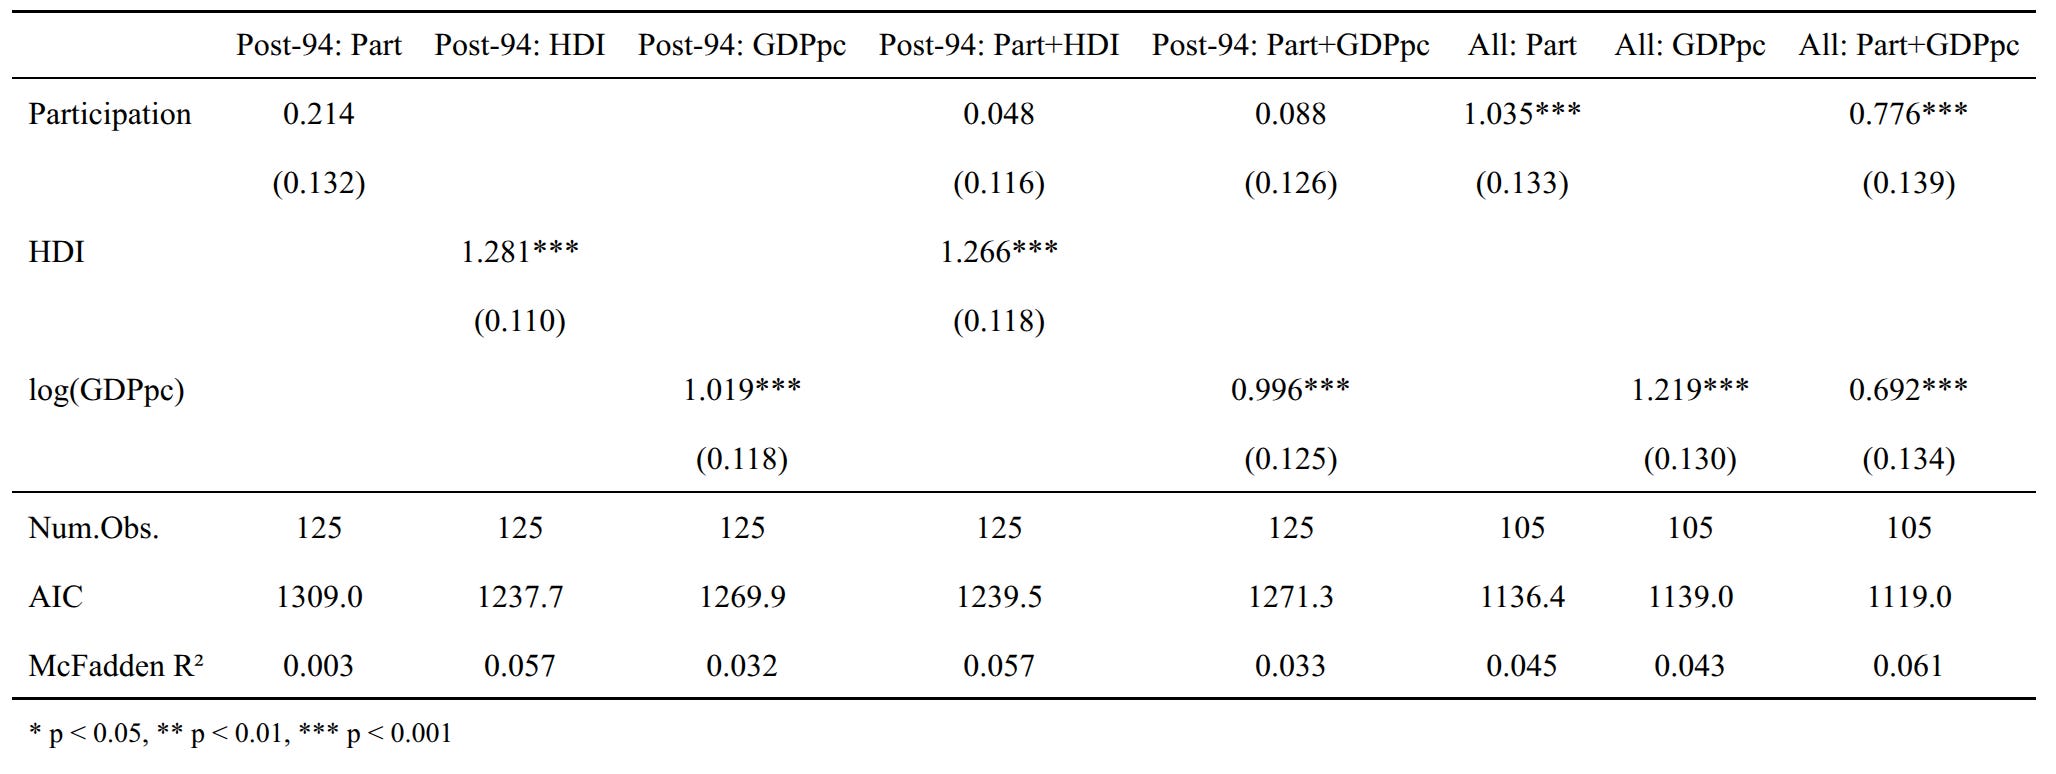
We see that for the historical data, participation was important and there was a lot of variation, and GDPpc was also important. When both are in the model, they both shrink, so participation is probably a partial mediator of GDPpc (poor countries don’t spend money on sending teams). For modern data, participation didn’t predict much mainly because there is little variation to begin with. Country development predicts performance, but HDI was a bit better than GDPpc. For the best models, we can look at the residuals for any clues to what explains the rest of the variation:
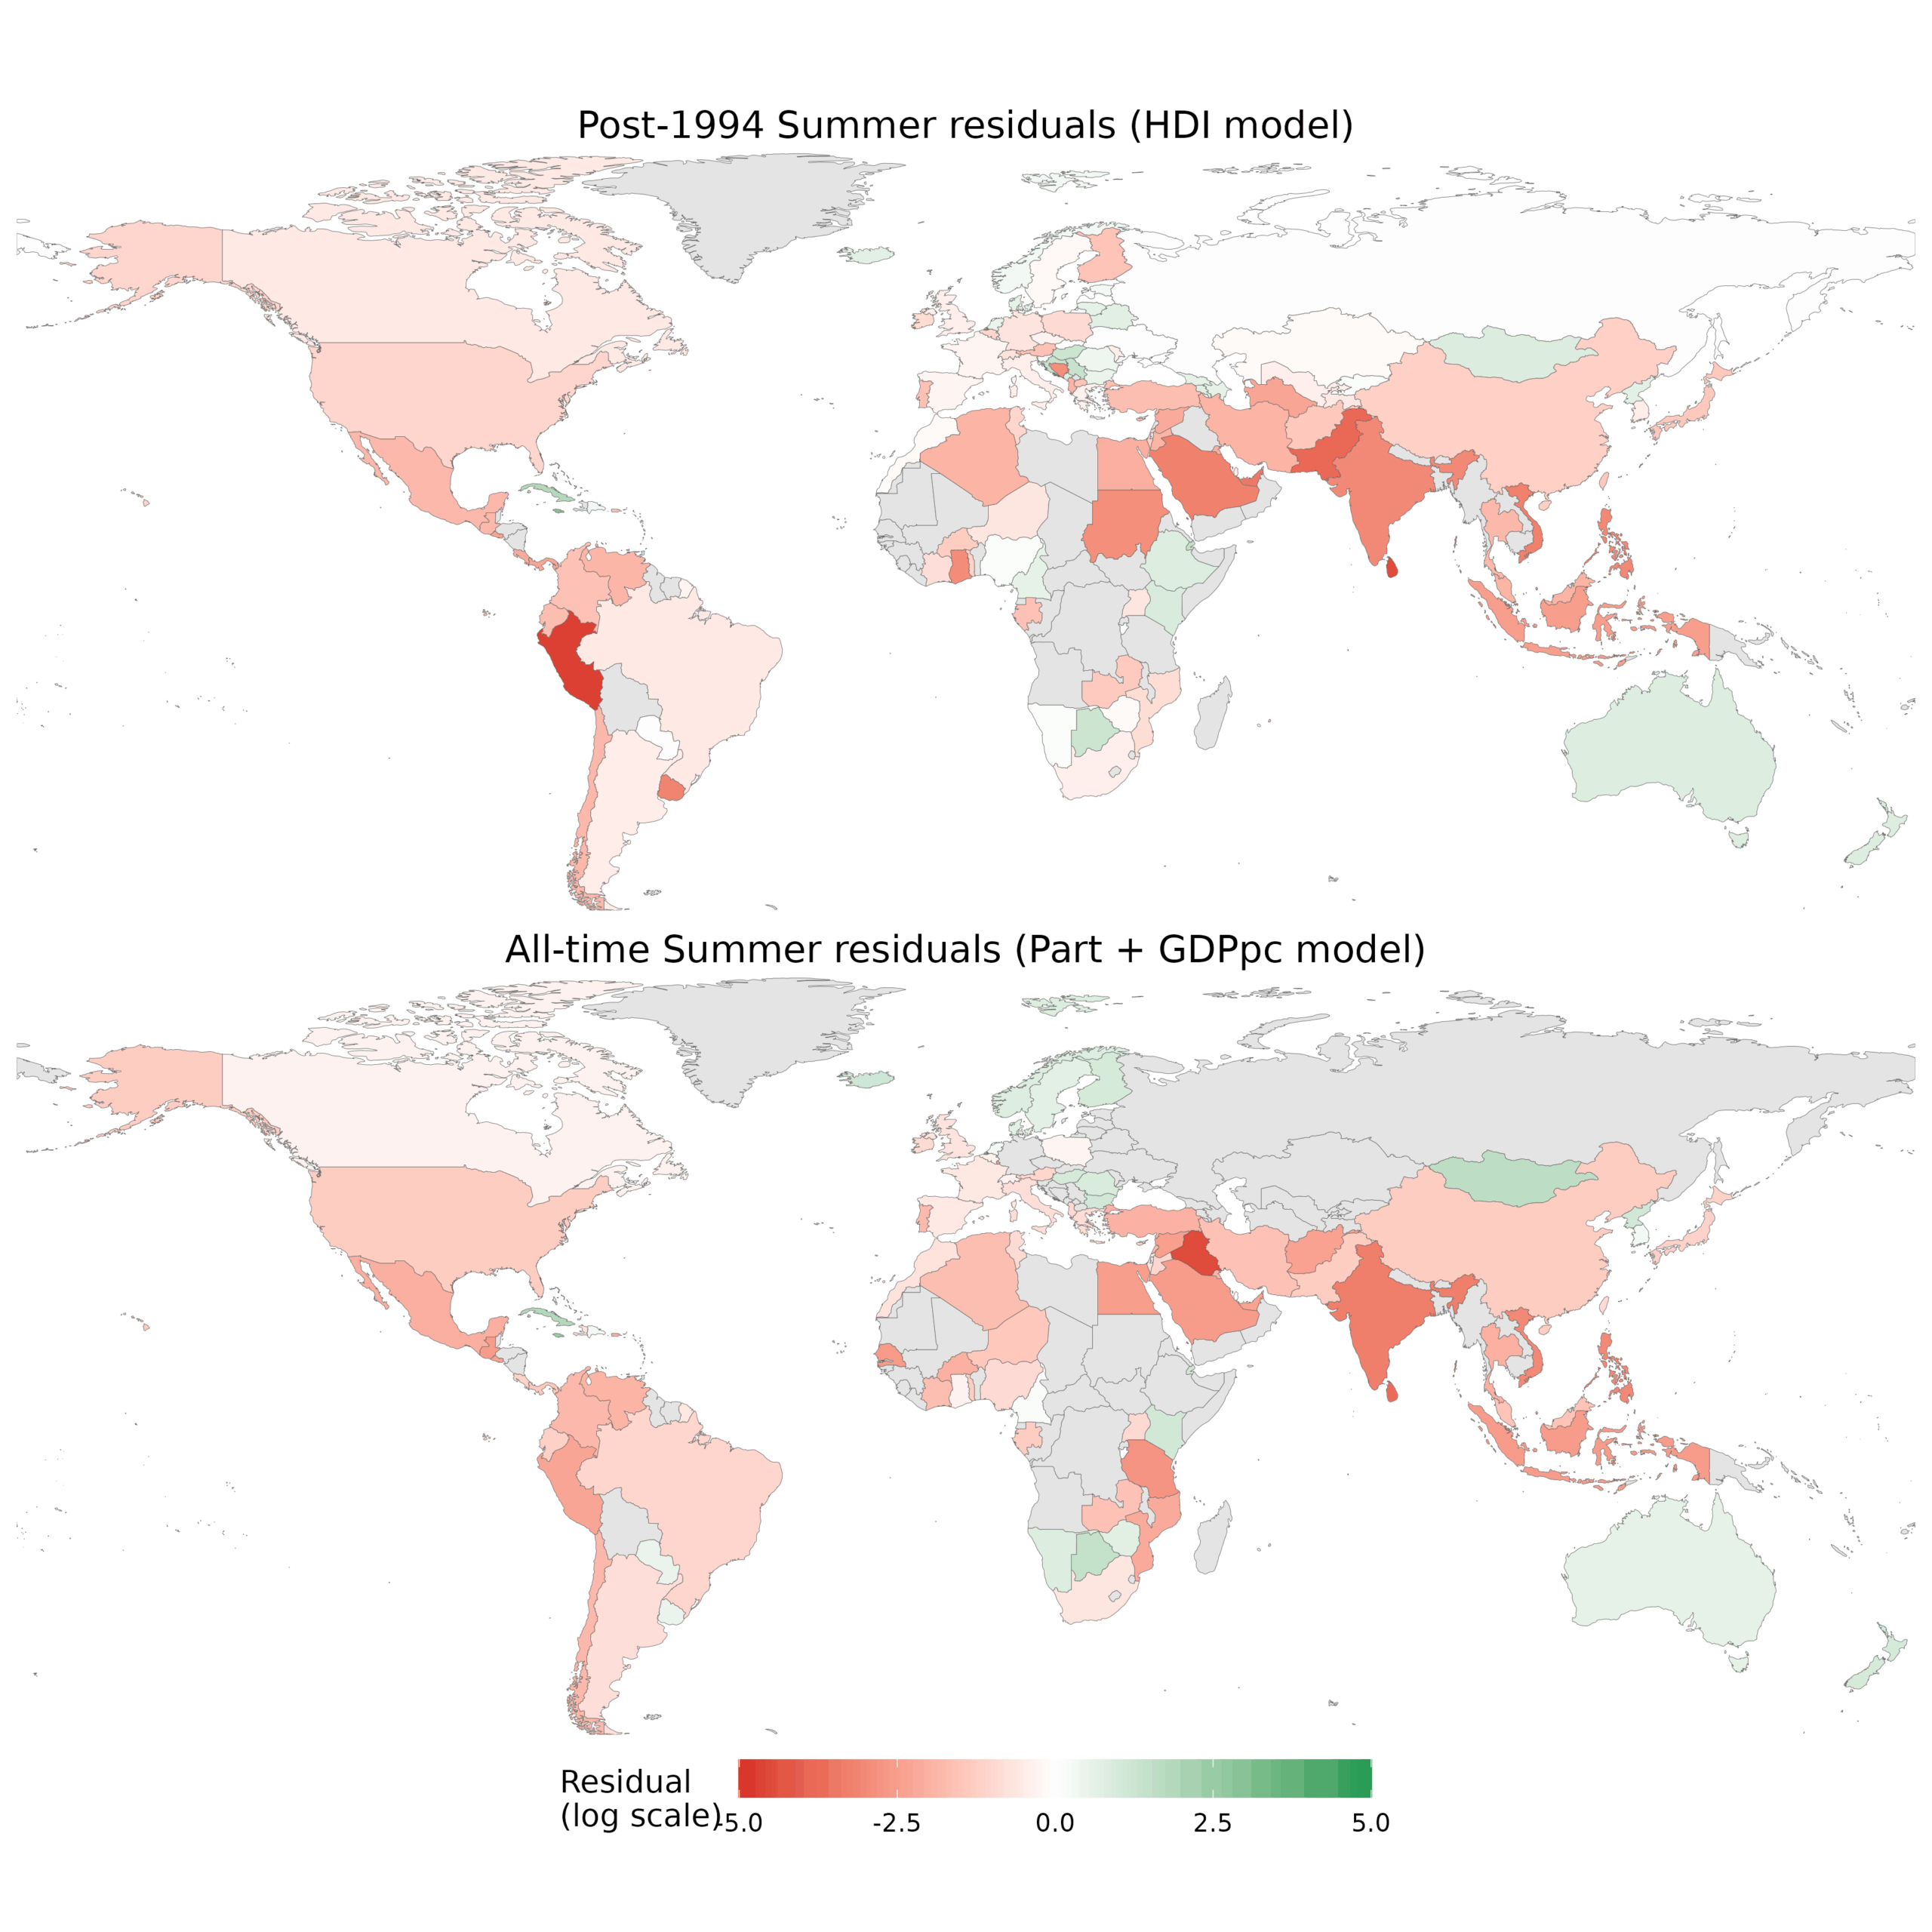
For the modern data, the positive residuals are Cuba, Nordics (not Finland), south Anglos, parts of Yugoslavia, and a scattering of others. The Americas, Muslims/MENAPT, and Asians underperform (except for North Korea). The all-time data shows about the same.
Anyway, so there we have it. These are the top performers at the Olympics. R notebook is here, and Github repo with data is here.
Simply a salty Dane trying to discredit their superior neighbour 🇳🇴💪💪💪
Smaller countries tend to have some inherent advantages in these types of statistical analyses due to limitations on the number of entrants in each event. For instance, huge America is allowed to enter only one team in Olympic basketball, so the best it can do in basketball is win a single gold medal with its 340 million people.
Croatia, in contrast, with a GDP about 1% of the United States' can also do no more better in basketball than win a single gold medal.
Many individual events, such as the men's' 100 meter sprint in track limit entrants from one country to three. It's not uncommon for the guy who finishes 4th in the U.S. Olympic trials and thus misses the track team to have been considered a definite medal contender up until the moment he missed the team by a fraction of a second.
And I believe swimming events allow a maximum of two entrants per country.
That depresses the performance of big countries like America, China, and Russia vs. small countries like Norway, New Zealand, and Serbia. I'm not sure how to statistically adjust for these limitations.
(Croatia and the other Dinaric Alps countries also tend to have exceptionally tall and rugged people, so they may well be more athletic on average.)
Australia and New Zealand tend to do well in a lot of Olympic sports because they aren't as obsessed with soccer or basketball as many other countries are. Their best athletes go into a lot of different sports, whereas, say, the Dutch tend to be obsessed with finally winning the soccer World Cup after 3 times making the final game.
Ex-Communist countries sometimes tend to be less soccer crazed and tend to have a lot of Cold War infrastructure for winning at Olympic events. Hungary, for instance, was quite successful at soccer for a long time, but they only give out gold medal in soccer at the Olympics, so its Communist government tended to invest a lot of in fencing disciplines, at which Hungary had a strong tradition and there were more medals to win.