
Worldwide subnational intelligence estimates
And other cross-trait imputation ideas

It is already known that intelligence causes social status for persons. There's a very large amount of cross-sectional data, and causal conclusions are derived from various family studies, such as sibling studies or parent-child. These show that the smarter sibling tends to do better than the duller siblings, and the same is true for parent-child comparisons. These have been augmented by polygenic scores in recent years with the same findings:
We tested if education-linked polygenic scores predicted social mobility in >20,000 individuals in five longitudinal studies in the United States, Britain, and New Zealand. Participants with higher polygenic scores achieved more education and career success and accumulated more wealth. However, they also tended to come from better-off families. In the key test, participants with higher polygenic scores tended to be upwardly mobile compared with their parents. Moreover, in sibling-difference analysis, the sibling with the higher polygenic score was more upwardly mobile. Thus, education GWAS discoveries are not mere correlates of privilege; they influence social mobility within a life.
It is also known that at the national level, intelligence also correlates with better outcomes. Here causality is harder to test, mainly because we cannot rely on siblings and cannot experimentally change intelligence, but still we can do kitchen sink regression models, letting intelligence compete with every alternative variable people have come up with. There are two such studies, both of which found that intelligence is the key predictor, along with being poor to begin with (we might add, not having communism).
Between individuals and nations, there are a number of possible intermediate aggregations we could look at. The most common choice is subnational units of some country. These come in various levels, as each country uses its own hierarchy or quasi-hierarchy. These are called administrative divisions and there may be 5+ levels for a given country.
So for USA, the first level is states (50), the second level is counties (3000+). Things can get complicated because of special units that may break the clean structure in certain ways. The US has a federal district, which mostly acts like a state (DC), but it also has 300+ Indian reservations, unincorporated territories (e.g. Guam) and other units (e.g. Minor Outlying Islands). Some countries seem to take pride in making things as complicated as possible. Australia has 6 states, 3 internal territories, and 7 external territories. Each of these have a bewildering variety of smaller units like shires, cities, councils and so on. In general though, each state orders them hierarchically, so that the nation unit is split into a number of first-order administrative divisions, then these split into second-order divisions and so on, and even if units have different names, they are still in the same level of the hierarchy.
Some effort has been made in the last 20 years to conduct studies of subnational units with intelligence and socioeconomic measures. Our 2018 meta-analysis tried to include all of these:
Lynn, R., Fuerst, J., & Kirkegaard, E. O. (2018). Regional differences in intelligence in 22 countries and their economic, social and demographic correlates: A review. Intelligence, 69, 24-36.
Differences in intelligence have previously been found to be related to a wide range of inter-individual and international social outcomes. There is evidence indicating that intelligence differences are also related to different regional outcomes within nations. A quantitative and narrative review is provided for twenty-two countries (number of regions in parentheses): Argentina (24 to 437), Brazil (27 to 31), British Isles (12 to 392), to 79), Spain (15 to 48), Switzerland (47), Turkey (12), the USA (30 to 3100), and Vietnam (61). Between regions, intelligence is significantly associated with a wide range of economic, social, and demographic phenomena, including income (r unweighted = .56), educational attainment (r unweighted = .59), health (r unweighted = .49), general socioeconomic status (r unweighted = .55), and negatively with fertility (r unweighted = −.51) and crime (r unweighted = −.20). Proposed causal models for these differences are noted. It is concluded that regional differences in intelligence within nations warrant further focus; methodological concerns that need to be addressed in future research are detailed.
And our 2016 meta-analysis tried to compile data for all 35 ‘nations’ (sovereign and semi-autonomous) units of the Americas.
Fuerst, J., & Kirkegaard, E. O. (2016). Admixture in the Americas: Regional and national differences. Mankind Quarterly, 56(3), 255.
We conducted novel analyses regarding the association between continental racial ancestry, cognitive ability and socioeconomic outcomes across 6 datasets: states of Mexico, states of the United States, states of Brazil, departments of Colombia, sovereign nations and all units together. We find that European ancestry is consistently and usually strongly positively correlated with cognitive ability and socioeconomic outcomes (mean r for cognitive ability = .708; for socioeconomic well-being = .643) (Sections 3-8). In most cases, including another ancestry component, in addition to European ancestry, did not increase predictive power (Section 9). At the national level, the association between European ancestry and outcomes was robust to controls for natural-environmental factors (Section 10). This was not always the case at the regional level (Section 18). It was found that genetic distance did not have predictive power independent of European ancestry (Section 10). Automatic modeling using best subset selection and lasso regression agreed in most cases that European ancestry was a non-redundant predictor (Section 11). Results were robust across 4 different ways of weighting the analyses (Section 12). It was found that the effect of European ancestry on socioeconomic outcomes was mostly mediated by cognitive ability (Section 13). We failed to find evidence of international colorism or culturalism (i.e., neither skin reflectance nor self-reported race/ethnicity showed incremental predictive ability once genomic ancestry had been taken into account) (Section 14). The association between European ancestry and cognitive outcomes was robust across a number of alternative measures of cognitive ability (Section 15). It was found that the general socioeconomic factor was not structurally different in the American sample as compared to the worldwide sample, thus justifying the use of that measure. Using Jensen's method of correlated vectors, it was found that the association between European ancestry and socioeconomic outcomes was stronger on more S factor loaded outcomes, r = .75 (Section 16). There was some evidence that tourist expenditure helped explain the relatively high socioeconomic performance of Caribbean states (Section 17).
However, many more countries remain to be explored. Helpfully, some academics have already compiled worldwide subnational human development index metrics (income, health, education):
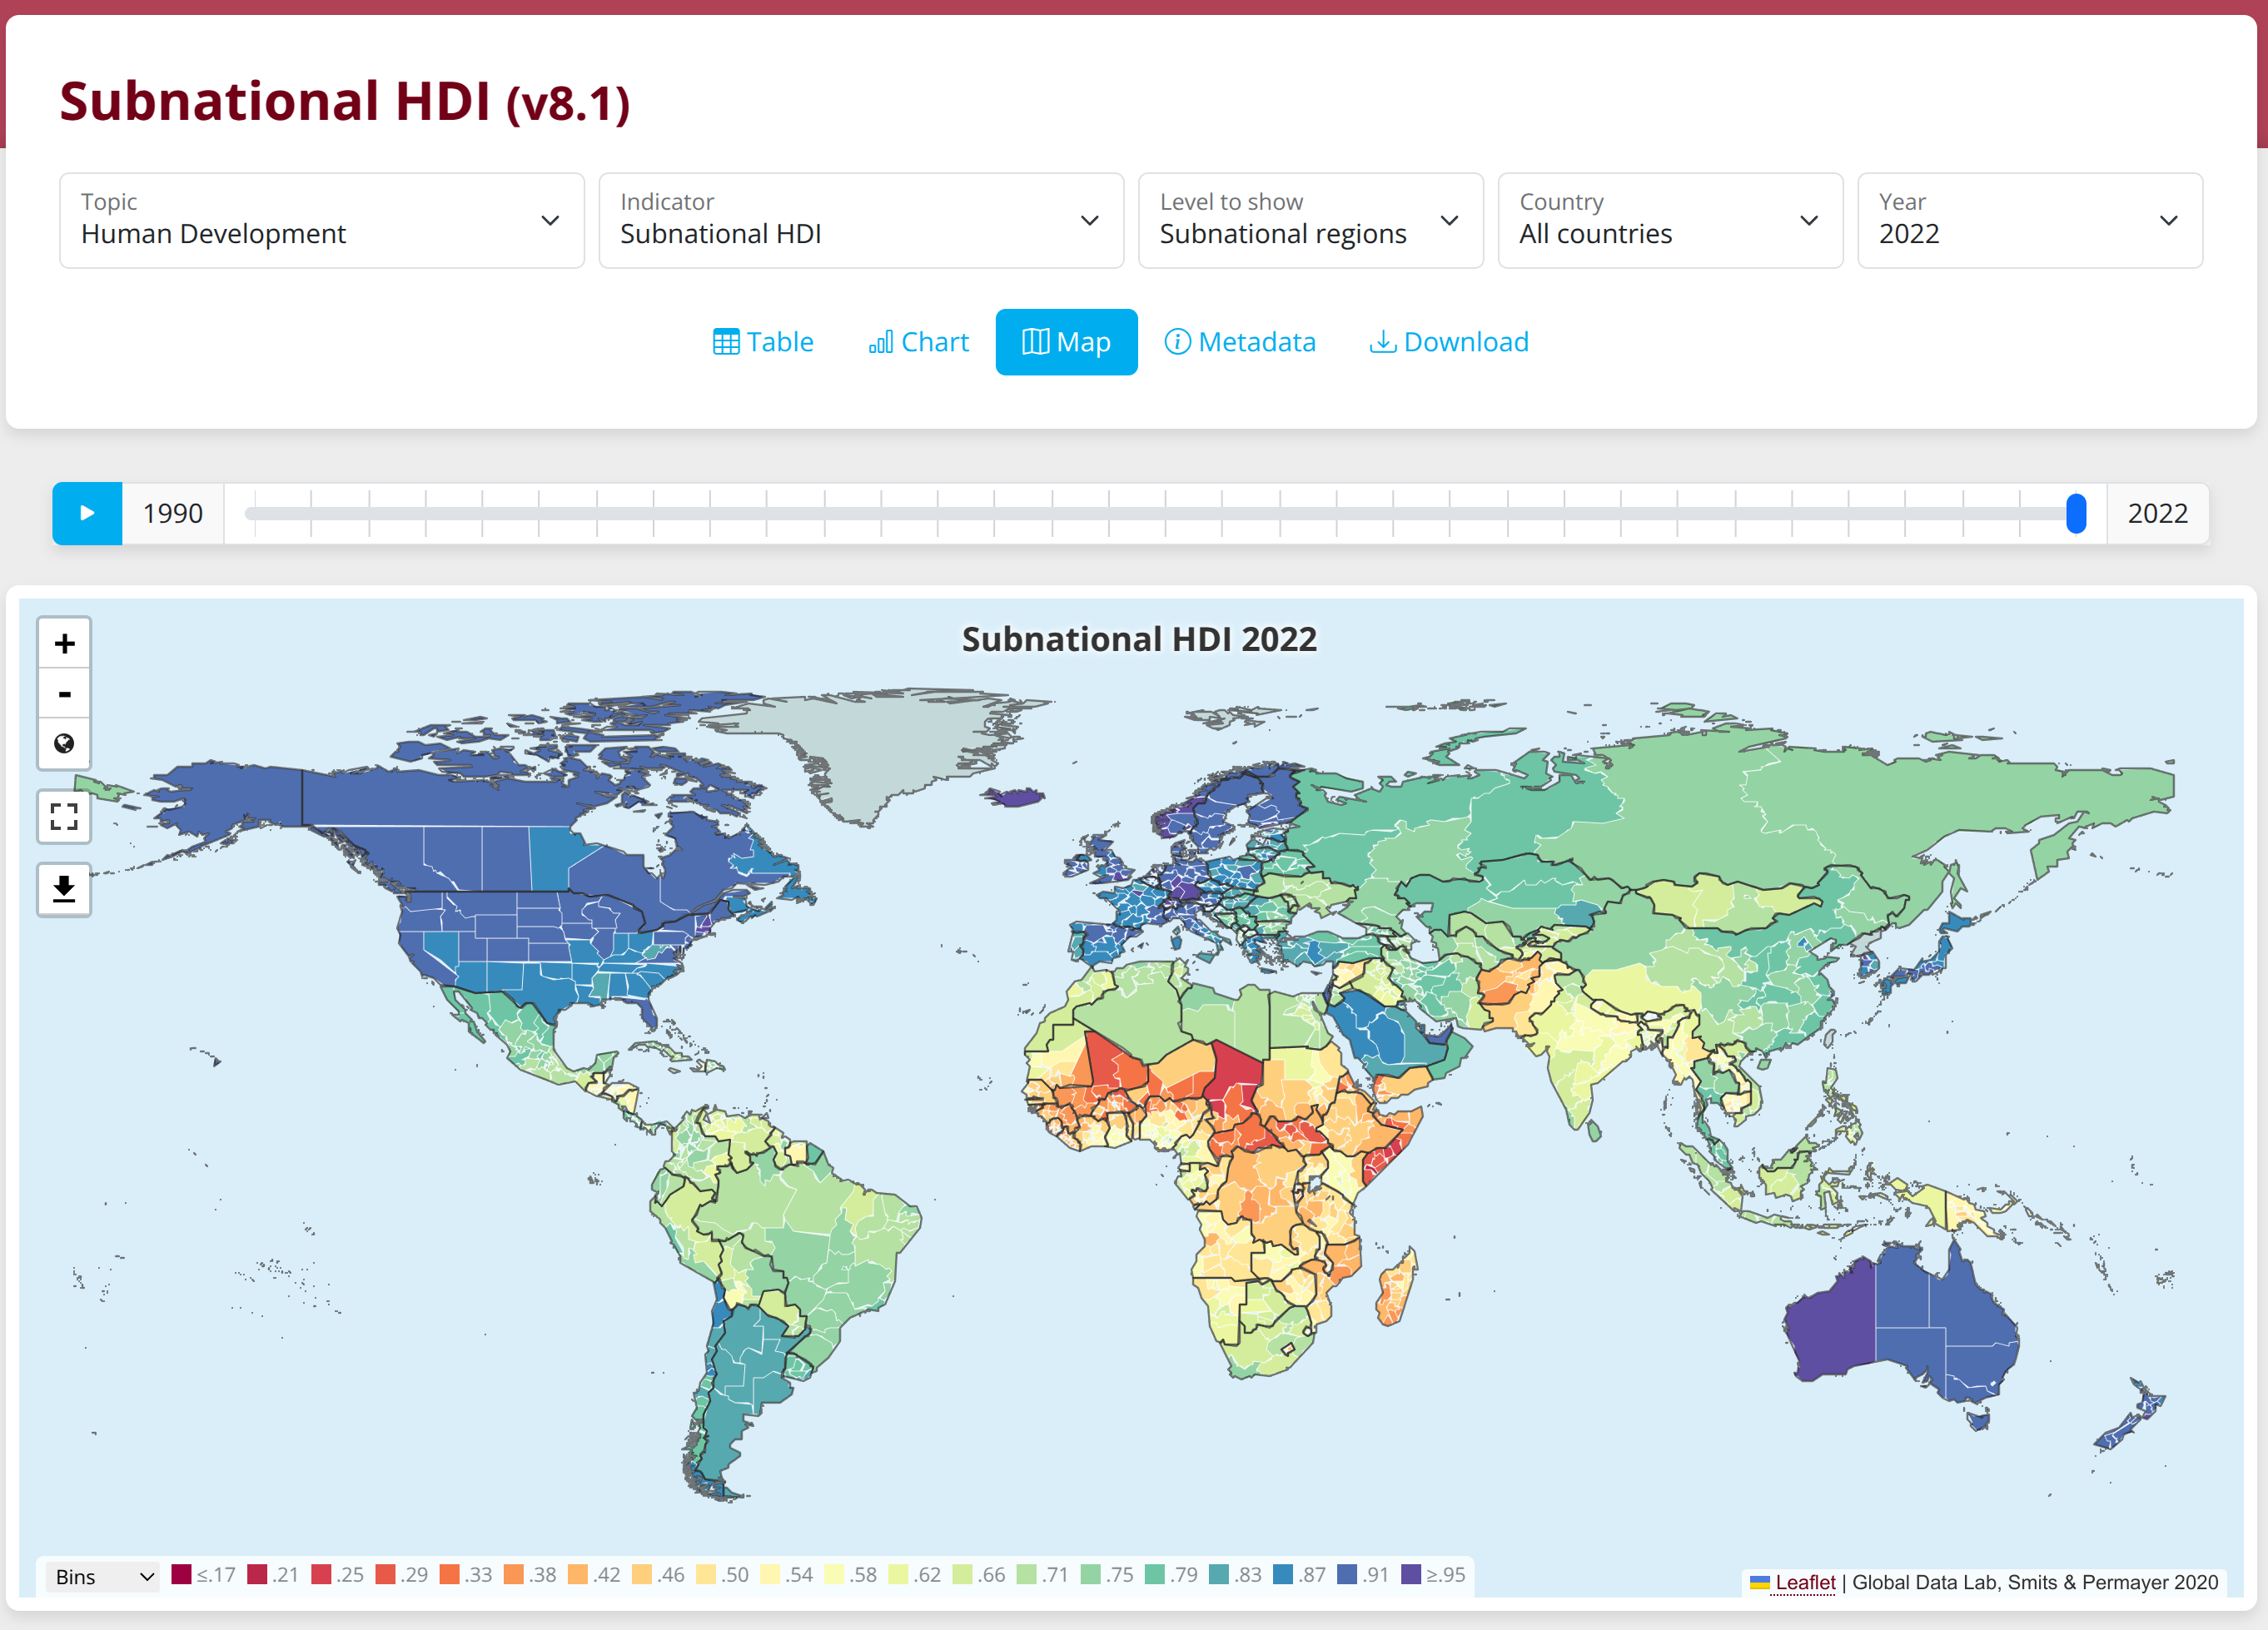
They cover the first-level units for 130+ countries, covering a total of ~1800 units.
However, for large countries, it makes sense to include second-level units too. Most importantly, these are:
United States: 3000+ counties (2nd)
Brazil: 5000+ municipals (2nd)
Mexico: ~2500 municipals (2nd)
China: ~3000 county-like units (2nd)
France: ~100 departments (2nd), ~330 arrondissements (3rd)
Germany: ~400 kreise (2nd)
UK: ~240 districts (2nd)
Italy: ~100 provinces (2nd), 2000+ municipals (3rd)
What should be done:
For countries where subnational socioeconomic (S) data exists, find matching cognitive data. Many countries use standardized scholastic tests for monitoring school performance and these also work as intelligence tests at the group level (with some assumptions). PISA, TIMSS, and various local tests can be found and used to aggregate scores into these units. Usually, such averages are already published by the governments themselves, sometimes, the case-level data is available for download (e.g. for Brazil).
Update the Admixture in the Americas with newer genetic ancestry estimates, and improved intelligence and S metrics. This allows for admixture regression using national and subnational units. This is already ongoing and I expect this project to finish this year.
Impute missing cognitive data using non-S data.
The latter deserves some expansion. A while ago it became clear that some responses to regular surveys also provide data indirectly about intelligence of the respondents.
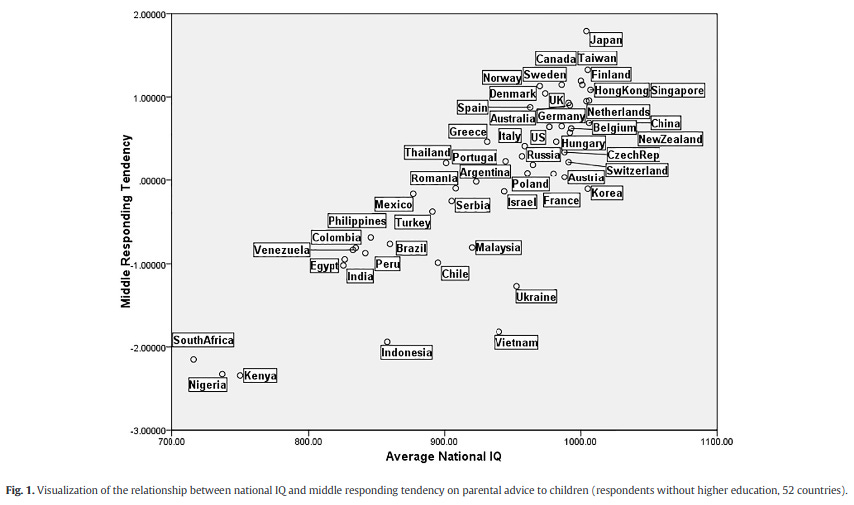
In this study, Minkov (2017) proposed using the proportion of people who choose the middle survey choice as a measure of intelligence. Middling response is the opposite of extreme response style, that is, the tendency to pick the most extreme options in a survey question (e.g. "Strongly agree"). It works fairly well, but could be improved upon. I also recently noted that race and sex gaps in intelligence can be obtained from the same method:
E.g. Blacks 0.25 d more ERS [extreme response style], given the correlation of ERS with IQ of -0.26, this back-estimates to an IQ gap of 0.23 / 0.26 = 0.90 SD; for women 0.34 SD, not so far off!
Given this fact, I proposed (in 2020) that we could simply impute the missing subnational IQs from other data from those units. The method is this:
Get a large dataset of non-cognitive, non-S data for as many subnational units as possible. This can get gotten from e.g. World Values Survey (~100 countries), or European Values Study, or any other semi-global dataset one can find (e.g. various Gallup surveys).
Derive subject-level response style and other metrics from the data.
Train prediction models to predict IQs of subnational units we have IQs for. Ensure it gets the scaling right (units with predicted IQ of 90 should average 90) as well as high accuracy (strong correlation between predictions and truth).
Predict into the remaining subnational units. Validate this by leaving out some countries in step (3) for cross-validation.
Using the imputed dataset, conduct a new global study of S and IQ.
To be clear, one can also impute IQs using S-data itself, but this risks biasing the results more and may be imprecise. See my results about imputing African IQs using national HDI/S factor data.
The idea generalizes yet further. It is not only intelligence that one can impute from survey data, but any other trait in general. I already showed that one can use psychopathology items from the MMPI scale to predict intelligence (r = 0.85!), but already in the 1954 Hans Eysenck summarized research showing that preferences for styles of paintings correlate well with political ideology. Noah Carl later replicated this for Brexit vote.
One idea is to construct a set of very varied questions concerning nothing in particular on the surface. What's your favorite color? How much do you like your paternal grandmother? Which of these pieces of art do you prefer? If you had to choose, would you give everybody in the room 100 dollars each, or give everybody else 200 and yourself 120? And so on. Given a dataset of 100 such questions, I bet must other psychological traits could be estimated with halfway decent accuracy. This would also work as a covert personality test for e.g. hiring purposes. Currently, many companies use their HR team to administer applicants personality tests, but it is very easy to cheat on these ("Are you a reliable person?" it's obvious you should pick "Strongly agree" if you want a job).
Thanks for the excellent article on intelligence and social status.
"There are two such studies, both of which found that intelligence is the key predictor, along with being poor to begin with (we might add, not having communism)."
Merit is essential in the level of social status one obtains, at least in a just society. And communism is anti-merit.
"One idea is to construct a set of very varied questions concerning nothing in particular on the surface."
This is intriguing.
At the moment, seems like intelligence research is just held back by data. More should be done to acquire testing scores from third world countries, if they exist.