American race relations 1964-2024
Who, whom?
The American National Election Studies (ANES) is a series of surveys that has been administered to broadly representative samples of Americans since 1948. They asked thousands of questions, though most of them not consistently across the years. Importantly for intelligence research, many years of data included the 10-item vocabulary test called Wordsum, which is a half-decent measure of intelligence (sadly, it was discontinued recently, probably a casualty of the great awokening). However, it also included the feeling thermometer questions for various social groups. It looks like this:
While many groups are asked about (e.g. Republicans, civil rights leaders, poor people), here we are concerned with race relations. Specifically, how each group on average rates their own and other races. A few years ago LJ Zigerell made this figure from the 2020 wave:
The figure shows that American Whites are the only group without an ethnocentric preference, that is, that don't rate their own ethnic group higher than others. This is typical of the race blind meritocracy seen advocated by many currently popular American conservatives as well as libertarians and some leftists. However, maybe 2020 is an outlier, so I decided to compute the results for all years:
[I computed some results with fancy survey weights like Zigerell did, but I found the results didn't change much, so for this plot I didn't bother. I excluded datapoints with less than 10 subjects (mainly Asians before 1990).]
Looking at the results, we see that generally each group has a long history of rating their co-ethnics higher than outsiders. And also we see that there is something wrong with the 2002 data, but I've left that artifact in here in case someone else wonders about why they get bizarre results for that year. Besides these limitations, we see that Whites and Blacks used to be more ethnocentric and that Blacks remain much more so than other groups. Whites have been declining in ethnocentrism since around 1995. During the great awokening years, 2012 to present, we see a sharp rise in Whites' ratings of non-Whites to the point of equality. Thus, it doesn't appear that the great awokening involved Whites getting more self-hating, at least insofar as the overall averages are concerned. To see ethnocentrism better, we can also compute that directly as: mean(rating of own race) - mean(rating of other races):
At the start of the data in 1964, the size of the ethnocentric effect was about the same for Whites and Blacks, and both declined until around 1998. Blacks then rebounded while Whites remained on par with the other races. After 2012, Whites declined further to reach 0 in year 2020, and rebounced very slightly afterwards. 2020 was thus an outlier historically, but not much different from 2024.
The above hides some complexity related to ideology. Since Whites are of the main interest here and have the largest sample sizes, let's look at their feelings towards races by ideology. This is based on the 1-7 self-placement from far left/extreme liberal to far right/extreme conservative. First, the 3-way split:
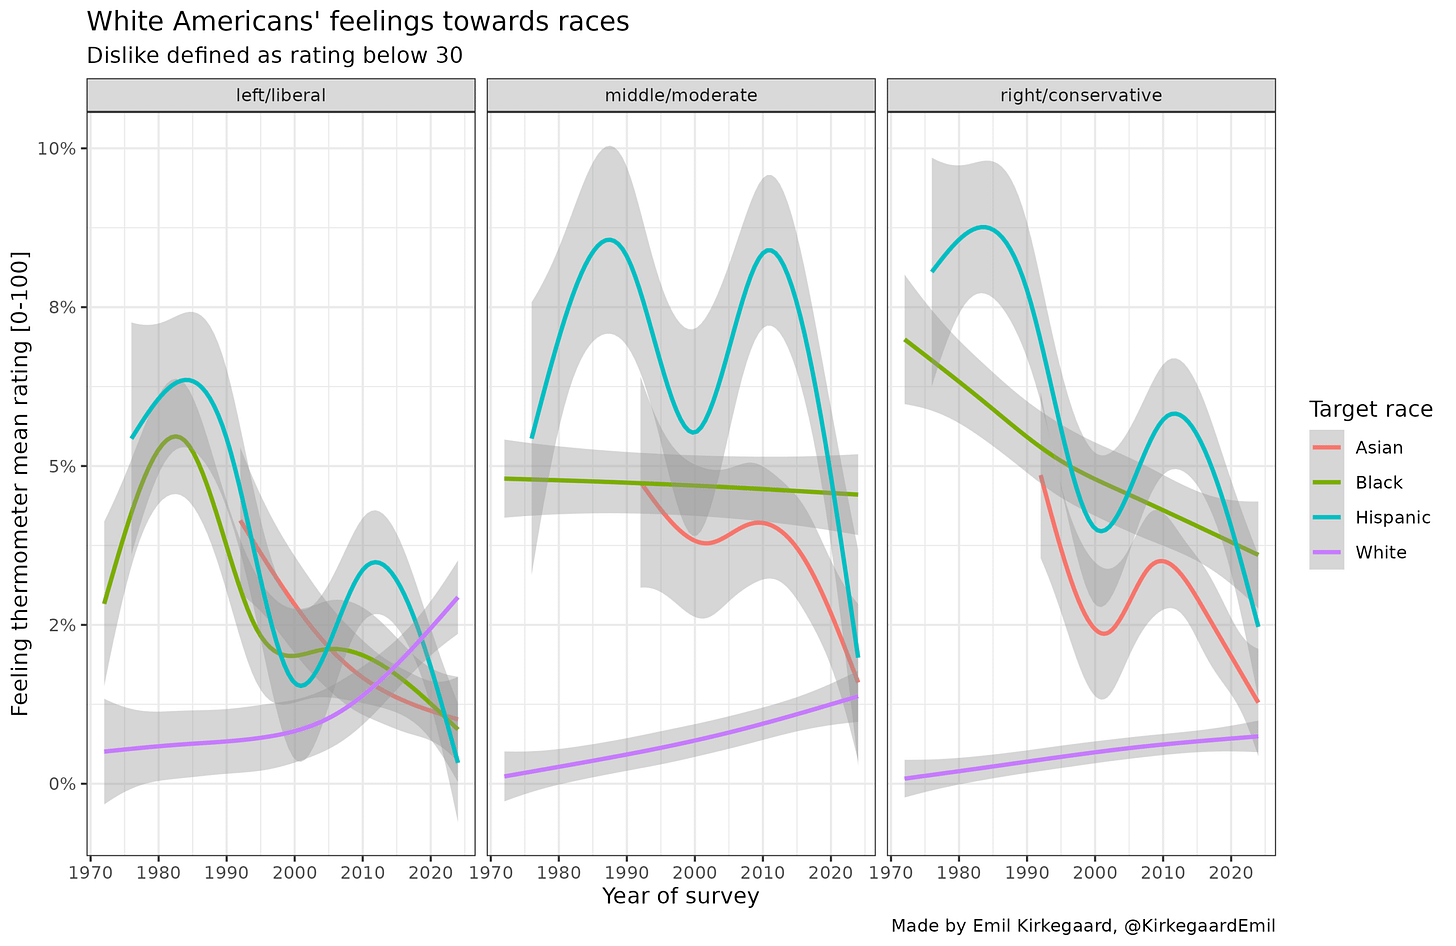
We see now that there are major splits by ideology among Whites. Already in 1995, the White left in USA started rating Blacks nearly the same as themselves, but not Hispanics or Asians. Around 2014, the races reached approximate parity, and since then the White left has rated their own group lower than the other races. The story for moderates is that of an initial decline of feelings towards fellow Whites from 1964 to 1990, and then no change. However, with the great awokening, moderates started rating the non-Whites higher until they nearly reach parity in 2024. The right saw a rebounce of feelings towards fellow Whites in early 2000s, though they still retain some ethnocentrism and the trend is for them to soon rate non-Whites the same. It turns out that averaging these three groups yields approximately 0 ethnocentrism for Whites which is what the plot above for 2020 showed. If we split the data further into 7 political divisions:
Not surprisingly, we see that the White anti-ethnocentric effect is concentrated in the far left. Roughly, then, one could that American political ideology among Whites mirrors the opinion towards Whites.
It should be noted that though the White left shows an anti-ethnocentric pattern, their ratings for Whites are still above 50, so this doesn't mean the average feeling is that of dislike or outright hatred. To look at that, we have to pick some threshold we consider low enough to be that of actively disliking people. Let's say 30, which is quite low on a scale where most people pick values around 60-80:
In general, White Americans just aren't very racist. In no year of data did the % of people disliking any race go above 10%. But we do see that the White left has a growing active dislike for their own group, not merely moderate feelings. It's not (yet) very extensive, though. Looking at the 7-way split:
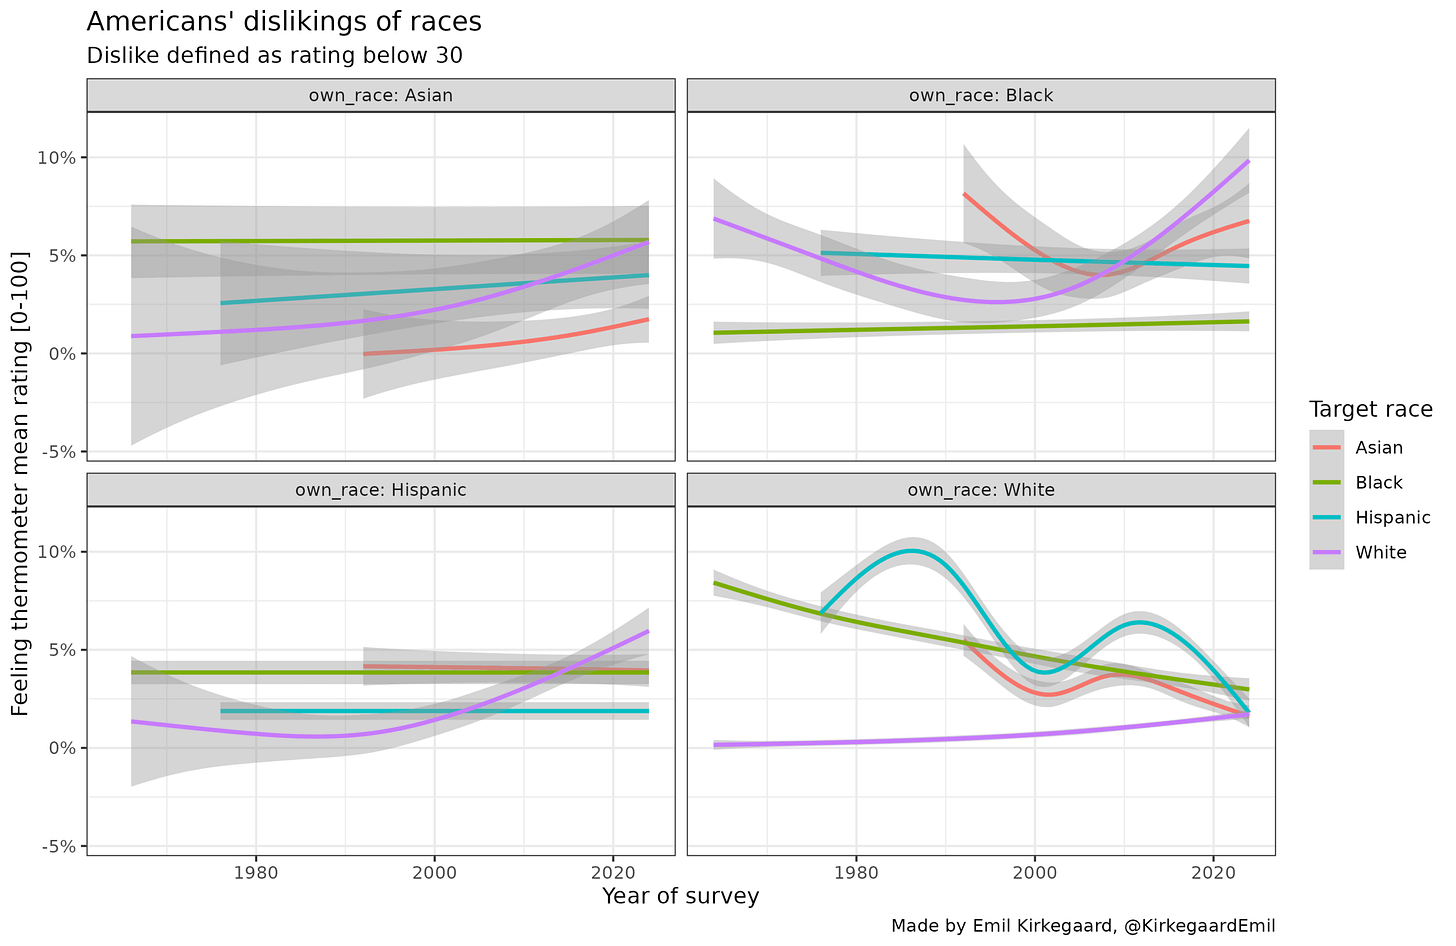
Among the far left Whites in 2024, the dislike % reaches 10% with a growing trend. For good measure, here are the overall results for disliking across races and years, ignoring politics:
In general, Americans just aren't very, well, racist. The most racist group are Blacks, but even they cannot muster 10% of people who hate an outgroup, at least according to anonymous surveys (one could look at the phone vs. internet results to see if there's an effect of medium, probably is).
And just for good measure, here's feelings towards the Jews by ideology:
There is a typical horseshoe effect, but not the way you might expect. Rather, according to the feeling thermometers, liking the Jews is a sign of political extremism. Looks like we need to talk more about the anti-Semitism of the moderates.
R notebook and code. Data you can download on ANES website.


I do wish the implicit bias association test actually worked, because it would be great to have data on what these respondents ACTUALLY believe vs. what they know the "correct" answer is.
There is no way, especially on the Asian and Hispanic respondents, that they have warmer feelings towards blacks vs. whites. No way.
Bizarre horseshoe plot