
Do gun ownership predict homicides taking race into account?
A county-level analysis

You may have seen a plot like this one:
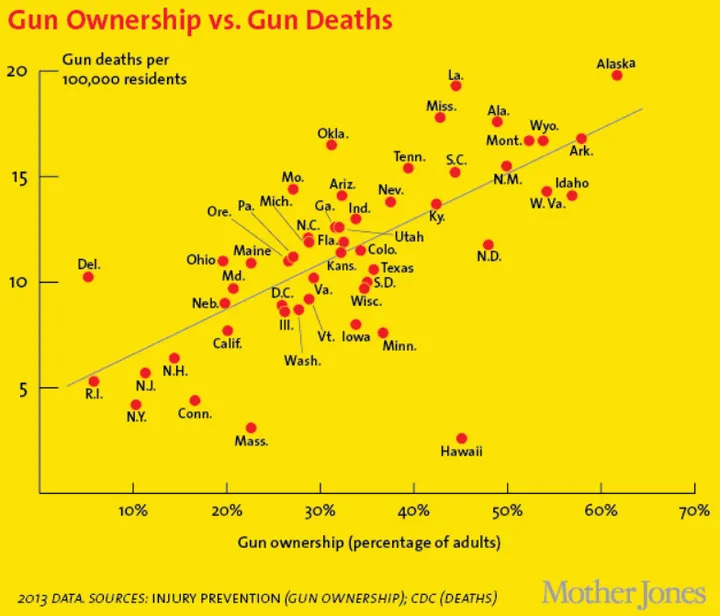
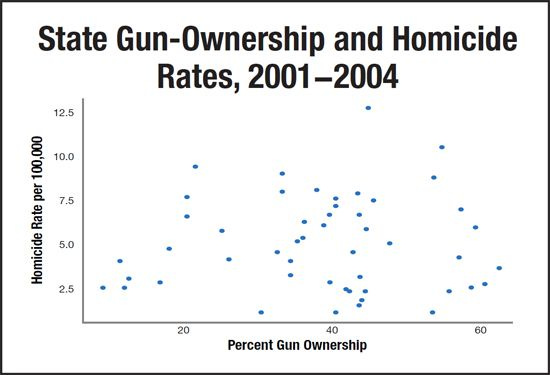
The reader is left to interpret that guns cause homicides. It’s correct if we include suicides but it’s not true for homicides as a whole:
But then again, we know that homicide rate is mostly related to which % of the state is Black. The leftists are trapped. To show that gun ownership causes homicides -- how could they not? it’s an effective and easy to use method -- they need to control for the confounders. But that would mean doing regressions and seeing that Black% is the main variable, a big no-no. So I don’t know what they do, I guess just nothing except to post gun ownership vs. gun deaths. Anyway, we can still examine this question. We can do the analysis at the state level, but with n = 50/51, this isn’t statistically great. We want the county-level data for more precision and to avoid whatever aggregation biases exist for state-level analysis. The problem is that there are no reliable data of gun ownership % by US counties. There is no national registry of guns so there is no government data to rely on. There are some very large surveys from 20 years ago that asked people about gun ownership in the home (BRFSS), but then they stopped including that question in the survey for ? reasons. So researchers found a clever proxy to use: firearm suicide % of all suicides. The idea being that the more firearms are around, the more people will kill themselves with them as opposed to some other method. It makes sense, even if the scaling may be nonlinear. Still, even the large surveys are not sufficiently large to have enough people from all 3100+ US counties. One can accept this and use data from the largest counties, or one could impute the missing data using data we can precisely measure even in small counties. Such data are things like % of people below 18, median age, White%, Asian%, % with bachelor’s or more degree, and Republican vote %. If we train a model on the counties where we have enough data (city areas merged from multiple counties), and validate this model, then we can impute the values for the counties where we don’t have enough survey data. And we can also validate this against the firearms suicide method as an independent validation.
The task is extra difficult here because we must predict potentially out of range from the training data. The training data does not have any data for rural counties with small populations and high gun ownership rates, but we must somehow predict these correctly. We don’t care about model interpretability here, just predictive validity, so we can use fancy machine learning algorithms that can capture nonlinear and interaction effects. I tried a few different models from the simplest (ridge regression) to the more flexible (xgboost, SVMs). Still, we have to recall that we only have 118 large counties to train on (MMSAs), so we have to be rigorous about overfitting issues.
First, though, let’s look at the state-level regressions for predicting homicide rates:
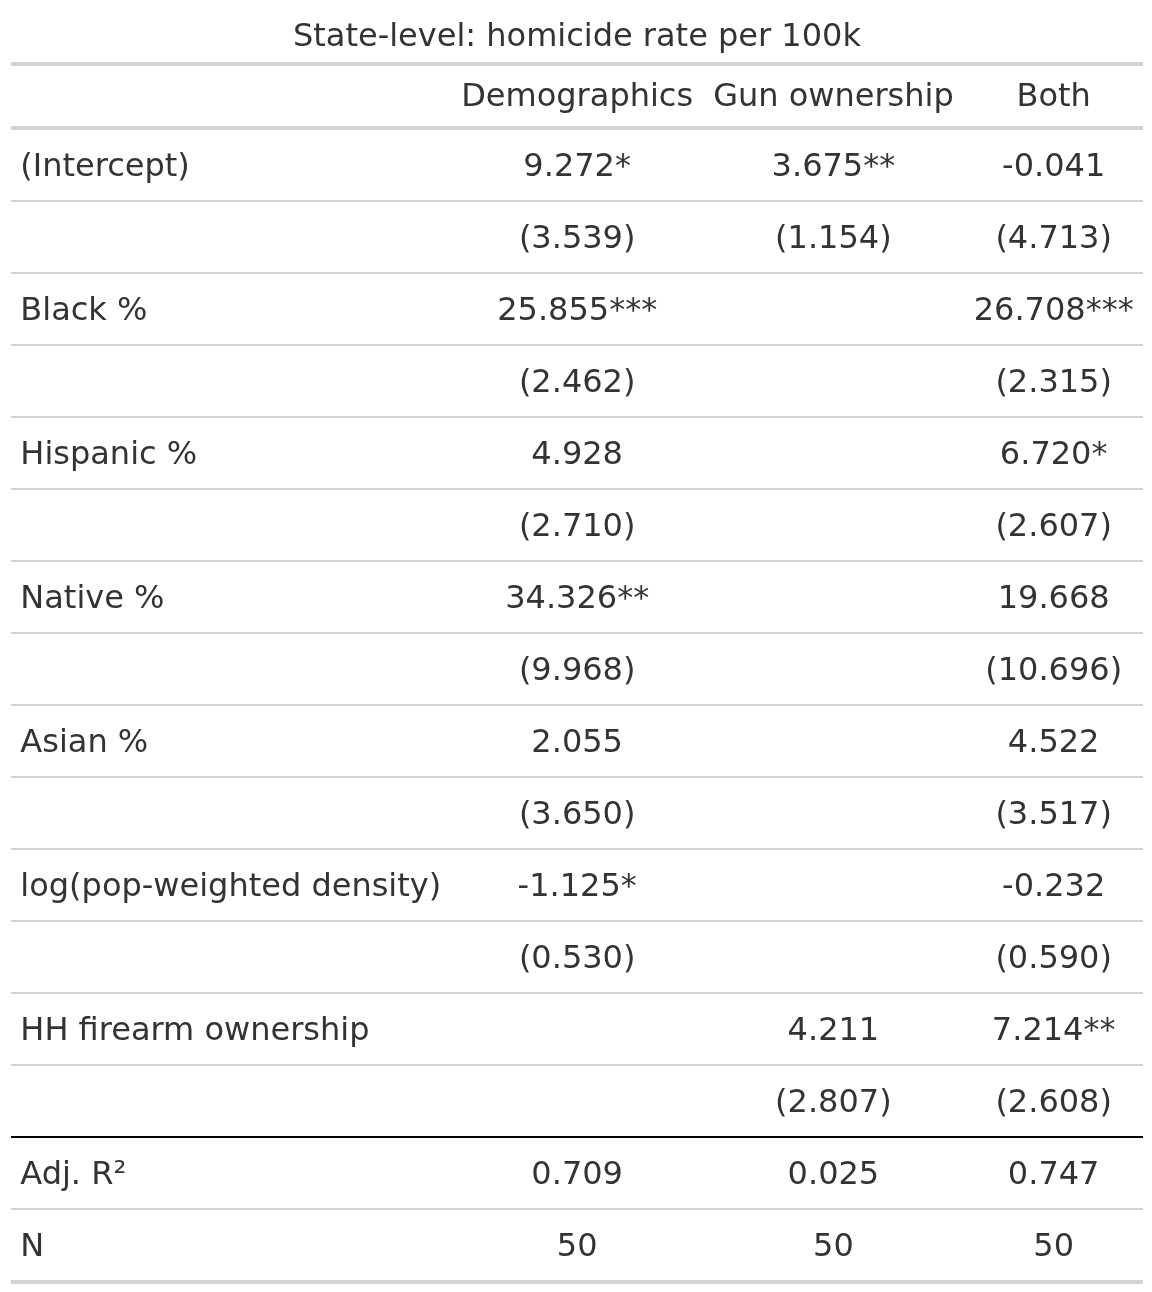
We see that in model 2, firearm ownership does not predict beyond chance alone, but when combined with demographics, it does predict positively as expected. Leftists and hereditarians are both correct: Black% explains most homicide rate variation, and gun ownership explains some net of this. It’s coefficient is p < 1%, and not that small. Going from 0% to 100% gun ownership predicts 7.2/100k homicides more, which is a lot because the US average is 5.3, so more than a doubling. In reality, the states range from 9% (Hawaii) to 64% (Wyoming), which suggests that in Wyoming the homicide rate is 7.2*0.59=4.2 higher than it would otherwise be. We can see that the model is not well-behaved because the actual rate in Wyoming is 3.4, and it can’t become -1.2.
We repeat for the large counties with large enough samples in BRFSS survey:
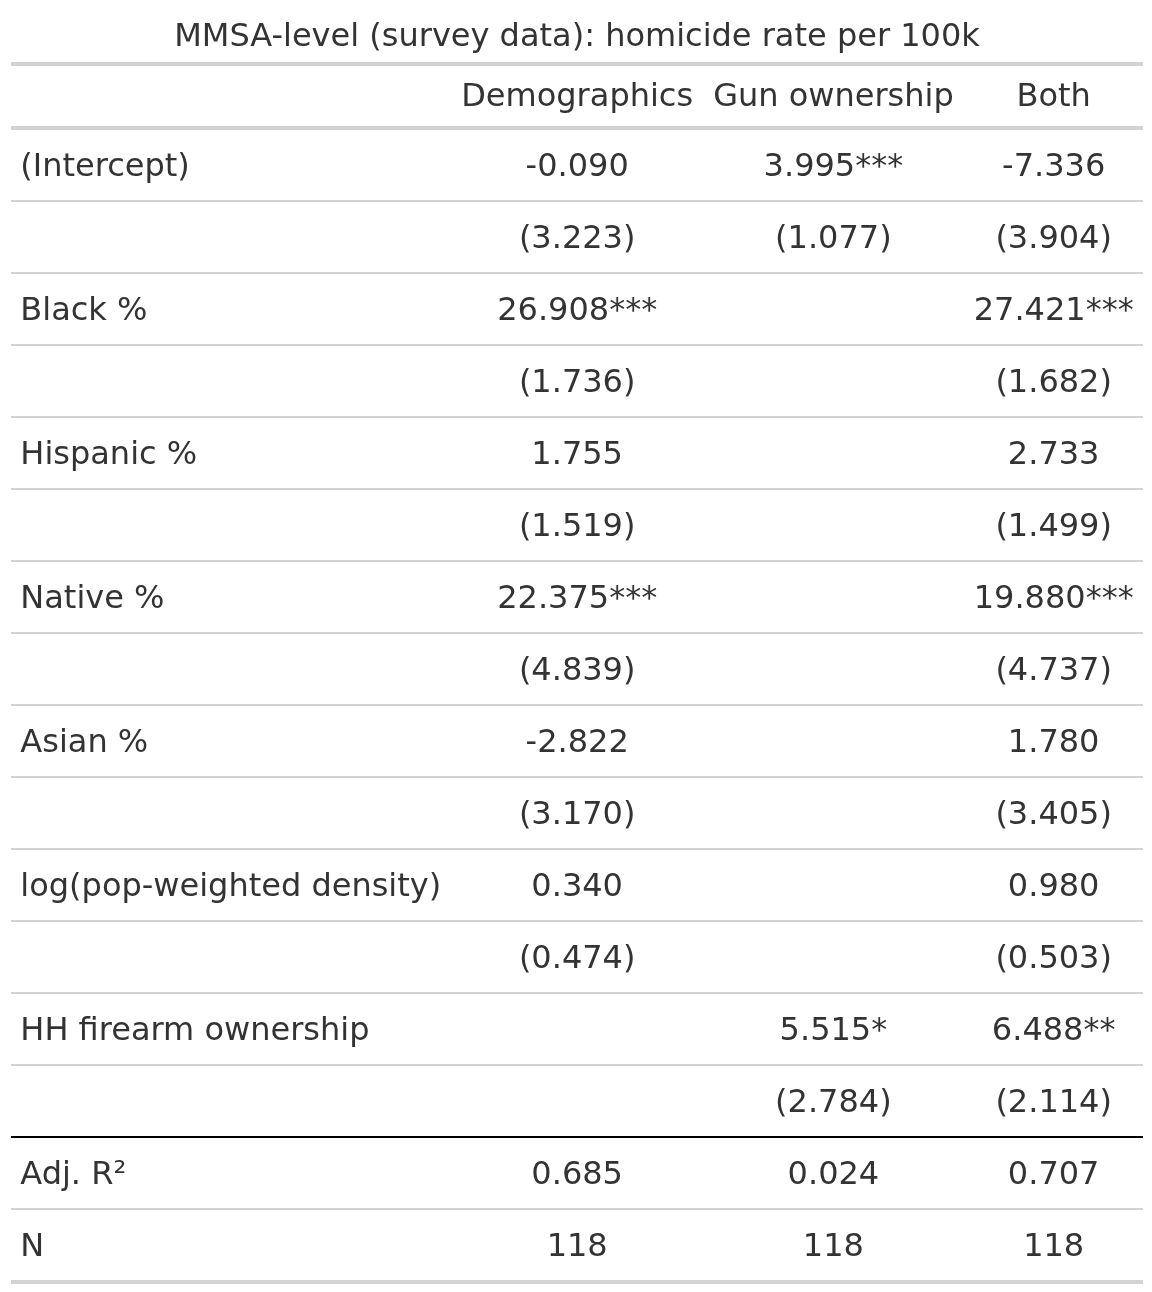
Here gun ownership predicts in both models, but it’s a poor predictor (about 2% variance), and yet it retain p < 1% with the demographic controls. And finally for all the counties including the imputed ones:
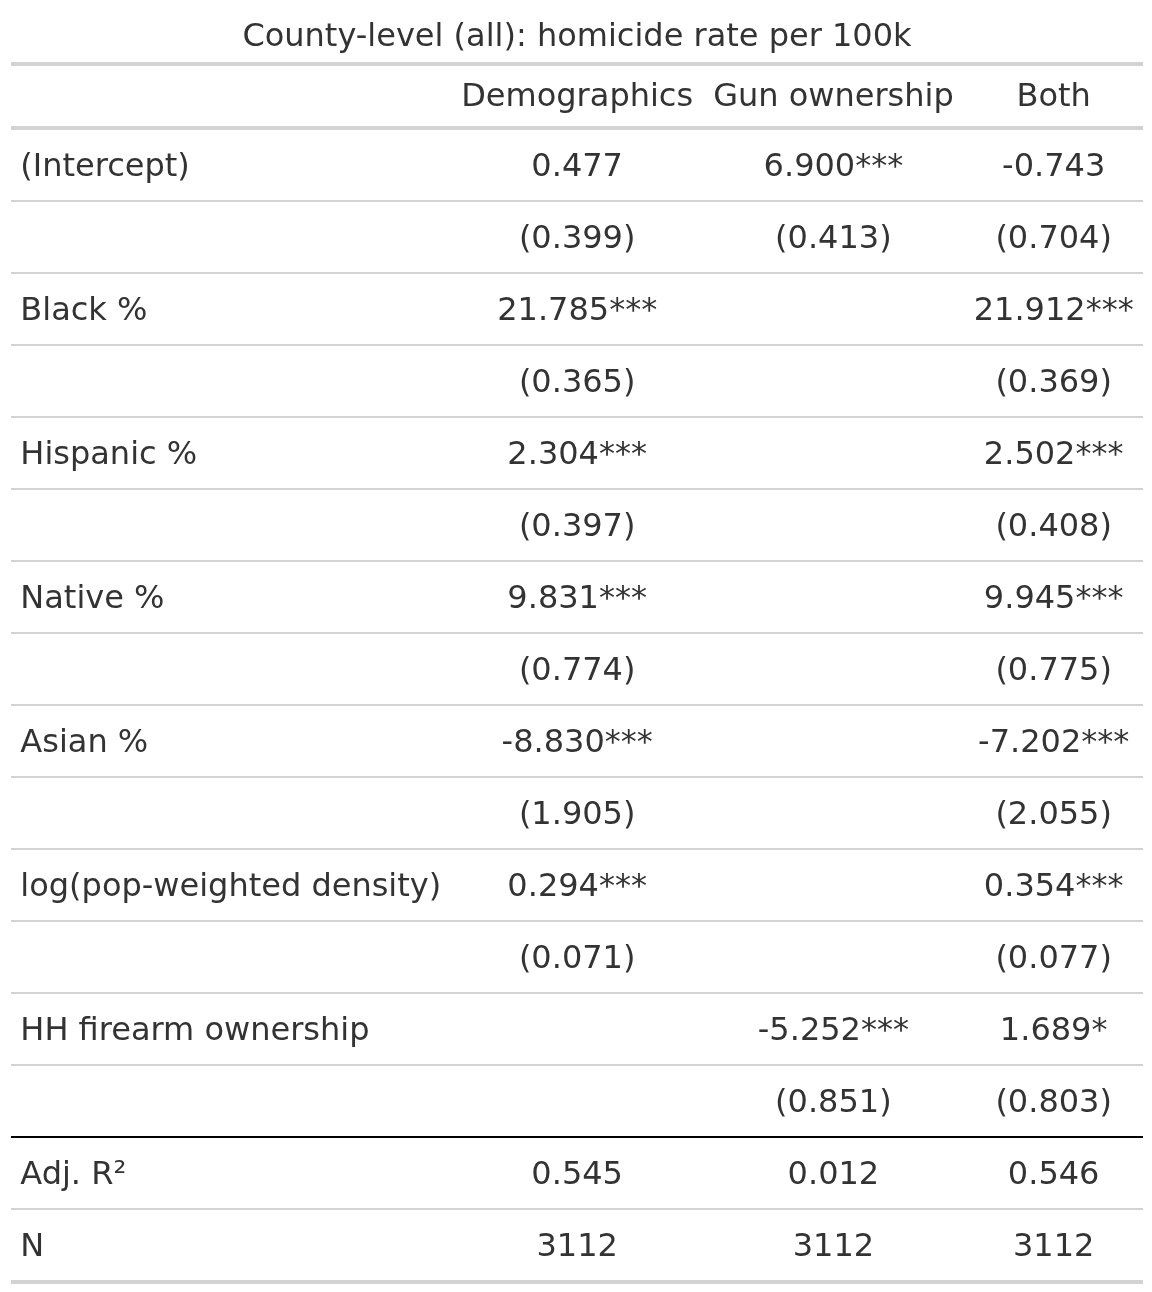
Now it predicts... negatively alone, presumably because of high estimated ownership% in White rural countries with low homicide rates, and it predicts slightly positively net of demographics (p < 5%). This decline in slope is possibly related to our imputations being dodgy for these units, but note that Black% is also smaller. This relates to sampling errors in the outcome variable as well I think, which can also be seen in the R2 being lower.
The reason for writing this post was that someone asked me about a potential Black% * firearms interaction:
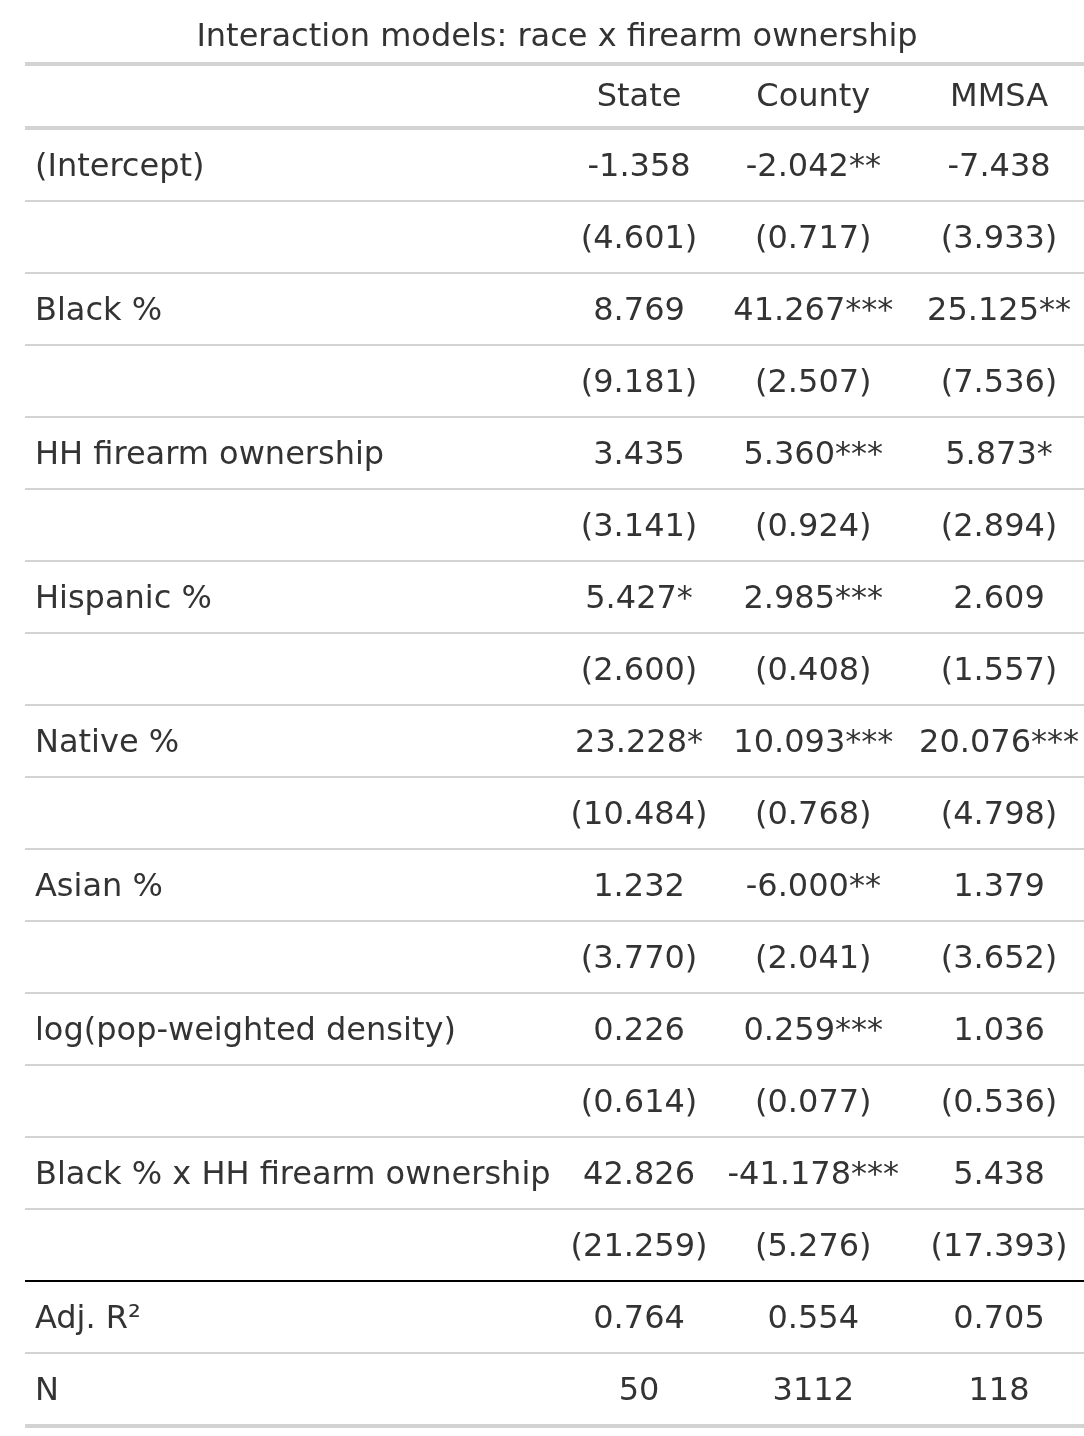
There’s nothing for the datasets where we have high quality estimates, but there’s a strong negative interaction for the imputed data. I am not sure what to make of this. Gun ownership protects against Black homicides? Dubious. The issue is that the small-n models cannot estimate these values precisely (SEs about 20), which is also why Black% is unstable (non-sig for states). We didn’t get much more wise with this interaction test analysis since the 2 datasets with reliable data are underpowered, and the one with sufficient power relies on questionable imputations.
So, how confident are we in these imputations? Here’s the model accuracies and calibrations:
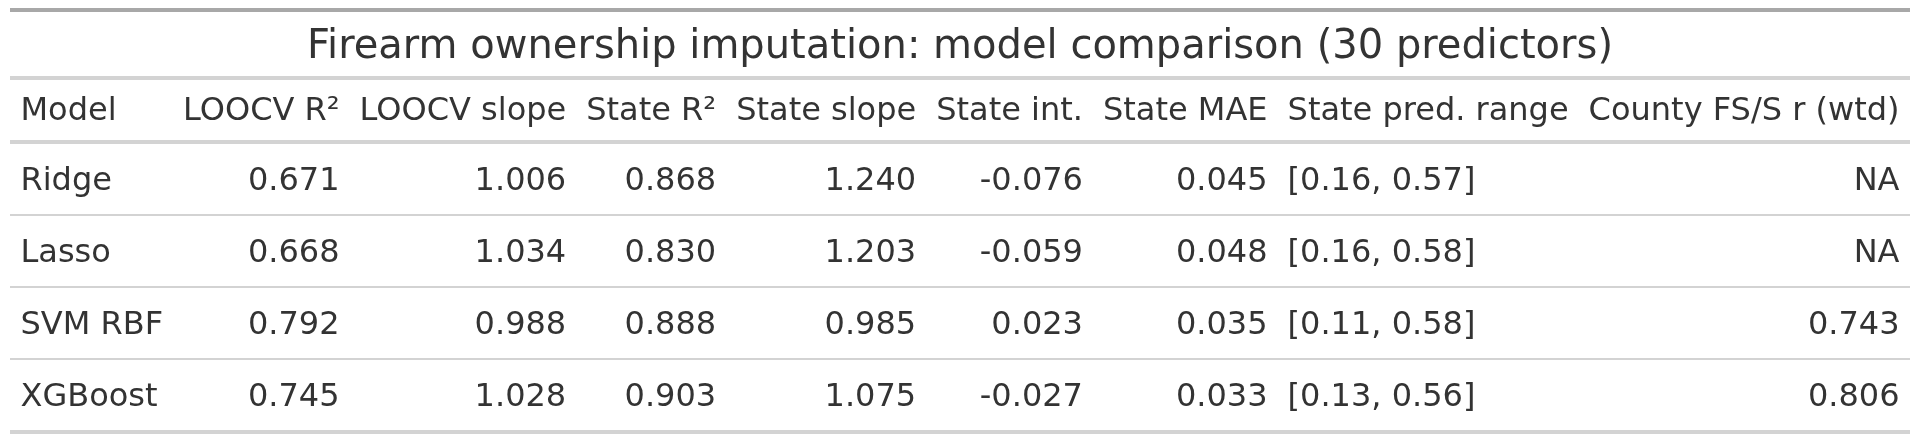
There’s a few different metrics to be concerned with. LOOCV (leave one out cross validation) is out of sample R2 in the training sample, more is better. The state values are for the quasi out of sample test using the aggregate state data. Here it is important to have both high R2 and slope=1 and intercept=0. The SVM does best, but XGboost is about the same. The issue with XGboost is that it cannot predict values not seen in the training data (because it is a decision tree model). Thus, it cannot predict very high ownership % for rural counties because these aren’t in the training data to begin with. For this reason I went with the SVM, which can extrapolate beyond the observed range. The advantage of the SVM and XGboost is that they can capture nonlinear effects and interaction effects, which lasso/ridge don’t by default because they are just OLS models with penalization (one can manually specify interactions and splines, but then one has to do a lot of testing to find them). State level correlation matrix:
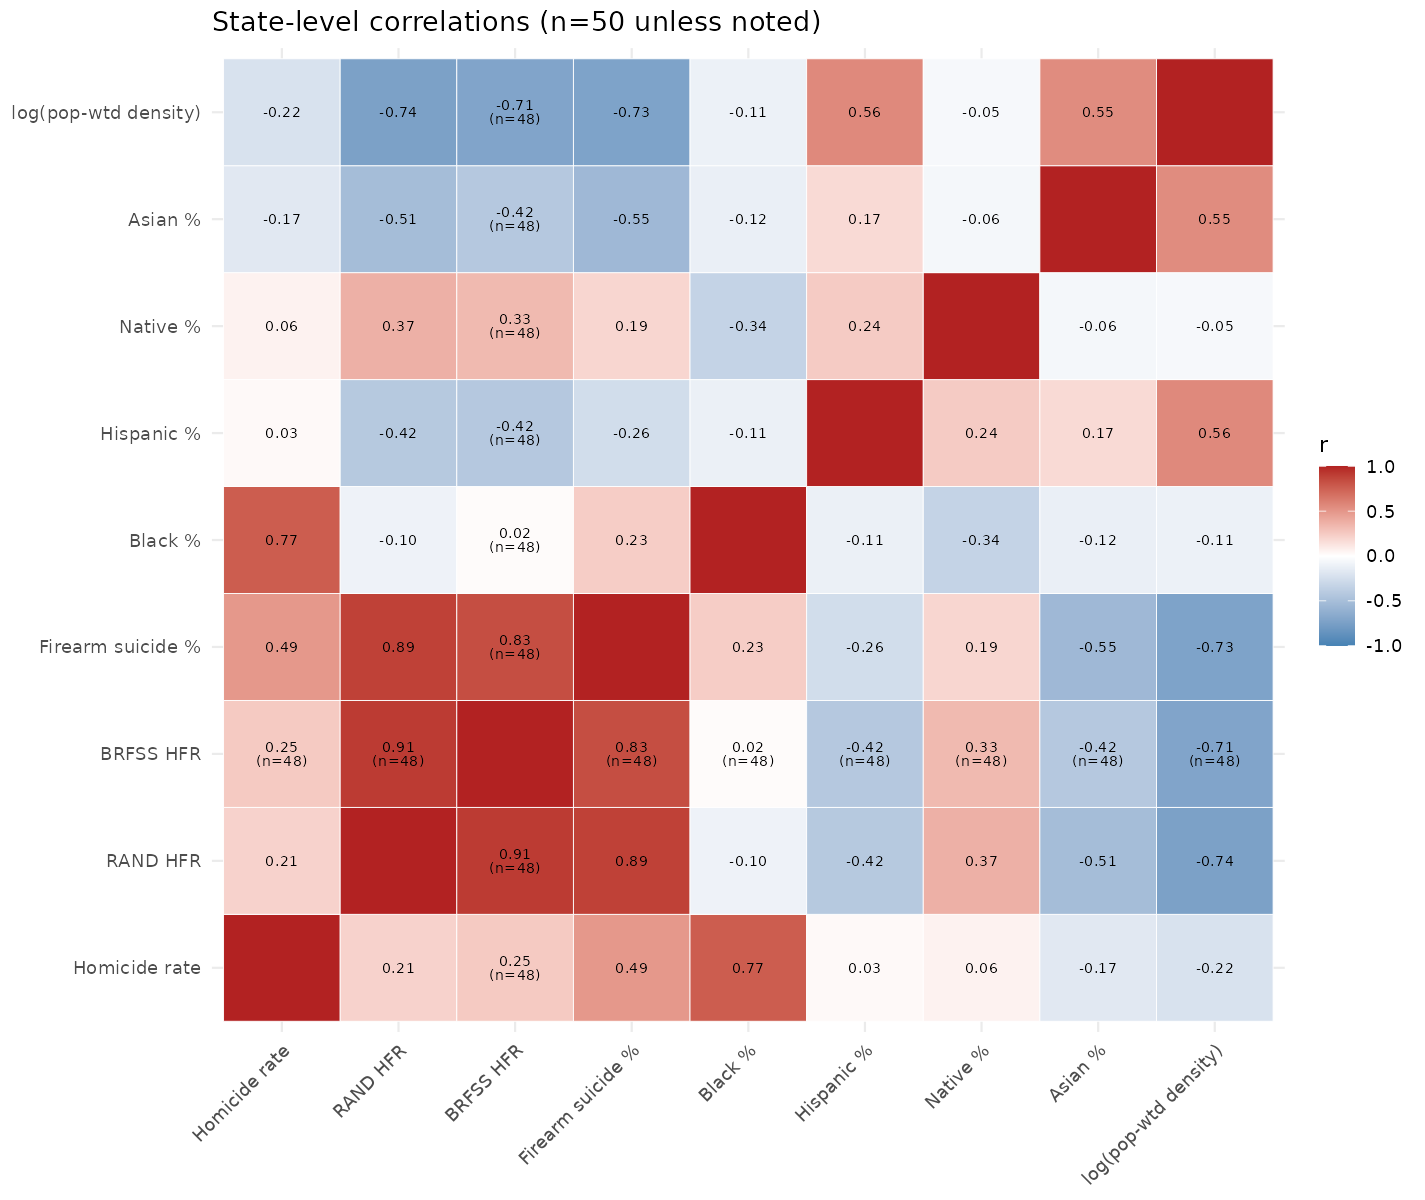
RAND is the RAND institution’s estimates of % of households with firearms, BRFSS is the one based on the large surveys. They correlate at 0.91. Firearms suicide % is the other method, which correlates at about 0.85 with the others. Pretty good.
Here’s the correlations at county level, split by large and all:
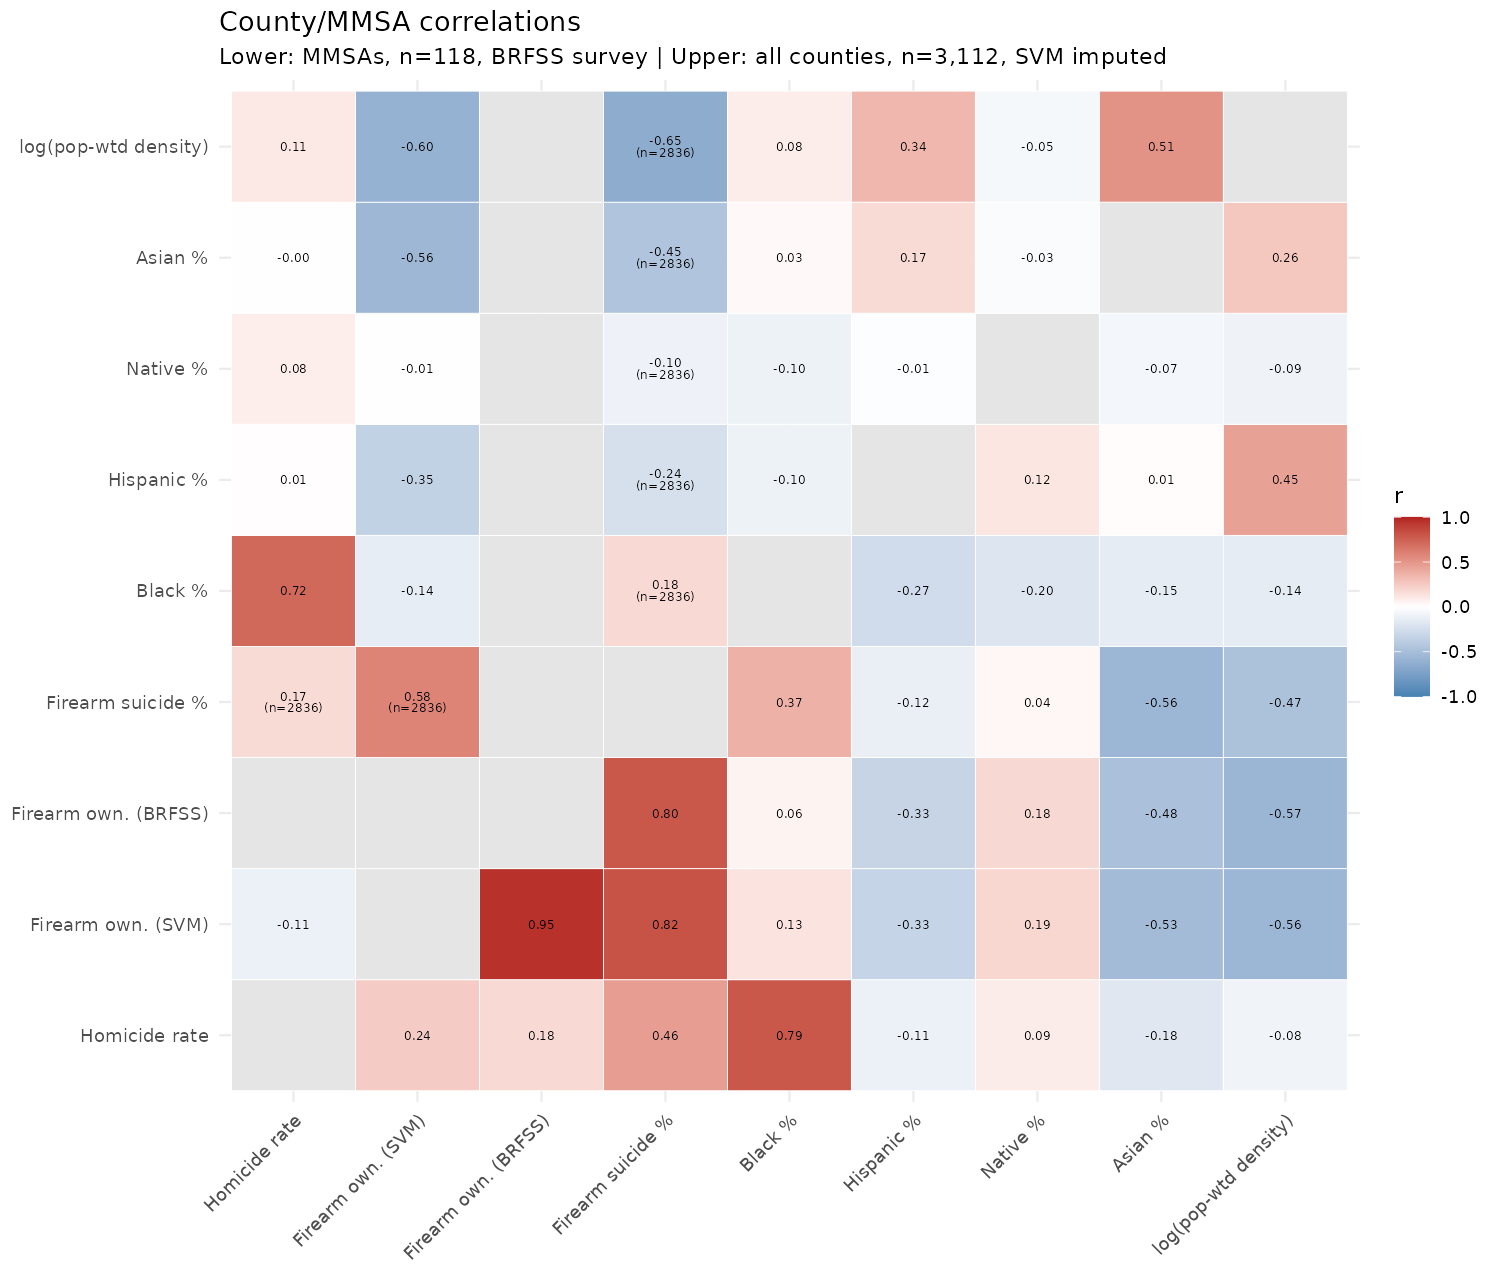
Bottom half has the full dataset, upper only the large counties used for training. There’s no BRFSS data for counties, only the aggregated city data, so those cells are empty. In the all data part, we see that the correlations for imputed values and the firearm suicide % are similar, except for the correlation with Black% which changes sign. May be a problem. We don’t have any ground truth for the counties, so we just kinda have to have faith that the imputations generalize to the small-n counties based on the city data. We know they generalize to the states, even the ones that weren’t used for training. Overall, though, it does seem like more guns means more homicides in general, net of demographics and our county-level analyses back this up, just not entirely convincingly so.
Perhaps I overlooked it…but are we referring to legal gun ‘ownership’? It may or may not be relevant
Is there any data on number of long guns vs. hand guns in a locality?
Long guns are pretty useless for planning to commit any crimes you are hoping to get away with (e.g., other than school shootings and murder-suicides) because they attract witness attention.