
Do you like dogs, cats, both, or neither?
I had a look in the trusty OKCupid dataset

Back in March I published this study of pet preferences and human psychology:
Kirkegaard, E. O. (2025). Do You Like Dogs, Cats, Both, or Neither? An Examination of Western Dating Site Users. Mankind Quarterly, 65(3).
Prior research found that pet preferences and ownership relates to owners’ characteristics, including psychological variation. We aimed to expand this literature. Subjects were OKCupid dating site users who had answered questions for the purpose of improving their matches on the site. We examined the relationship between dog and cat preferences and a broad selection of psychological traits scored using ad hoc scales of questions found in the dataset. Results were in line with prior research. People who prefer dogs were higher in extraversion, conservatism, desired and actual number of children, and mental health, while those preferring cats were higher in intelligence, enjoyed discussions more, and read more books. These associations were robust to controls for age, sex, and location.
Again, using the trusty OKCupid dating site dataset that I have used extensively for prior research. Despite the odd nature of the dataset, it has shown again and again to replicate known relationships, and thus should also be able to tell us about new findings. The reason why such an unrepresentative dataset can work is that human psychological relationships don't in general depend much on context. This is another way of saying that statistical interactions are mostly not present and when they are, they are quite small (this is also why Aella's online surveys usually work fine). Of course, one should not use such datasets to compute simple means and consider these representative, but higher-order statistical results are relatively robust to sampling bias, whereas first-order results are not (means/proportions).
With that out of the way, let's look at the results. One of the mandatory questions of the old OKCupid when creating a profile was the following:
“Are you a cat person or a dog person?” with options: dogs, cats, both, neither (q997). 54,746 subjects answered this question.
If you know a lot of people, you probably realize that there are differences between dog and cat people. It is not due to coincidence who likes dogs or cats, and those who don't like these two most common pets at all. To explore this, I constructed measurements of other popular and perhaps relevant constructs:
Conservatism: 15 items. Example: “Is a welfare system a good idea? Or does taxing for it just take
money away from hard-working people who earned it?” from “Welfare is mostly good” to “Welfare is
mostly bad”. Reliability = .76.Drug use: 7 items. Example: “What’s your deal with harder drugs (stuff beyond pot)?” from “I do
drugs regularly.” to “I never do drugs”. Reliability = .82.Enjoys discussion: 4 items. Example: “Do you enjoy intense intellectual conversations? yes/no”.
Reliability = .65.Extroversion: 11 items. Example: “Do you like wild parties?” yes/no. Reliability = .76.
Intelligence: 14 items. Example: “Etymology is...” with 4 options. Reliability = .61.
Sex/kink interest: 14 items. Example: “How open are you to trying new things in bed?” from “Very
Open” to “Not at all”. Reliability = .78.Mental health: 5 items. Example: “Do you get depressed much?” from “Almost never” to “Despair
is my life”. Reliability = .43.Antisocial behavior: 16 items. Example: “People who throw cigarette butts out of their car
window...”, “Are not doing any real harm” or “Are being insensitive and/or rude” (reverse scored).
Reliability = .50.Prudence: 8 items. Example: “Are you careful with your money?” yes/no. Reliability = .49.
Likes reading: 4 items. Example: “Roughly how many books have you read in the past year?” from
“Less than five” to “Fifty or more”. Reliability = .67.Religiousness: 10 items. Example: “Do you believe in God?” yes/no. Reliability = .79
Has children: 1 item. Yes/no.
Ideal number of children: 1 item, Options: 0, 1-2, 3-4, 5+.
The reliability is relatively poor for many of these scales because the site was obviously not constructed in a way to measure constructs that academics care about. Rather, most questions were user-generated and so covered whatever it was dating site users wanted to ask about in 2010-2015. Still, from such imperfect measures, we can figure out the directions of association and if we wanted to, we could correct for reliability to the purpose of a meta-analysis. Remember here, that the less reliable the measures are, the more difficult it is to find robust results. The fact that plenty of such are found suggests either the reliability is not uselessly low, or that we don't need so much reliability to see general patterns.
The simple results look like this:
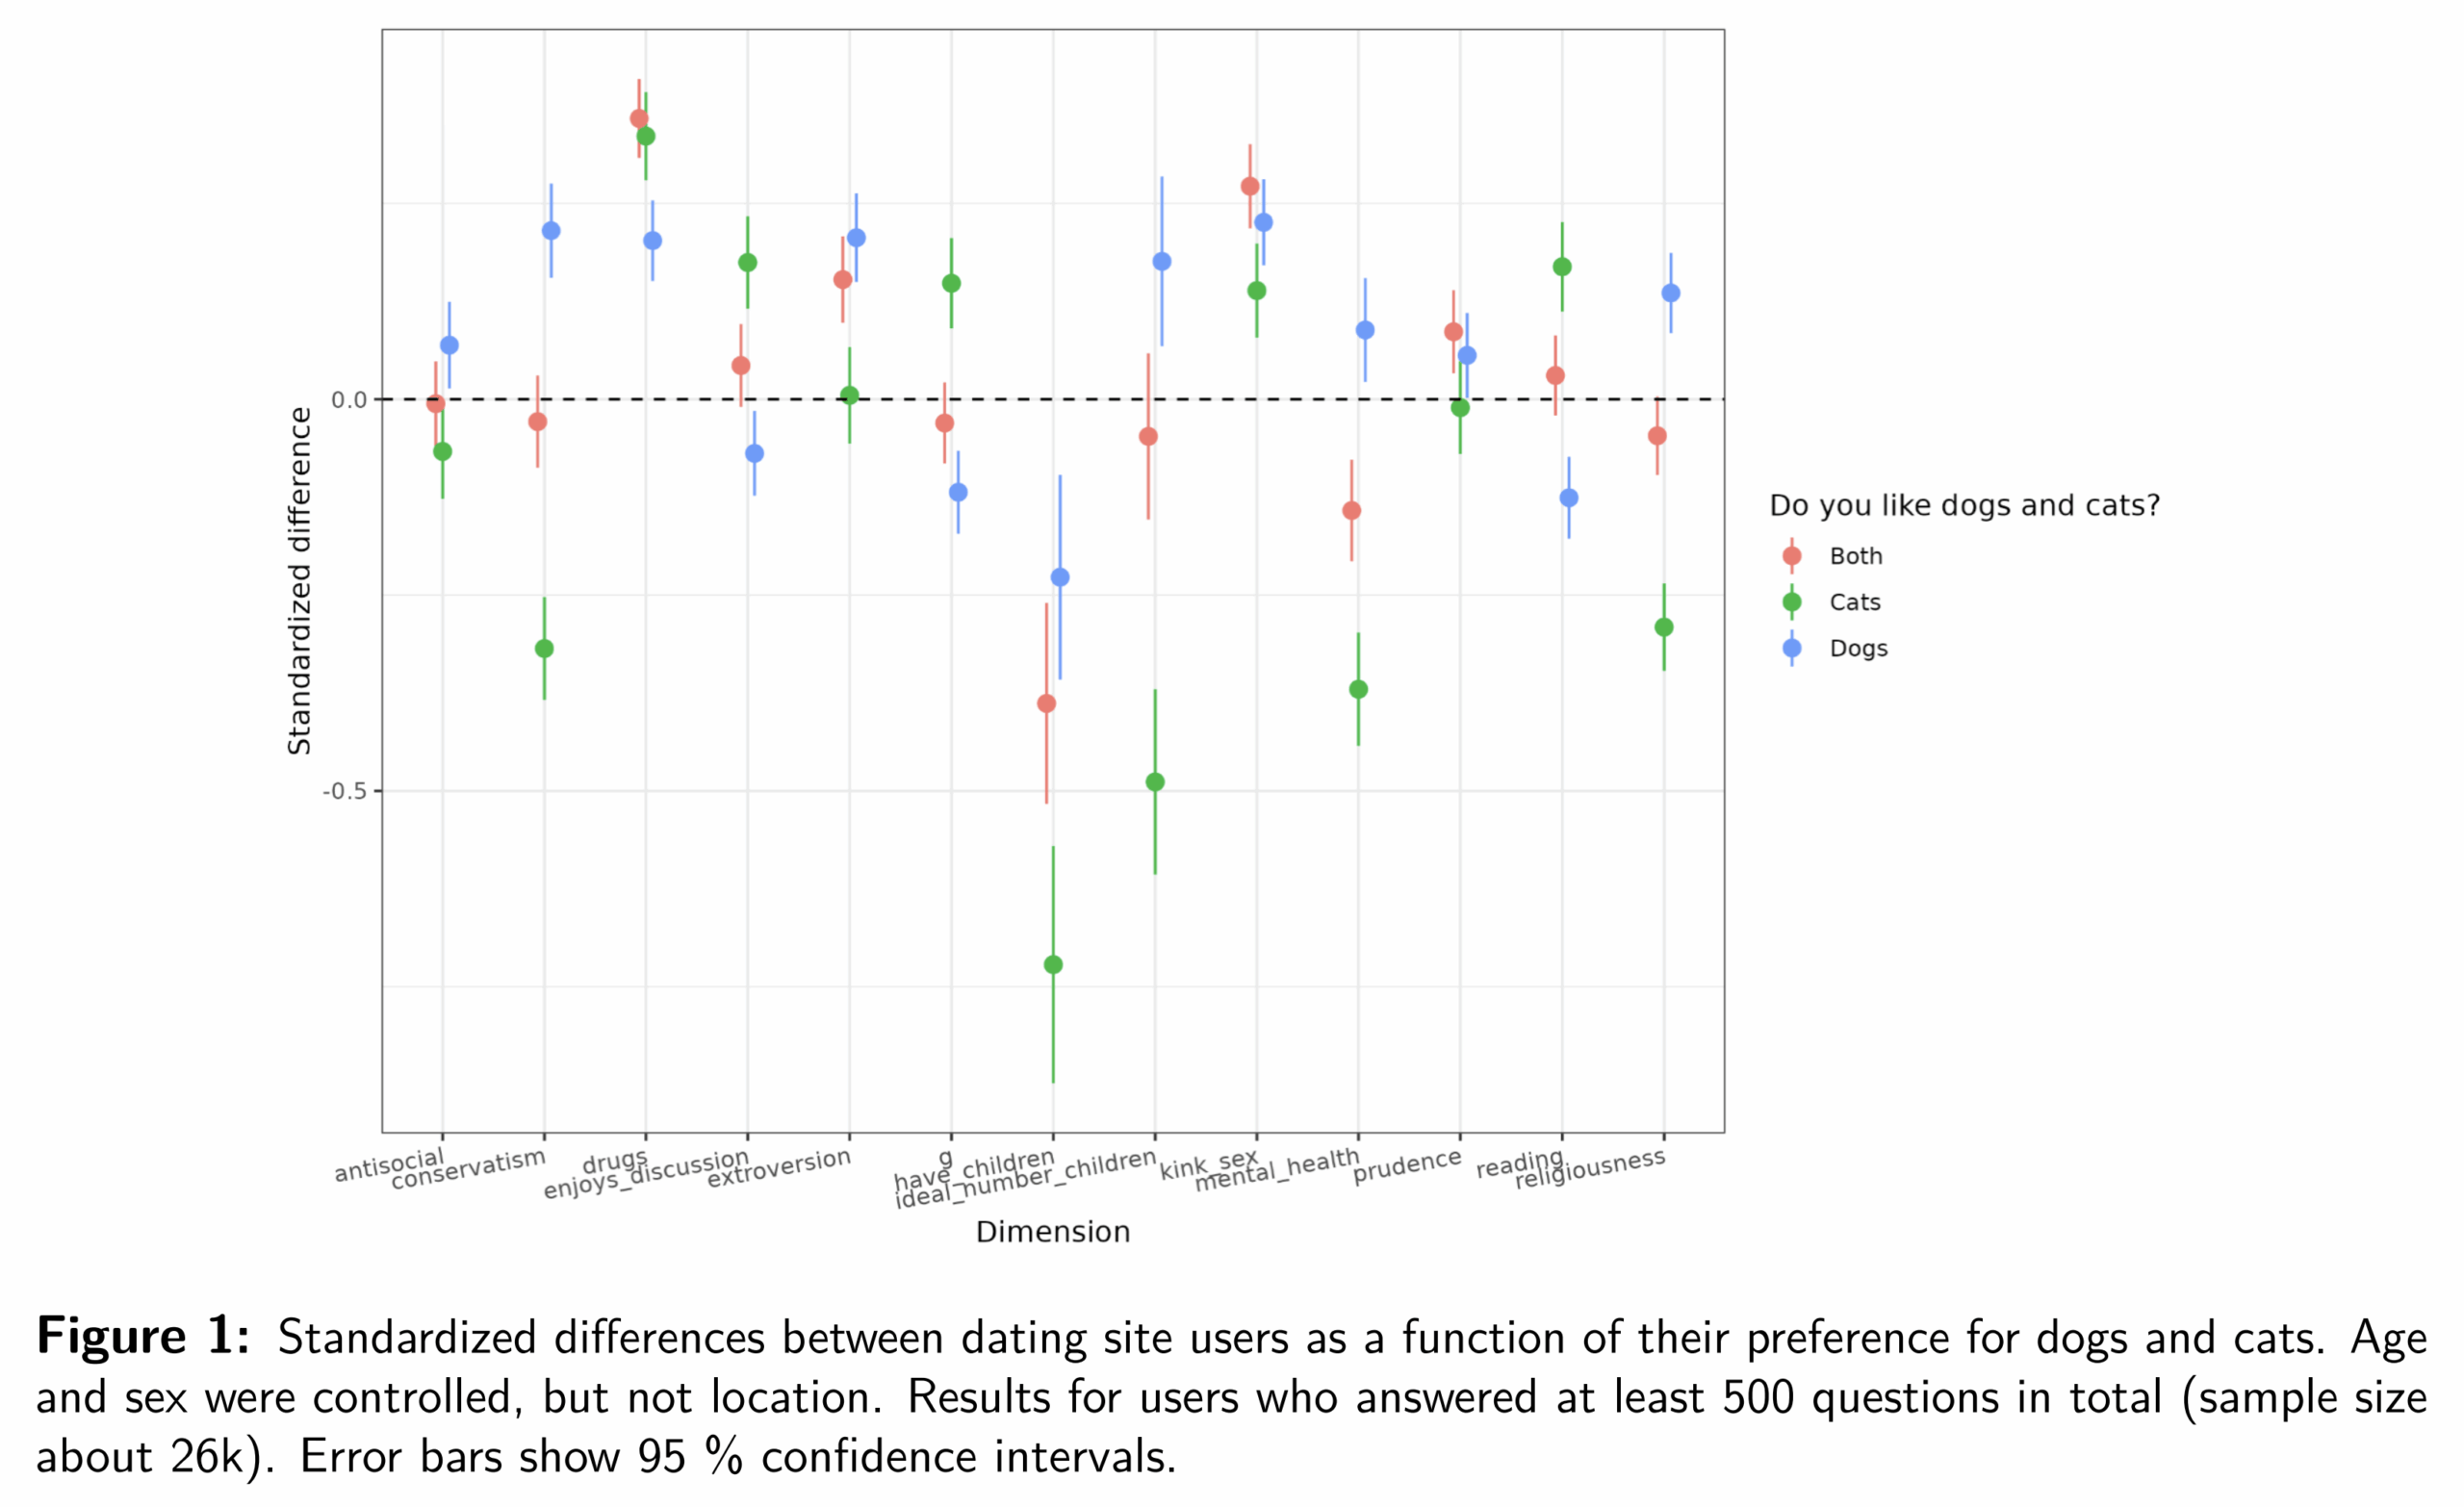
The comparison group is people who don't like either dogs or cats (which is the 0 line). This choice is arbitrary (probably grand mean coding could make a more intuitive plot). In any case, these results are controlled for age and sex, but nothing else, including not for where people live. Of the larger differences, we see familiar (get it?) patterns:
Dogs people: +conservatism, -intellectualism, +extroversion, -intelligence, +fertility and intentions, +mental health, -reading, +religiousness
Cat people: -conservatism, +drugs, +intellectualism, -extroversion, +intelligence, -fertility and intentions, -mental health, +reading, -religiousness
In most cases, the both-pets group is in between, but not always.
The most obvious problem with these findings is that it is harder to have large pets like dogs in cities, and so maybe we are implicitly merely looking at city vs. rural people here. We can control for location, which in OKCupid data means controlled for US and Canadian states/provinces, and countries (not all users were North Americans). The results don't change much however:
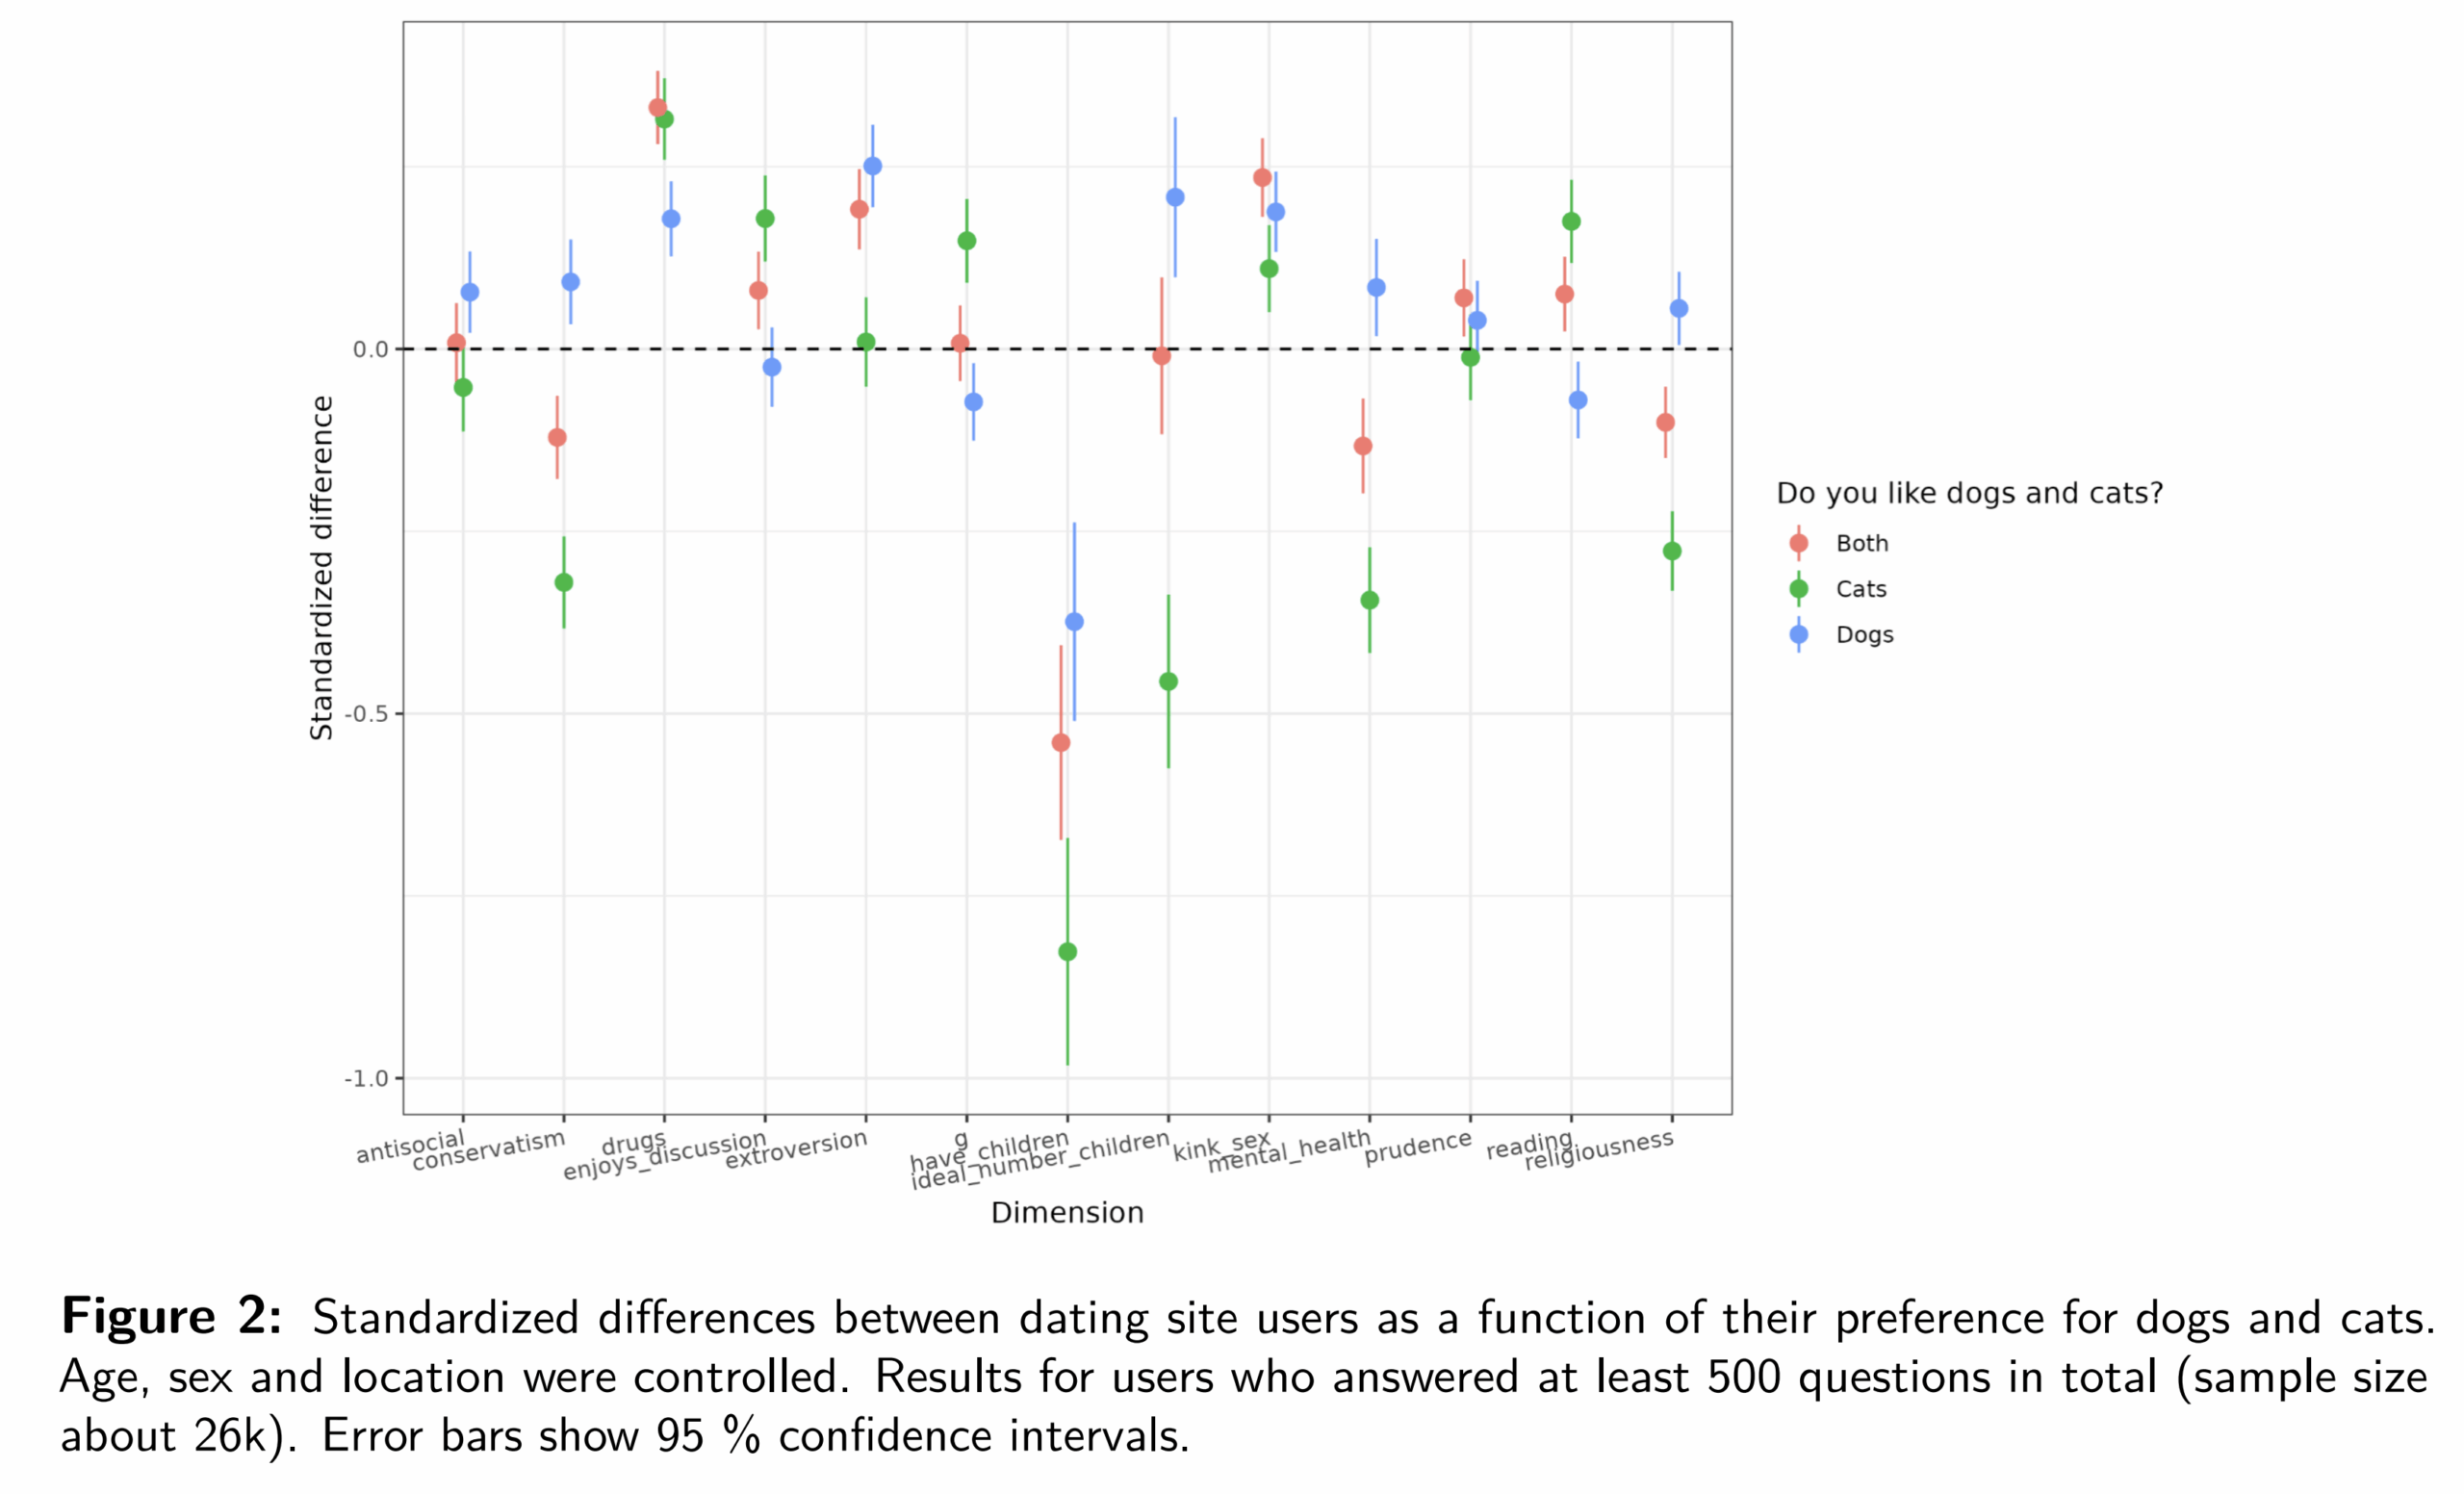
At first, they may appear to be the same results, but if you look closely, you can find a few minor differences. Note that the question is not about who has a certain pet, but only whether they like them. Thus, presumably, some people who like dogs still live in cities and don't have them currently, but we are more interested in people's preferences rather than their current pet ownership. As I recall, prior research has also found that people's preferences are more indicative of personality than actual ownership patterns because these depend on various contextual factors such as whether the landlord allows a dog/cat or not.
An alternative way of modeling the data is coding the two pets independently as two binary variables (cats yes/no, dogs yes/no). Doing so allows us to explicitly code the interaction for liking both and seeing whether this differs from 0:

In the plot, the blue dots are the interactions. When it differs from 0, it means that liking both pet types is not the same as just adding up the effect of liking either taken in isolation. Most of these blue dots are near 0, though 2 of them are above 0.2 d. These both relate to fertility. So perhaps the same kind of people who like children also tend to like all animals in general, or at least, the typical pets.
The large majority of users on OKCupid were living in Western countries (about 85%), so we might be interested in knowing whether these patterns replicate outside of the West. If they do, they could reflect more general evolutionary patterns rather than something Western specific:

There were about ~5k people not living in Western (European-built) countries (granted, some of these are probably Europeans too). Some of the patterns are different for them. For instance, while dog people were still more conservative than cat people, people who liked neither were the most conservative. The same pattern was seen for religiousness. This may tell us that Europeans are particularly into pets in general, perhaps reflecting the expanded circle of morality. In general, though, the main differences between dog and cat people were fairly consistent across the West and the rest.
In fact, the findings from this study were quite similar to other research using student samples and various other convenience samples. Thus, OKCupid successfully replicated and extended previous research again.
In the past south koreans regarded dogs as guard animals or food not pets. After 2000 the popularity of pet small dogs exploded, raising dogs for food was banned and TFR crashed. The trends of more dogs and fewer children went hand in hand. It's obvious that the correlation exists because the pampered pet dogs are eating the babies.
I like both, but cats have my heart. A kitty is curled up right by me at this very moment—and this cat, no joke, actually saved my life! (Not like in a mental health sense, but literally, *physically* saved my life: she always sleeps next to me, and when I stopped breathing one night, she became so frantic that she woke up my mother, who was alarmed & checked on me... wouldn't have been found until morning, otherwise. Working hypothesis is that I probably gasped and choked or something before the breathing failed entirely, and that's what disturbed her, but no idea really. Still... I owe 'er!)