Fiscal impact of immigrants by country of origin, and the immigration debate
Debunking open borders delusions, and egalitarian dreams
There is a lot of debate about immigration. While it is relatively easy to find crime rates by various immigrants by country of origin, these don't directly tell you whether these make good immigrants in the economic sense. Theoretically, it could be that while one group has a high crime rate they compensate for this by making great new companies that significantly boost the economy. So here's a useful, up-to-date summary of why this theoretical situation doesn't happen often. This is a follow-up post to my prior posts on the topic, like this one trying to teach economists basic economics about immigration.
Quantifying the economic impact of a person
To begin with, we need to think about what the fiscal effects of a person are, from the state's perspective. You could take a time-limited or lifetime perspective. Time-limited perspectives are easier since you only need data for a single year, and making a lifetime assessment requires making statistical projections about how the person will behave in the future.
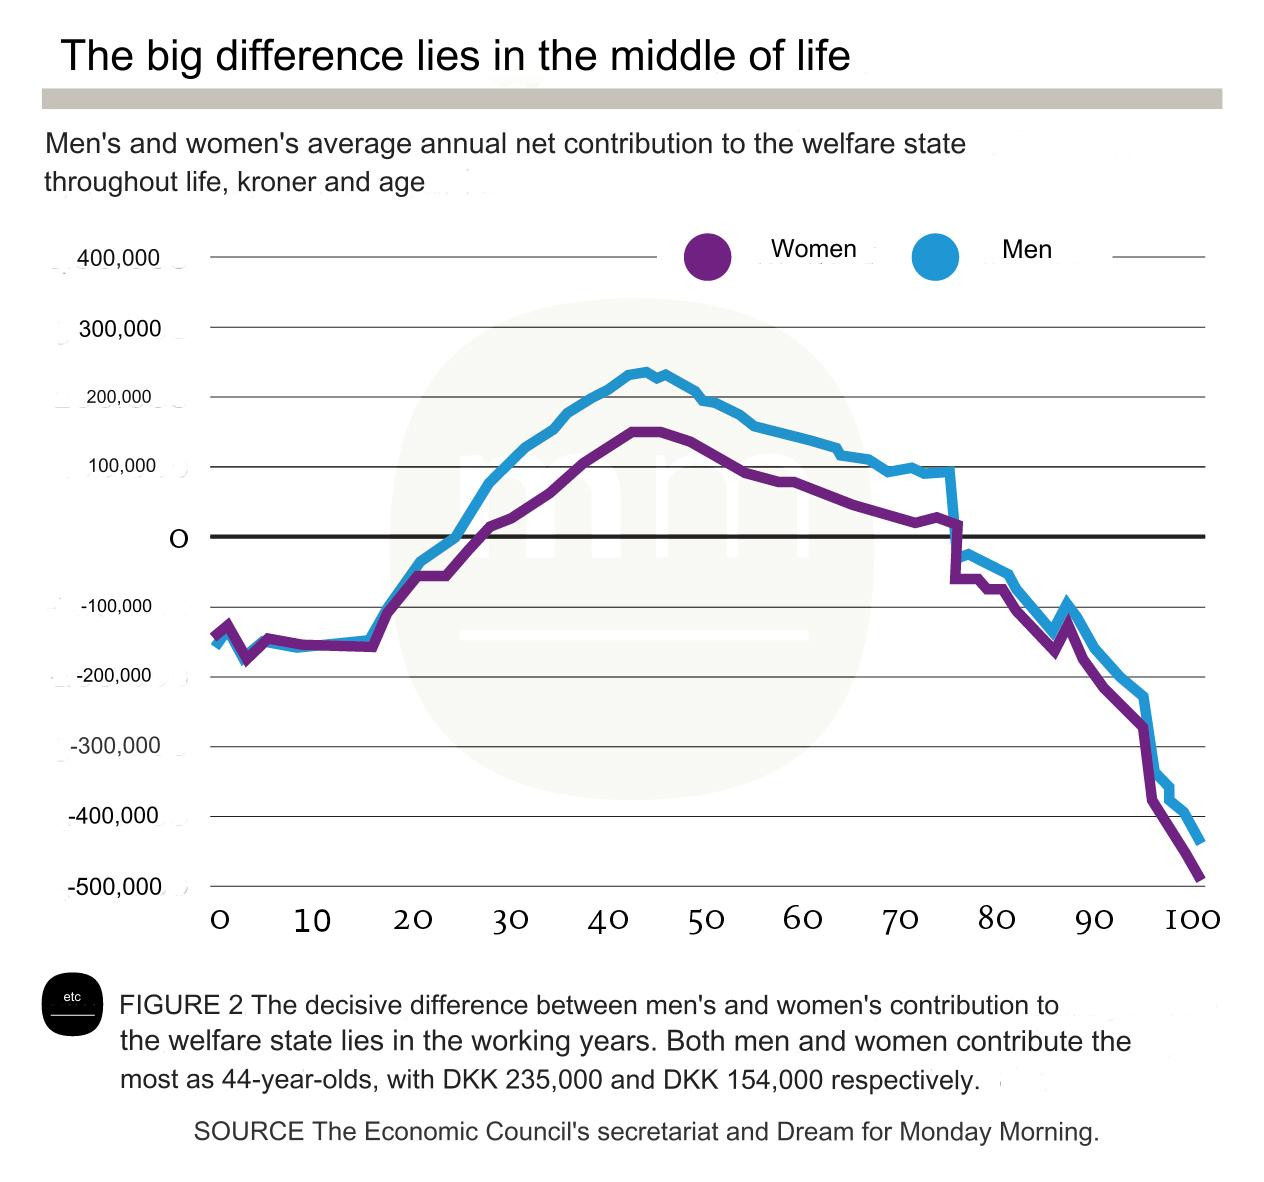
For a single year, though, it is relatively straightforward in theory. You calculate the amount of money the person costs the state that year, and subtract the amount of money the person contributes to the state the same year. The state's revenue is the money they pay in income tax, capital gains tax, sales tax and so on. If one has access to government registry data, most of these can be seen in the tax records. Revenue from sales tax can be estimated from their income and spending behavior. The costs to the state consists of any payouts they are receiving, including unemployment benefits, pensions/retirement, student stipends, housing subsidies and so on, but it also includes the cost of healthcare they use (if publicly subsidized), education, and any time spent by the legal system dealing with their misbehavior (police, courts, prisons, state-paid lawyers). Nordic countries have access to all of this data for residents in their comprehensive registries so one can make very precise estimates for each person and thus also for each group of persons. This single-year fiscal impact is largely determined by the person's age. Here's some Danish 2020 results for the impact of age and sex on a person's fiscal impact.
(Google Translate can translate images now, but with some imperfections. If you know a better tool, post it in the comments.)
Men are in blue, women in purple, and prices are in Danish Kroner, which are about 1/7 to USD/EUR. We see that from age 0 til about 25, both men and women are net negatives from the state's perspective because they cost more money in terms of education than they contribute in taxes. From age 25 until about 75 they are net positive because of state revenue from income taxes and other taxes. After age 75, people are again net negatives until death, mainly due to rising healthcare costs and lack of income taxes. Men are generally more positive contributors than women because they earn more money and thus pay more in tax, and they utilize various government offerings less, whether it is healthcare or unemployment benefits. This figure from the latest report (2023) shows the expenses broken down by category:
Dark grey = health, red = 'vulnerable', blue = education, green = 'care' (retirement/old peoples homes), grey = daycare for children, brown = others.
Going back to immigration, then, you can see that if we look at immigrants who are all working age, they have a very large positive effect of age on their fiscal contributions. It would be very foolish to extrapolate from this single-year of data to think about the costs of immigration in the long-run. To do that, one has to estimate what the curve above would look like if we project their current behavior forwards in time, and again for their children. Doing so, results in this kind of plot, Danish data again from an article in The Economist:
Here we see that immigrants from MENAPT, that is, the non-Asian Muslim world (Indonesia is Muslim), are at no point in their lives, on average, net fiscally positive. The numbers also include data about their children, mainly the 2nd generation, since the 3rd generation is so far very young. Given these results, we know that the economic effect of immigrants from these countries, on average, are net negative. It doesn't matter at which age they enter the country. Looking at the other groups, we see that non-Western immigrants as a whole do better, though their lifetime effect is still net negative. Western immigrants closely follow the Danish curve, but not entirely. If they settle in Denmark, then, their long-term net effect is to slightly harm the Danish economy (at least, compared with the Danes). Given the large negative economic impact of most immigrants, about 70% are non-Western, the Danes and the Western immigrants must be positive, at least slightly, in order for the state not to go bankrupt.
Instead of looking at a curve like the above, we can also look at a table that has the integral of the curve, i.e., the lifetime contribution by group. Here's the results from the same Danish government report:
The red bars show the age-standardized fiscal impact, that is, with the effect of age removed. These tell us what to expect in the future, the longtermist perspective. The blue bars tell us the current fiscal effect due to the current age distribution. Based on this, we can see that Western immigrants are very net positive, because they usually arrive in their working ages, and often leave the country before retirement. This is the typical East European worker. They exemplify the "we wanted workers" dream scenario of immigrants from the perspective of the state. They stay for a while and work, and then leave, so don't impact the long-term demographics of the country, and Danes don't have to pay for their healthcare in old age, or their children. The non-Western groups, on the other hand, are always net negatives, whether we look at their current age distribution, or their long-term expected effects. And the same is true for their children, though these do much better (their negative effect is about half of their parents).
Armed with this fundamental understanding, then, we can look at the results from other countries.
The Netherlands
Last year, a very detailed Dutch report was released in English: Borderless Welfare State: The Consequences of Immigration for Public Finances by van de Beek and colleagues.
Their results thus are much the same as the Danish ones. Non-Western immigrants are a big cost on average, unless they are Israelis or Dutch Afrikaners returning from South Africa (both Europeans). For those interested in the details of specific countries, they include a more detailed table too:
Plotted as a map:
The map, of course, looks just about the same as any other map of countries of the world colored by social indicators.
Finland
Finland has a report too, with an English summary and some figures: Immigrants and Public Finances in Finland Part I: Realized Fiscal Revenues and Expenditures:
USA
As far as I know, there is no economist who has published a study of lifetime fiscal impact for USA for immigrants by origin. However, HBD blogger Ryan Faulk made an attempt for the 4 main races present in the USA in large numbers and got this result:
The model was built from public data about income, welfare use etc.
What do we do when there are no estimates for fiscal impact?
For most Western countries, there are no neat fiscal estimates. However, it turns out that we need not worry because these are very easy to predict from just about any other social indicator. Let's return to the Danish data, since it is one of the most detailed. The government also published this set of estimates of the fiscal effects of immigrants by country of origin:
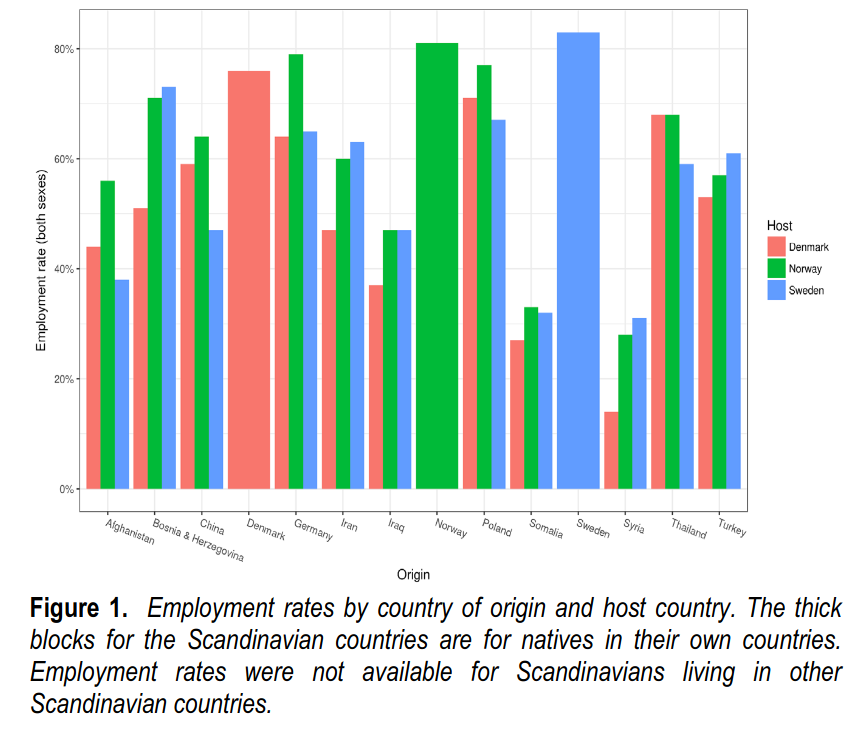
These data reflect the current age distribution of immigrants, as the government unfortunately did not publish results that were age-standardized. Still, the figure presents a fairly typical picture of non-Western immigrants doing poorly, and Western ones doing alright. The non-Asian Muslim countries do the worst of all. Still, these results allow us to check how well these values correlate with other data for the same groups. So let's do that. First, the most obvious indicator of fiscal contribution is simply whether people work at all, so let's check the relationship with the employment rate. I used the 2021 data from the 2023 government report on immigrants in Denmark (latest). Looks like this:
A very strong correlation of 0.85. A few Western countries are outliers, but otherwise nothing much to worry about if we are interested in the big picture.
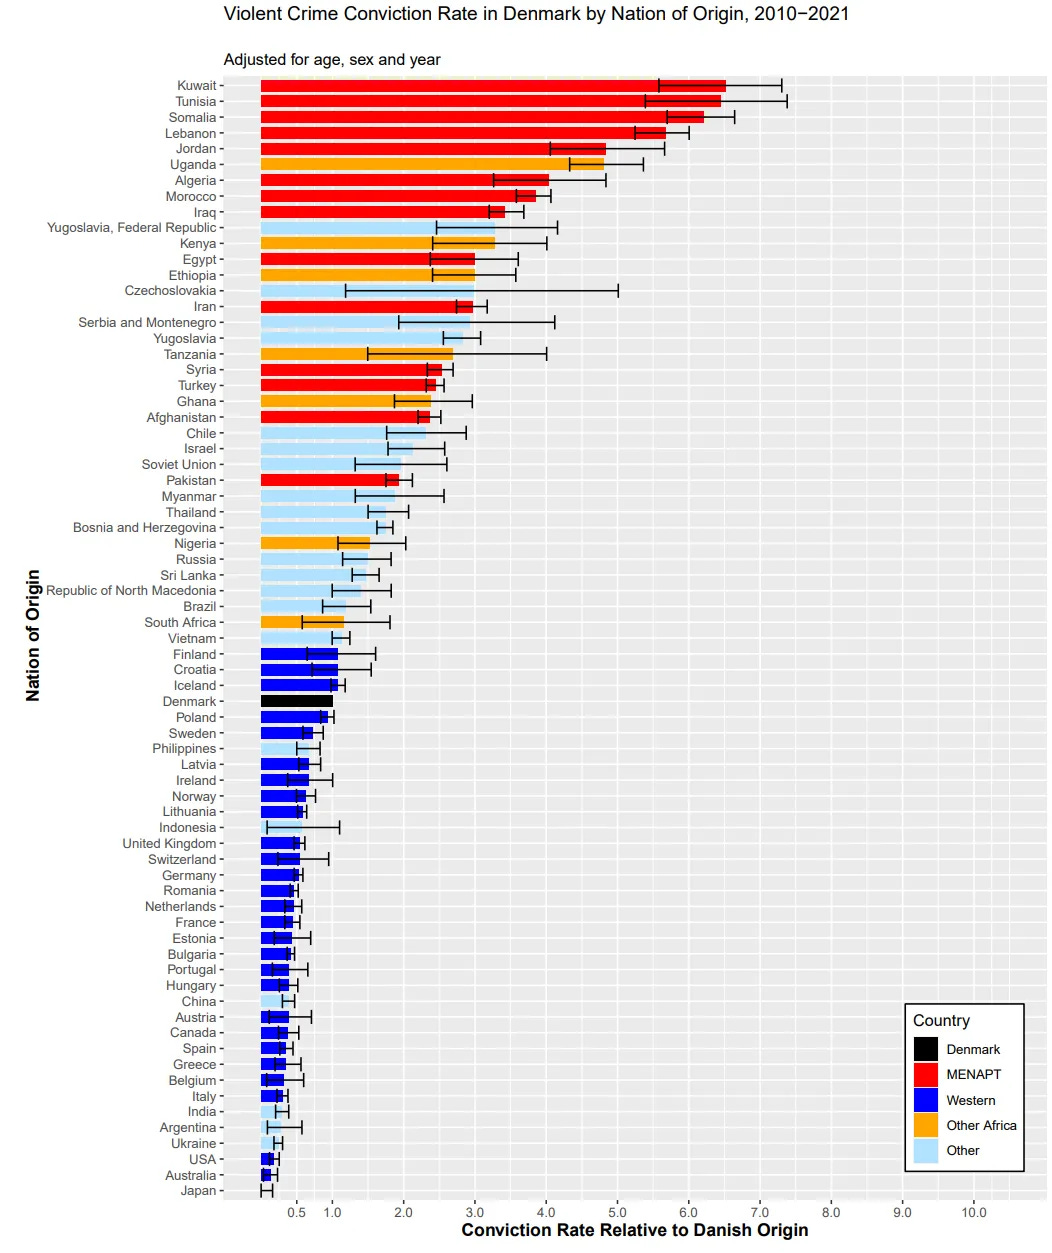
Inquisitive Bird has previously computed the violent crime rates by origin for a large set of countries, and adjusted these for age and sex. They look like this:
And if we correlate these with the fiscal effects:
Then we get about the same result, exact with opposite sign, r = -0.84.
In other words, due to the massive differences between the origin groups, it doesn't really matter much which exact social indicator we look at, whether we use data for different years, or data adjusted for age and sex distribution. The underlying differences are much larger than these confounding factors. Because of this finding, we can also simplify the problem of estimating the net fiscal contributions by origin groups to the task of finding some kind of reliable social indicator, whether crime rates or employment rates, school grades or something else.
If we look to Sweden and Norway, the employment rates by origin country are very similar to Denmark, and so their net fiscal contributions will be too:
Of course, the main topic of debate for the open borders libertarians, like Bryan Caplan, is how things are going in the USA. Fear not, here are some income data for immigrant groups in the USA:
The USA famously has a kind of incoherent immigration policy where some groups are extremely selected for elite status, while others are not. That's why some of the countries are strange outliers above (e.g. South Africa), given what one would expect from their chief indicator of human capital, that is, intelligence. Jonatan Pallesen previously used the Brain Drain database to examine the immigrant selectivity, contrasting the situation in the USA and Western Europe:
Thus, USA has generally strong positive selection (green bars), but not when it comes to the biggest source of immigrants, Mexico (southern border in general). Western Europe has almost no immigrants from Mexico, and those it gets are not selected negatively like in the USA. On the other hand, Europe receives millions of lower class immigrants from everywhere else.
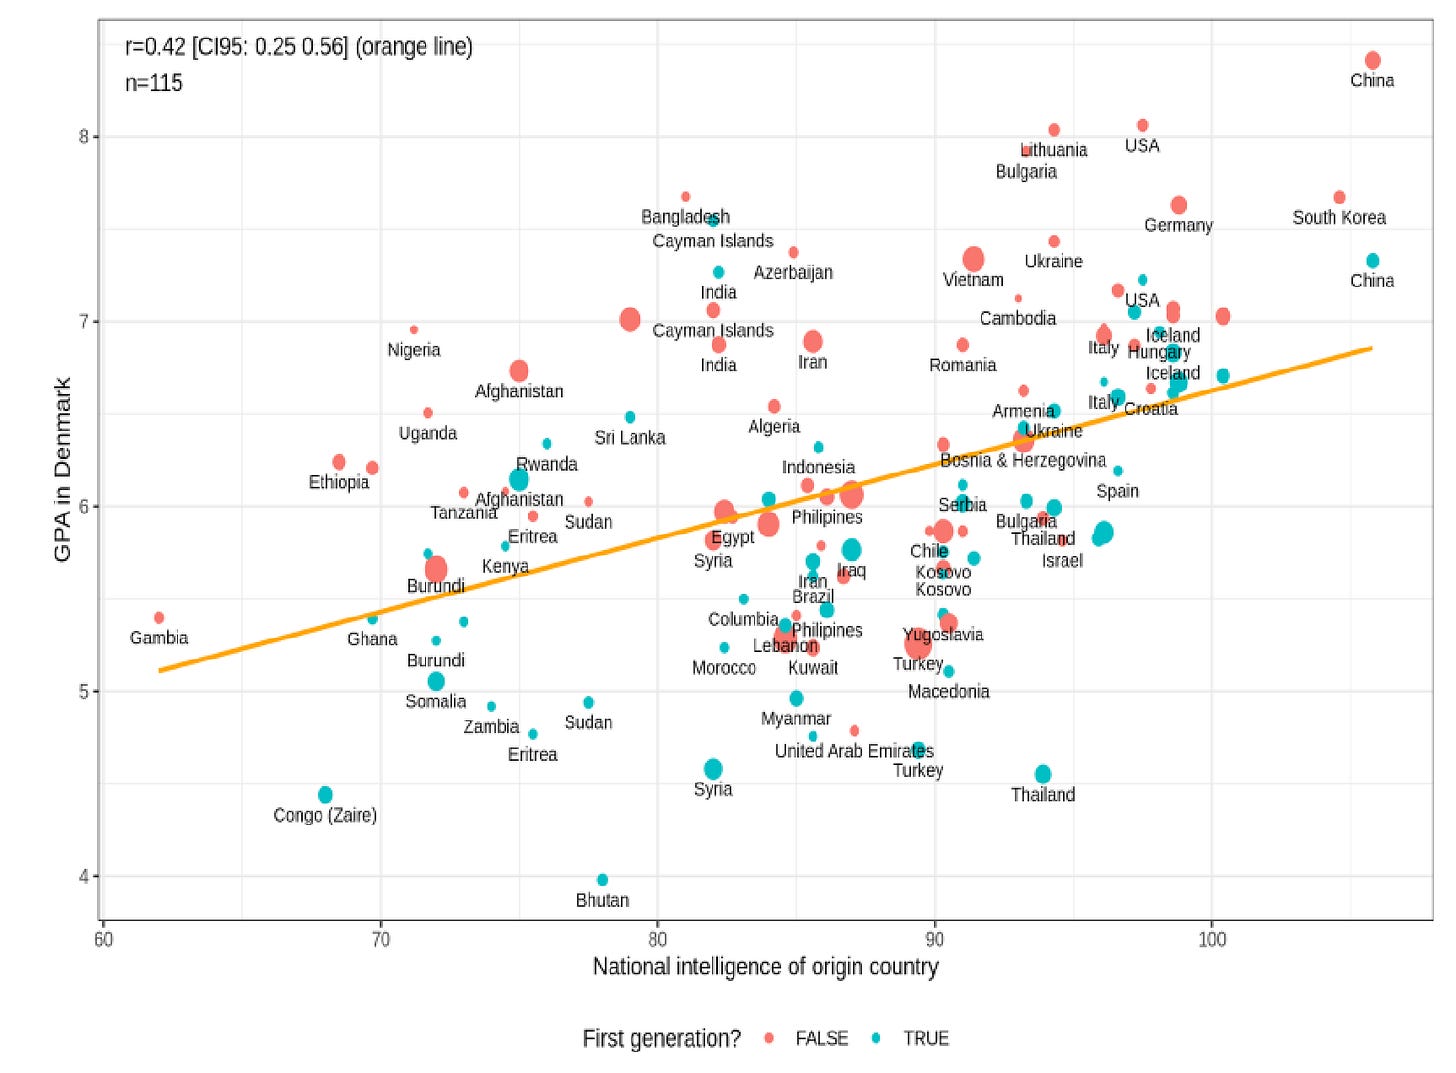
Returning to the question of intelligence as chief cause, I have carried out a large number of studies looking at whether these social indicators are reliably predicted by intelligence of the origin country. The answer is yes. Here's a recent study using school grades, also from Denmark:
Due to the small number of students in the groups, there is a lot of noise that obstructs the stronger underlying correlation.
Here's recent results from Norway concerning standardized math test scores scores:
In this case, the pattern is obscured by the fact that the authors of the report controlled for a large number of other variables, removing true variance (sociologist's fallacy).
And here's the crime rate in the Netherlands:
In 2019, I wrote a longer review of all the existing studies using national IQ as a predictor of immigration outcomes. One could now update this review and do a meta-analysis. I would think that if one obtains a number of social indicators for each origin group in each country, and adjusts for age and sex distribution, and the degree of immigrant selectivity, the resulting generalized immigrant performance score would correlate very strongly with national IQ of the origin country. This is of course not a big surprise since the home countries' social indicators likewise correlate very strongly with their own national IQ (about 0.80), and indeed, are largely caused by this factor. We already live in a global meritocracy, even if some refuse to look at the data.
Summary
A few reports have computed net fiscal economic contributions by country of origin for immigrant groups. These paint a very bleak picture for non-Western immigration, particularly Muslim.
One must take caution to adjust for age when thinking of the long term results from immigration. Immigrants who are mainly of working age appear better in the economic sense that they will be long-term and especially how their children will be.
Net fiscal contribution is very strongly correlated with the more commonly available social indicators for groups such as employment rate or violent crime rate (correlation about 0.85). Thus, the wise policy planner simply uses these as a proxy when fiscal estimates aren't available.
From an economic perspective, the situation is relatively easy to understand. People from good countries will also generally do well in a new country, largely due to their high average intelligence. By applying various methods of immigrant selection to avoid low intelligence immigrants, one can ensure that the economic well-being of one's country stays healthy in the future. People who advocate for open borders in good countries are advocating for making their country worse off. The data are crystal clear on this matter.


In Norway, the bad news came relatively early: the average Somali costs Norwegian taxpayers almost €1 million. The equivalent of a Nobel Prize...
https://www.ssb.no/en/offentlig-sektor/artikler-og-publikasjoner/the-effects-of-more-immigrants-on-public-finances
https://www.abcnyheter.no/nyheter/2013/09/07/181537/hver-somalier-koster-staten-9-millioner-kroner?nr=1
It would be good to expand on this at some point with data on 2nd and 3rd generation immigrants.
As thing stand, I'm sure certain people will accept the data as it is now but claim that in say 30 years, all the low IQ, rapey migrants will have developed into model citizens. They'll make a spurious comparisons to Irish or Italian migrants to the USA to show how brilliant they can be long term.
I guess you'd need to show that firstly, the Irish/Italians had much less of a welfare state to leech off relative to MENA types today. The Irish/Italians also may have committed a disproportionate amount of crime at the time, but to nowhere near the same extent as MENAs now.