Good immigrants, bad immigrants: Dutch edition
Summary of Jan van de Beek et al 2024
People have been posting results from this new Dutch study of immigration, so I thought I would cover it here to increase the reach.
van de Beek, J., Hartog, J., Kreffer, G., & Roodenburg, H. (2024). The Long-Term Fiscal Impact of Immigrants in the Netherlands, Differentiated by Motive, Source Region and Generation.
We use very detailed microdata on fiscal contributions and benefits of the entire population to calculate the discounted lifetime net contribution of the immigrant population present in The Netherlands in 2016. We differentiate by immigration motive and up to 87 source regions. Labour migrants' net contribution is positive, study, family and asylum immigrants' contributions are negative. Second generation scholastic performance scores at age 12 by social background are similar to scores for native Dutch children, highest education attained for given test scores is also similar, but incomes for given education levels are lower, and so are net contributions. The gap between net contributions of individuals with immigrant background and without immigrant background does not root in attained levels of schooling but in the benefits from schooling. Regional cultural distance to Protestant Europe is associated with large fiscal net contributions.
I think it's a shorter write-up of their prior report which I also read (Borderless Welfare State), but it is worth covering as it has nice English language figures.
The methods are complicated overall, but essentially:
The Dutch government shared individual-level data about people with them.
This includes their use of social programs, justice system, their taxes paid, test scores, educational attainment, and so on.
For each person, one can estimate the net contribution by adding up all the revenue and subtracting all the costs. Costs that are public goods that can't be allocated to a given person are split evenly (e.g. roads).
One can compute this across ages, and also estimate the total net contribution over a lifetime using some sensible extrapolations.
First of all, these are the numbers of people in the Netherlands right now:
The immigration status is inclusive, so children with 1 Dutch and 1 foreign parent are 2nd generation immigrants (migration background, same as the German statistics, but opposite that of the Nordics). About half the foreigners are western, and Dutch are 78% of the population. Western is broadly defined so as to include former communist East Europe, and strangely also Indonesia. Why? They used the Dutch statistics office's definitions:
The classification into continents follows the CBS classification into 'Western' and 'non-Western' (R2) and according to this classification, North America (in the continent America), Japan and Indonesia (in the continent Asia) are classified by the CBS as the 'Western' parts of otherwise 'non-Western' continents. Conversely, Turkey was classified by CBS as a ‘non-Western’ part of the otherwise ‘Western’ continent of Europe.
Notice that also Japan is western. Curious.
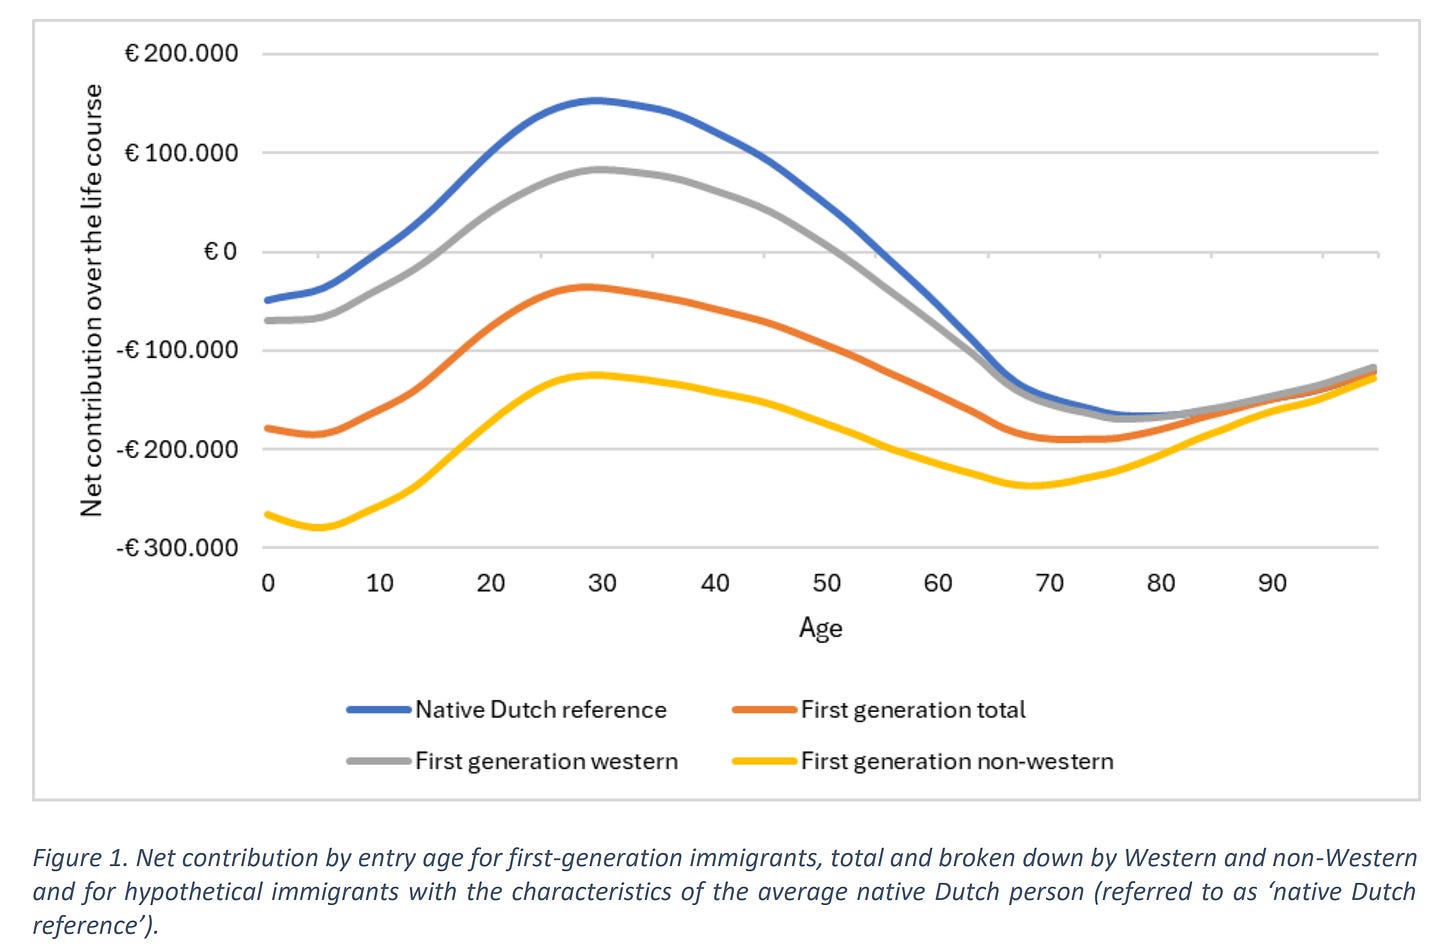
To understand the findings, one has to understand the usual age function:
Focus on the blue line for natives. People are net negative while they are young before they work, and net negative after they stop working. Children cost some money and produce nothing, retirees cost a lot of money (in pensions and healthcare) and produce little. Working age people produce a lot and cost little. The entire point of having useful immigrants is having people whose net contribution curve is pushed upwards such that the lifetime value is as positive as possible. As can be seen here, no matter at which age and where immigrants come from outside of the west, broadly speaking, they are net negative across the line span, as the Dutch natives are approximately net neutral. (I note that their models must be somewhat off because age 10 is when natives become net positive, but that's impossible, it cannot be earlier than 20, and more realistically 25-30.) But this hides substantial heterogeneity:
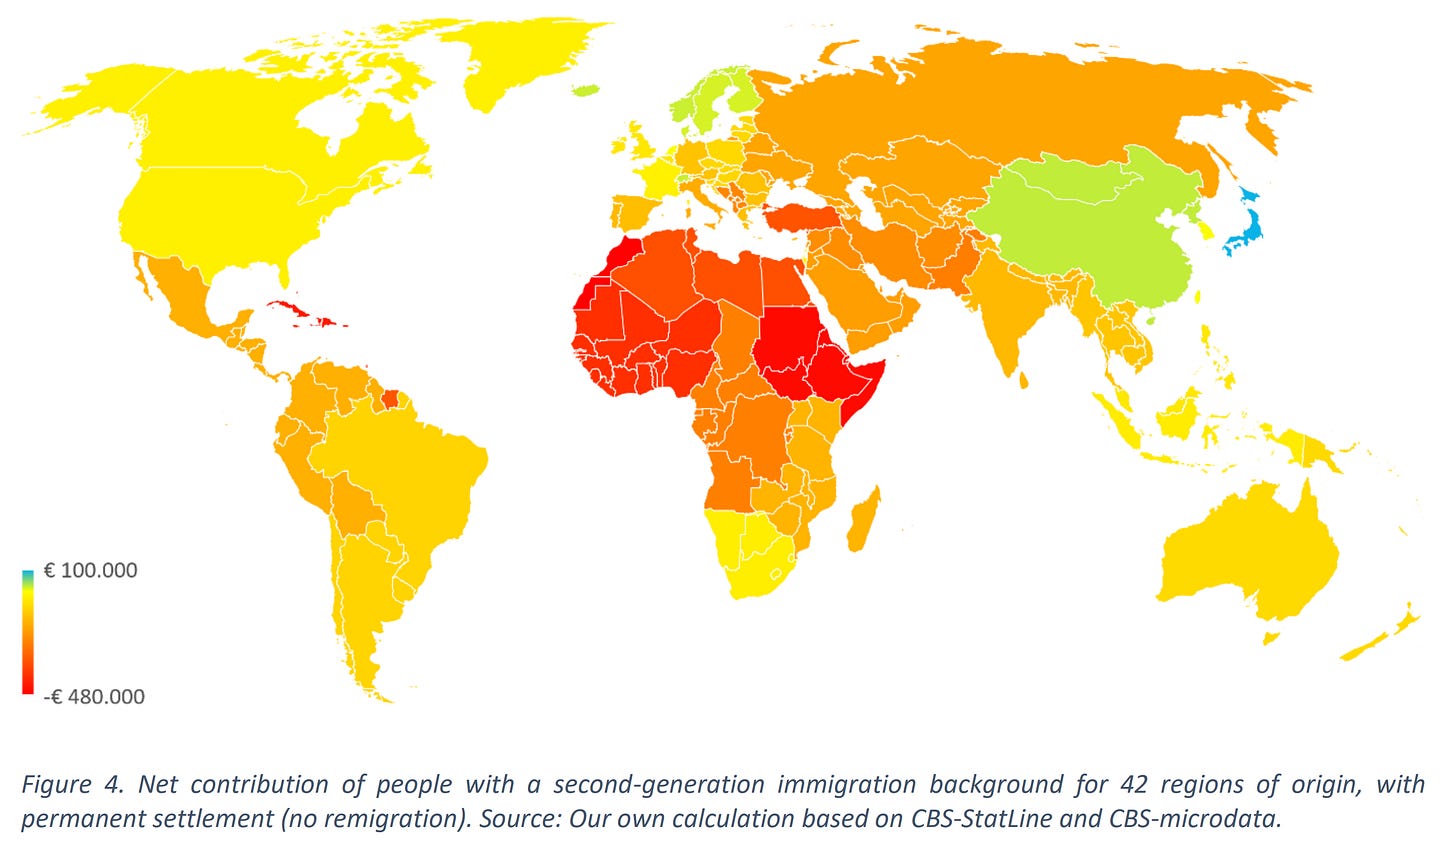
I think these are lifetime estimates for migrants from these areas, based on their actual ages of arrival and sometimes departure (remigration). The reader will notice that the south of Africa is positive:
Immigration from the Southern Africa region is for the most part immigration from South Africa and consists for a considerable part of immigrants with recent or older Dutch roots.
In other words, these are mostly Europeans who are leaving hostile regimes in Africa they had migrated to earlier in history, especially South Africa. Note that since the data are sparse, some areas are merged, and that's why the nearby countries to South Africa are also in blue (Papua New Guinea is also blue because it's grouped with Australia and New Zealand).
Aside from that, the results are roughly what one would expect from a human capital -- mostly national IQ -- perspective.
Another way to look at this is to look at the legal basis for someone's stay in the Netherlands:
It is surprising that even migrants who came to study end up being net negative, no matter what age they arrive in the Netherlands at. This is strange because if migrants arrive at age 20, and only receive (or pay for) higher education, all of their childhood related costs are already paid for, so it would be difficult to end up as net negative as a whole. However, we see that that they do in fact do so anyway, no matter what age they arrive at. I imagine this is mainly because they end up in jobs that simply don't pay enough compared to their social spending. Only migrants who arrive to work end up as net positive. My tentative conclusion from this is that whatever selection the Netherlands is doing on the migrants who wish to study in the Netherlands, they are not strict enough by a large margin. Here a simple IQ test required for migration may fix things, say, 105 or 110 being a useful threshold.
The figures above are not really what matters most though. What matters most is the long-run outcomes:
These are for the 2nd generation, based on modeling their likely contributions and costs over a lifetime. This is essentially a forecast based on the observed data for metrics like test score, education, and income, as few 2nd migrants have reached the end of their lives yet. Still, it is likely to be very accurate because it is easy to estimate group performance across metrics, as they typically correlate very highly. Roughly the same groups have high average incomes as are highly educated, and are low crime, and low on welfare use. It's for this reason one can speak of a general group level socioeconomic or S factor, the same as seen between countries and between individuals.
With the figure, note that yellow means about even performance as the natives, and any shade of orange or red means they are net negative, and green-blue meaning they are net positive, that is, perform better than the natives. Few countries in the world send migrants that in the long-term outperform the Dutch, which is not surprising since Dutch people are very high human capital. The countries sending net positive migrants are Nordics, Switzerland, Japan, and China (I think Mongolia and North Korea are grouped with China and probably sends very few migrants). The yellow countries are those that send migrants who perform about the same, so which are net neutral and probably also integrate well. These are most of the remaining NW Europeans, and the Europeans returning from South Africa. Curiously, the German countries send slightly net negative migrants, as do the Slavs and southern Europeans. Again curious is that Indonesia and that region send net neutral people, and most of those can't be Europeans returning. This is at odds with results from Denmark.
More interesting is that the authors have access to IQ data. Granted, they explicitly say it's definitely not an IQ test:
The CITO test is not an IQ test (intelligence test). CITO even chose the scale of 501-550 in order to avoid the End Test being interpreted as an IQ test.71 According to CITO, the main difference is that in the End Test the focus is on achieved learning progress, while in the intelligence tests also developed by CITO, the focus is on reasoning skills that are relatively little influenced by what is offered at school. Nonetheless, the End Test correlates rather strong with the ‘CITO Intelligence Test Secondary Education’ (CITO Intelligentietest Voortgezet Onderwijs, r = .76, N = 761 for age-based IQ-score and r = .74, N = 175 forgrade-based IQ-score), and with the ‘CITO Intelligence Test End-of-Primary-School-Test’ (CITO Intelligentietest Eindtoets Basisonderwijs, r = .72, N = 520).
But a test that correlates 0.76 with another intelligence test is certainly an intelligence test. It doesn't matter what the label given is, only what it measures (jingle jangle fallacy).
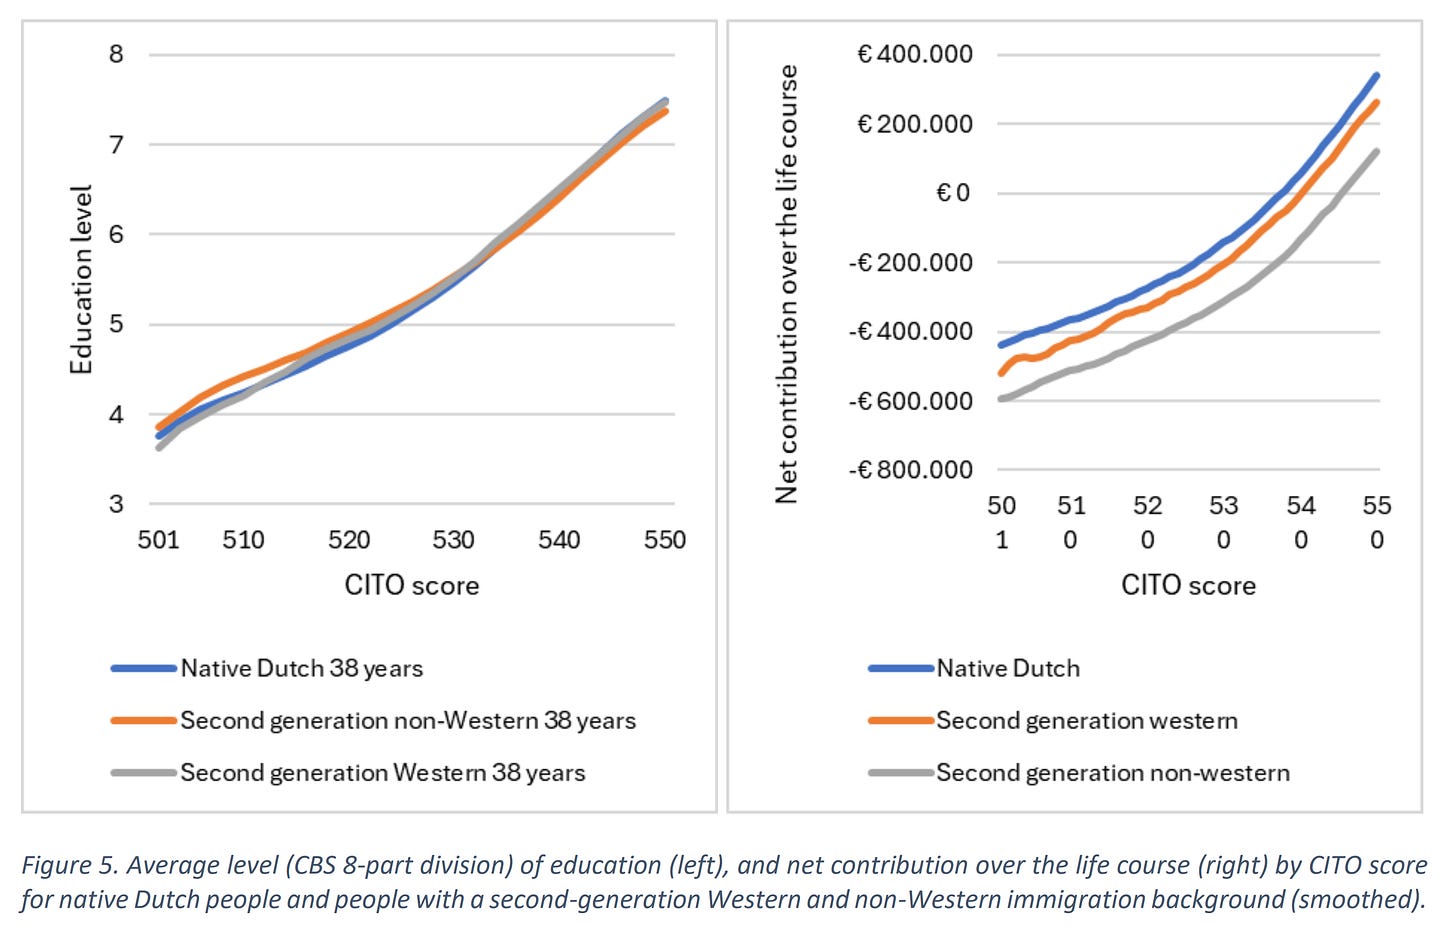
A way to measure bias in society or non-cognitive human capital is to see whether people achieve the same success in life given identical test scores:
For this, they use only 2nd generation immigrants along with the natives, so as to avoid schooling or language bias. For education, there are no differences. A score of 110 IQ (or whatever) results in the same level of education whether you are Dutch or something else. However, for lifetime net contribution, the Dutch natives still have an advantage, especially over the non-westerns. This can be interpreted both as racism in society or as non-cognitive advantages by the Dutch. I think the latter are more likely.
Helpfully, they also provide an IQ map of the 2nd generation migrants:
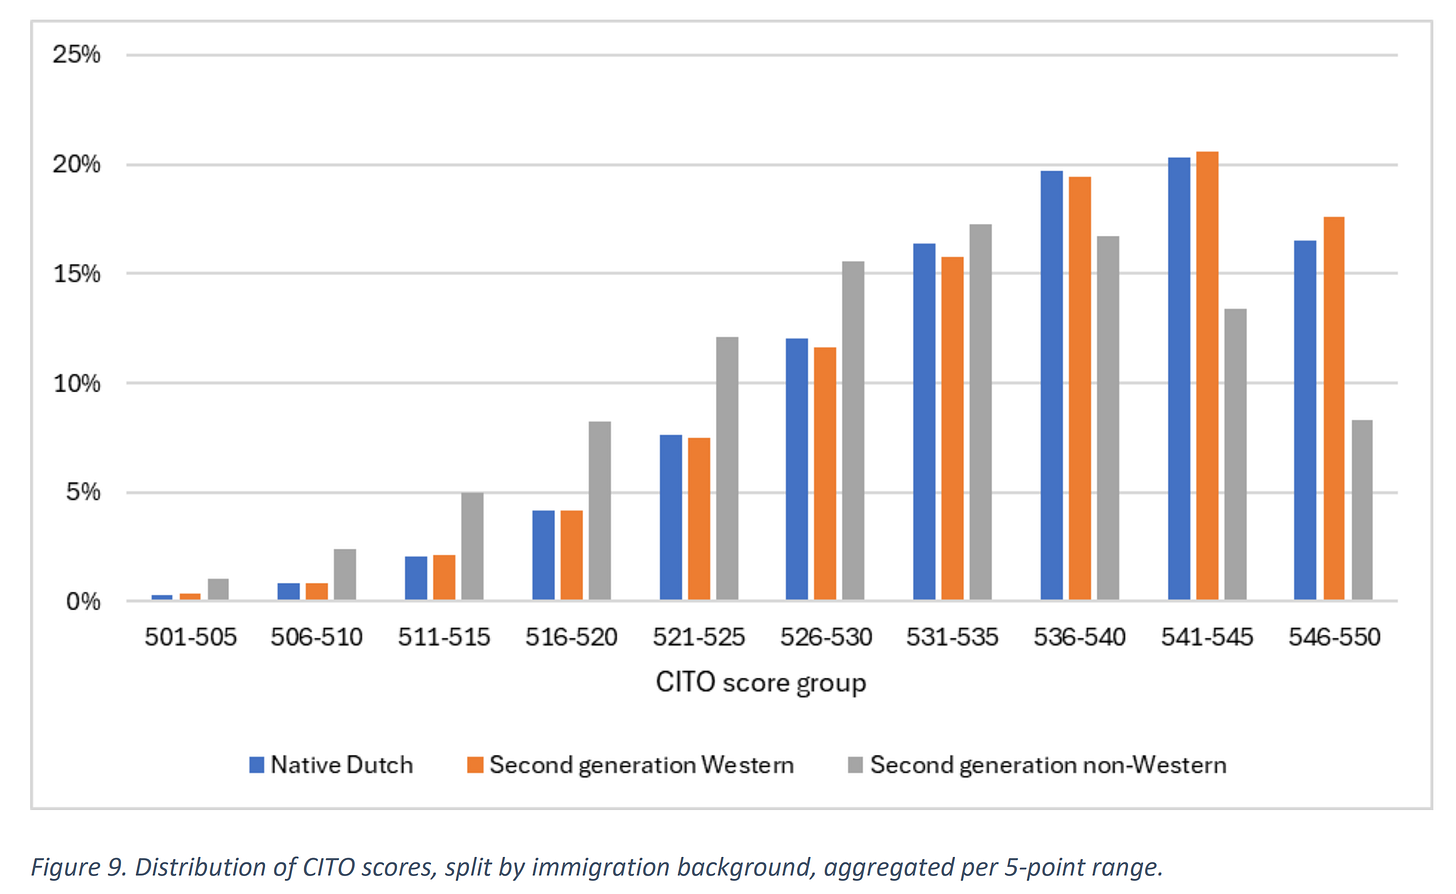
It would be more useful to convert this to IQ values. 536 is the Dutch mean (~100 IQ), and the standard deviation is about 10 points (9.6). Unfortunately, we can't just use standard deviations here to convert to IQ because the test has severe ceiling issues:
About 16% of the Natives obtain scores within the top bracket. Thus, the right tail is suppressed, and the true SD would be larger. They need to add harder questions to the test.
These issues aside, it seems that in terms of just scholastic ability (mainly intelligence), the returnees from southern Africa do well, and are probably positively selected. Turkey does very poorly, worse than the Africans. This mirrors the Danish PISA results where Turkish 2nd gen. migrants do worse than Turkey itself on PISA. This probably has to do with the negative selection with the "guest worker" programs the Turks arrived under. They were meant to be temporary workers for low skill jobs, but never left. Overall, though, the Dutch immigrant IQ map is very highly correlated with the national IQ map (same as found in Norway).
Overall, the report reveals the staggering costs of migration to the Netherlands as a whole. Netherlands would have been much better off had they restricted migration to nobody at all.
Or donate some crypto (no other means available):
BTC: bc1qxkvlkaawqdygp4ux5ng4c44udxz0l66p9asu8n
ETH: 0xB4609Ea8B6c51536f6f98D5e9a903eb3790D0BCa
XMR: 4AXtTjC6V1GZVFHfjUwwU8UbVmS4d7GZxRVn4Sx55ixeFdwrpafM3RihuWxZUKEb9pFygQ1G16HkL2c2jzx5jwpSAqwYtEi


Thanks for another excellent article.
"Overall, the report reveals the staggering costs of migration to the Netherlands as a whole. Netherlands would have been much better off had they restricted migration to nobody at all."
Yes, that is the bottom line. And it is true of all European countries that allow non-Western immigration.
I did not see figures for the cost of increased crime, both economic and personal.
I don't know about nowadays, but in the past, most people migrating from Indonesia to Netherlands were mixed-dutch people. https://en.m.wikipedia.org/wiki/Indo_people