
Migration and feelings of safety in Denmark
Africans + non-Asian Muslims% has a -0.85 correlation with subjective trust

A politician from the Social Democrats called Frederik Vad (center-left government party) posted results of a survey about how safe citizens report feeling in various areas of the country. There is an obvious association with ethnic Danish% in the areas and high reports of safety (tryghed). He didn’t post the scatterplot and the report didn’t even include the data in the appendix (seemingly by mistake). I computed average feeling of safety for the 98 communes (2nd level divisions akin to US counties, UK local authorities, German Kreis) and fetched the ‘MENAPTA’ middle eastern, north African, Pakistani, Turkish, and African %, including 2nd generation. Yes, the acronym is getting a bit silly, one could instead say AMEPT or some other order to avoid having both “north African” and “African”, but since MENA(P)(T) is the standard acronym here, it made more sense to add (Sub-Saharan) Africa to it than confuse people. Using the Ministry of Justice’s (MOJ) own survey results for the years 2021-2024, we can construct this map of average levels of reported safety:
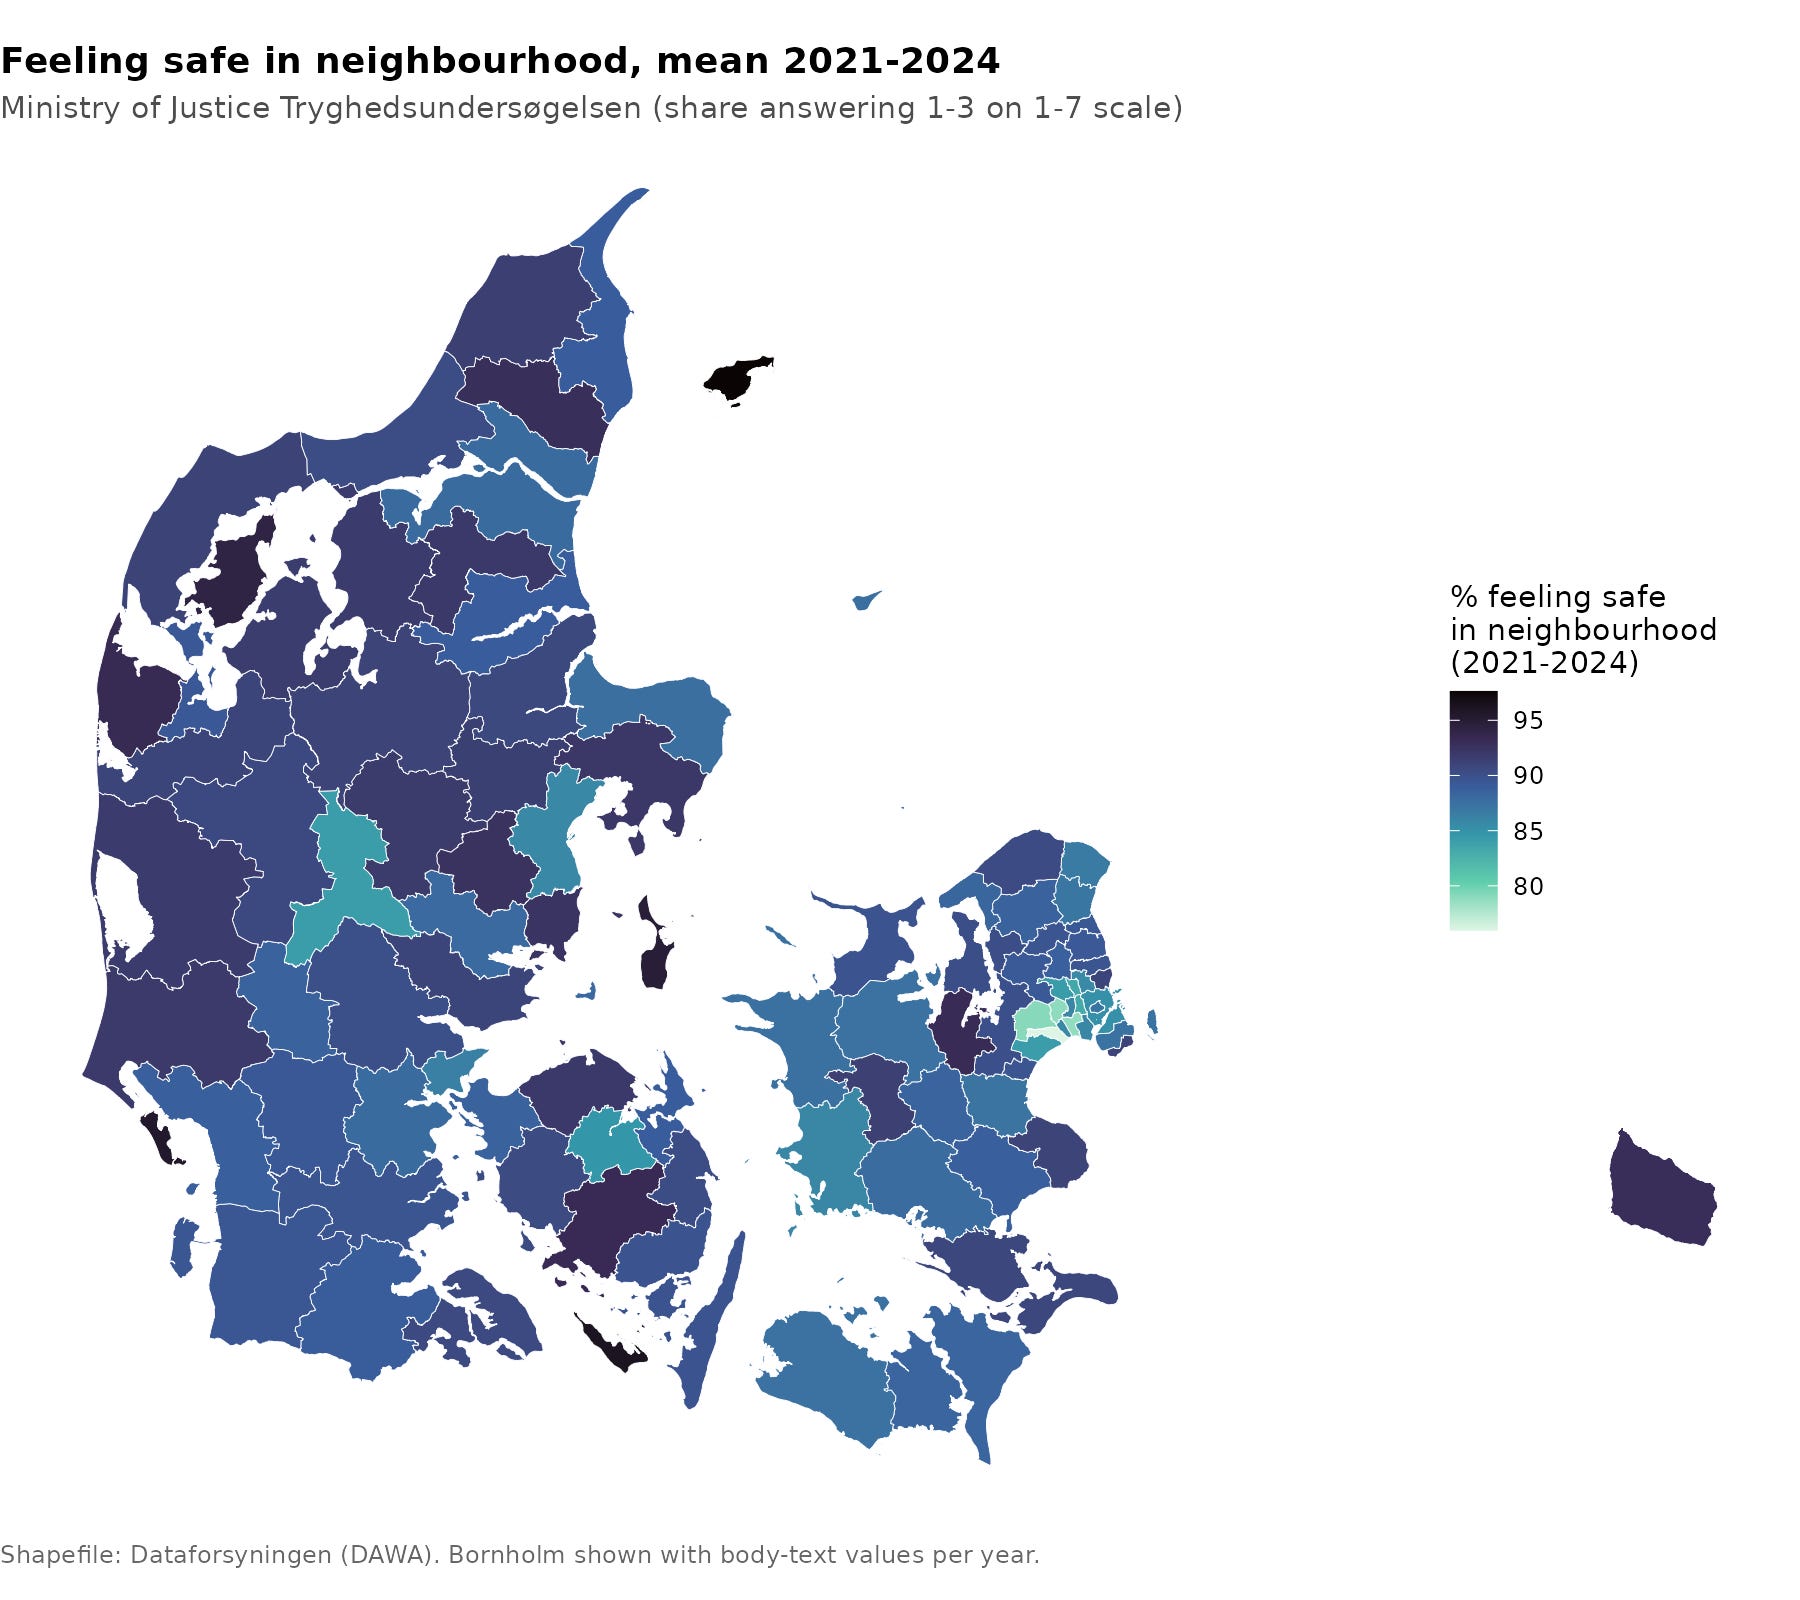
The areas are too broad to really show what is going on in detail except for Copenhagen, where it is quite clear. All the communes with larger cities (Aarhus, Odense, Aalborg, København) have low ratings of safety, which of course could be due to many factors. Nevertheless, given the known crime rate differences, the most obvious idea to check is this one:
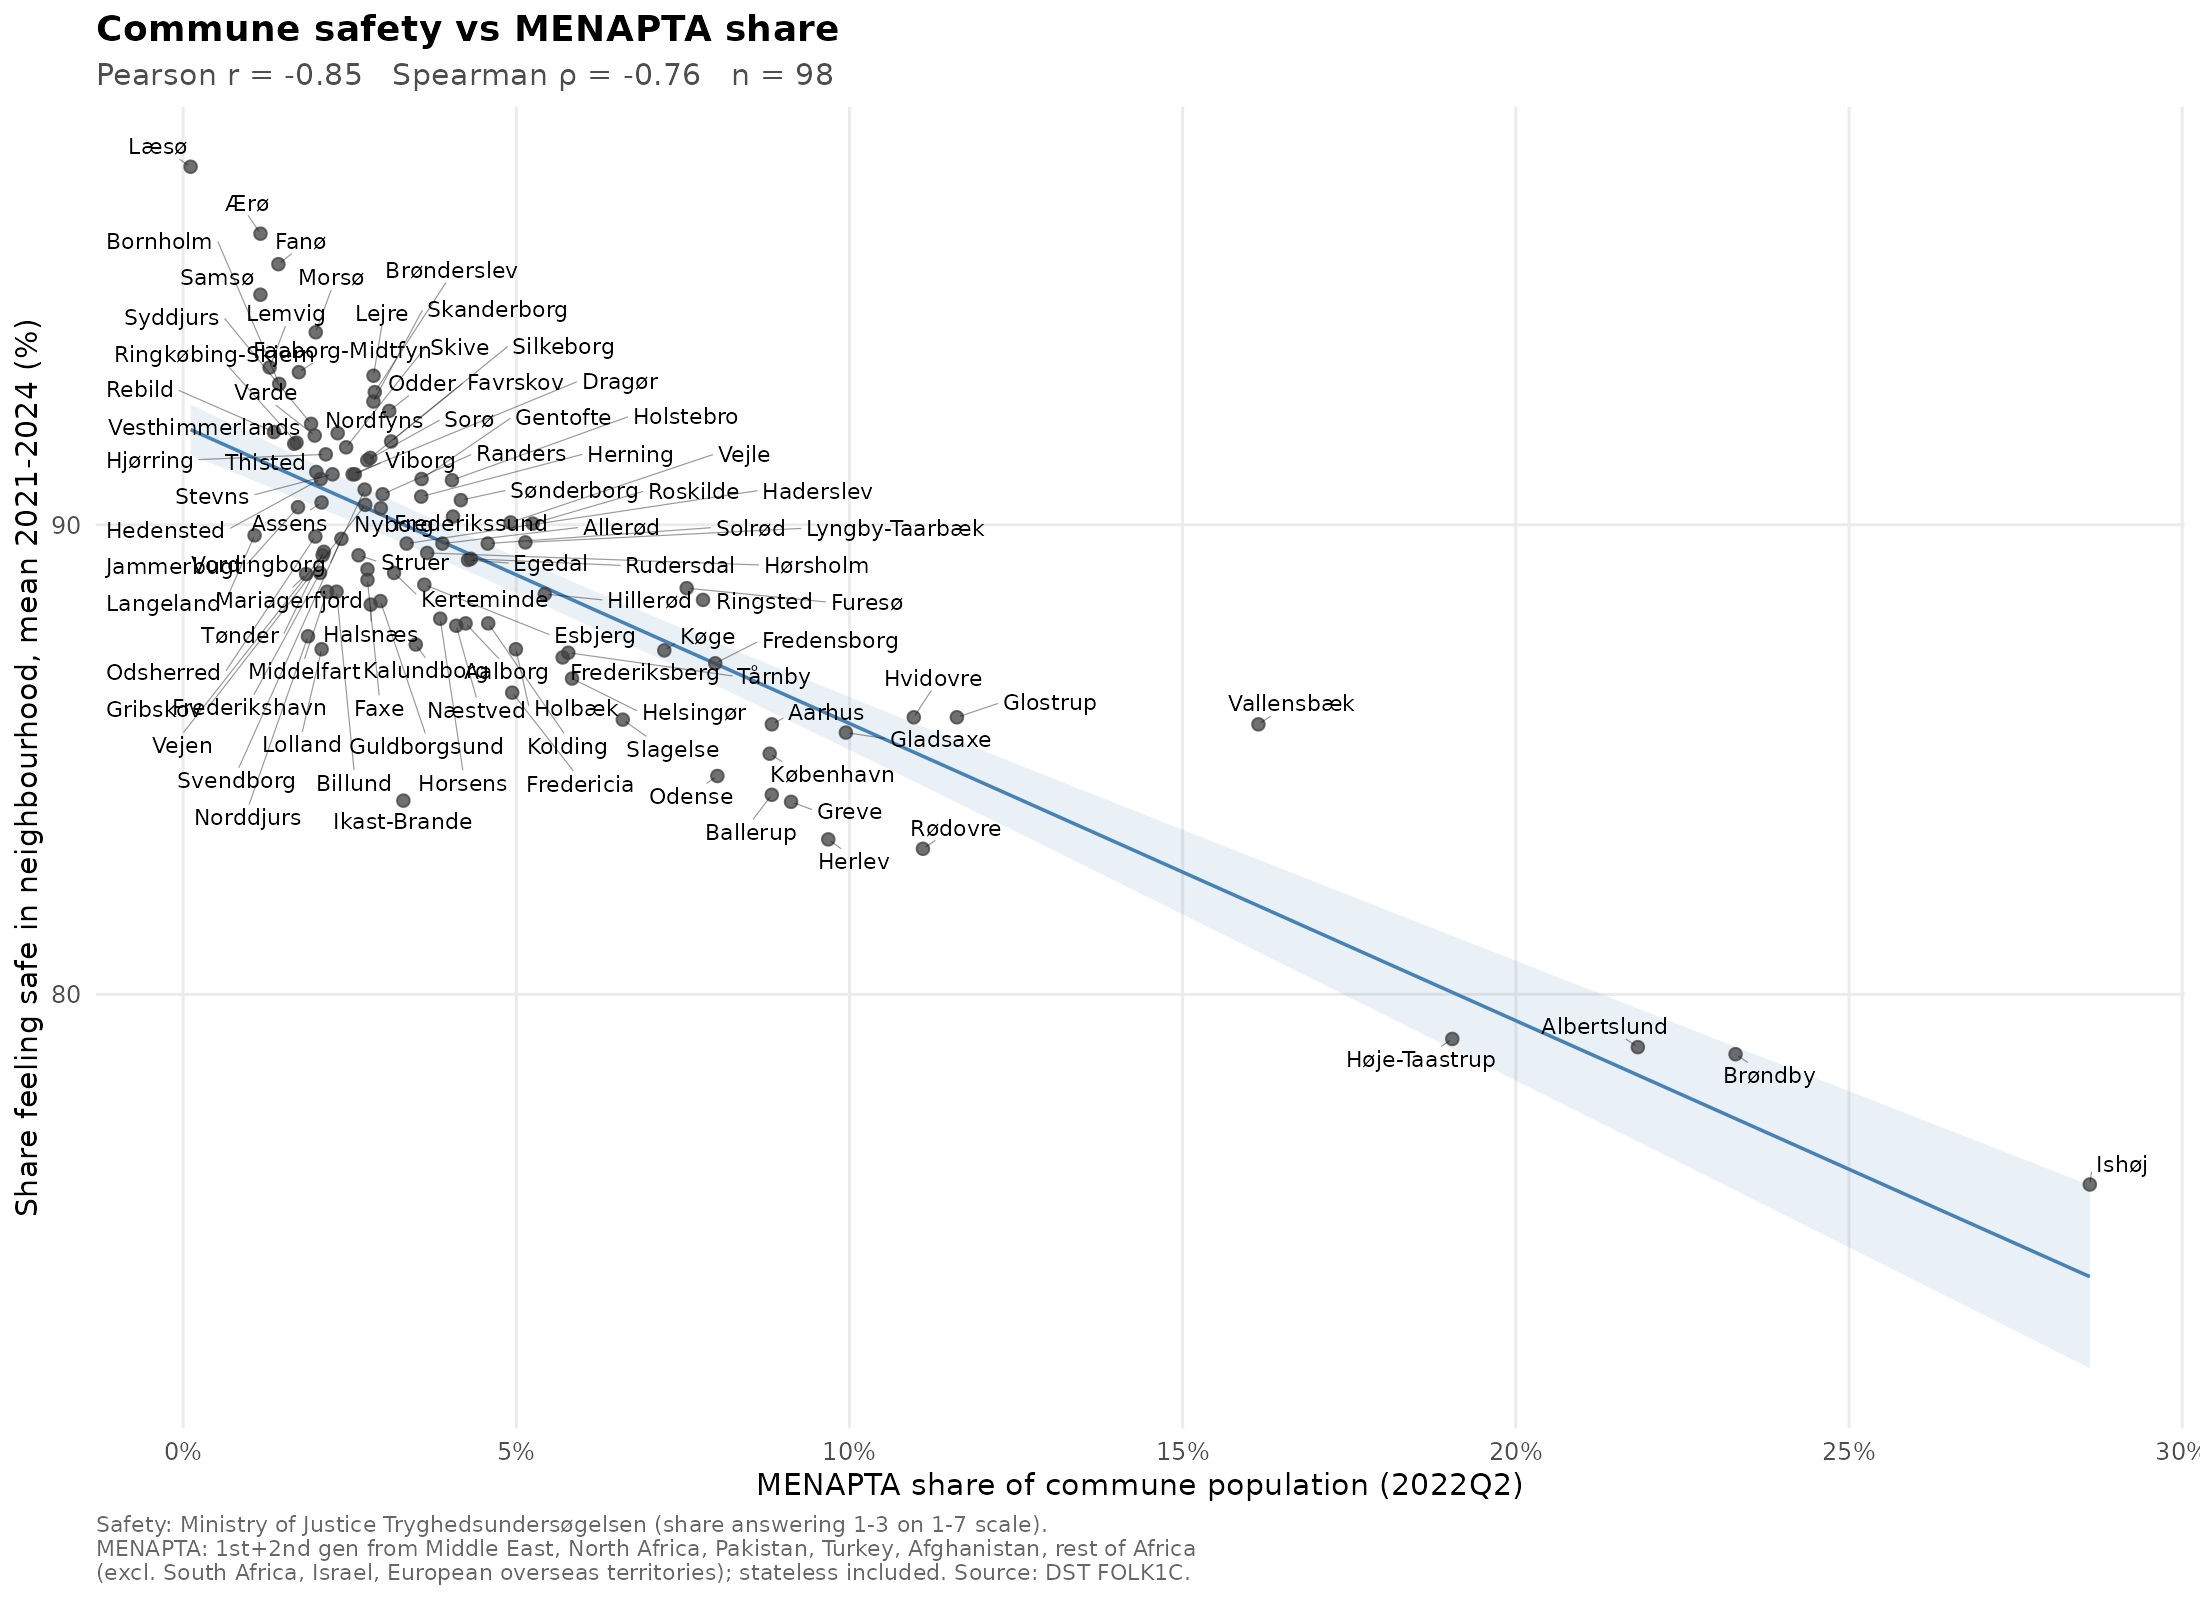
It’s a strikingly strong correlation. Compare with the others:
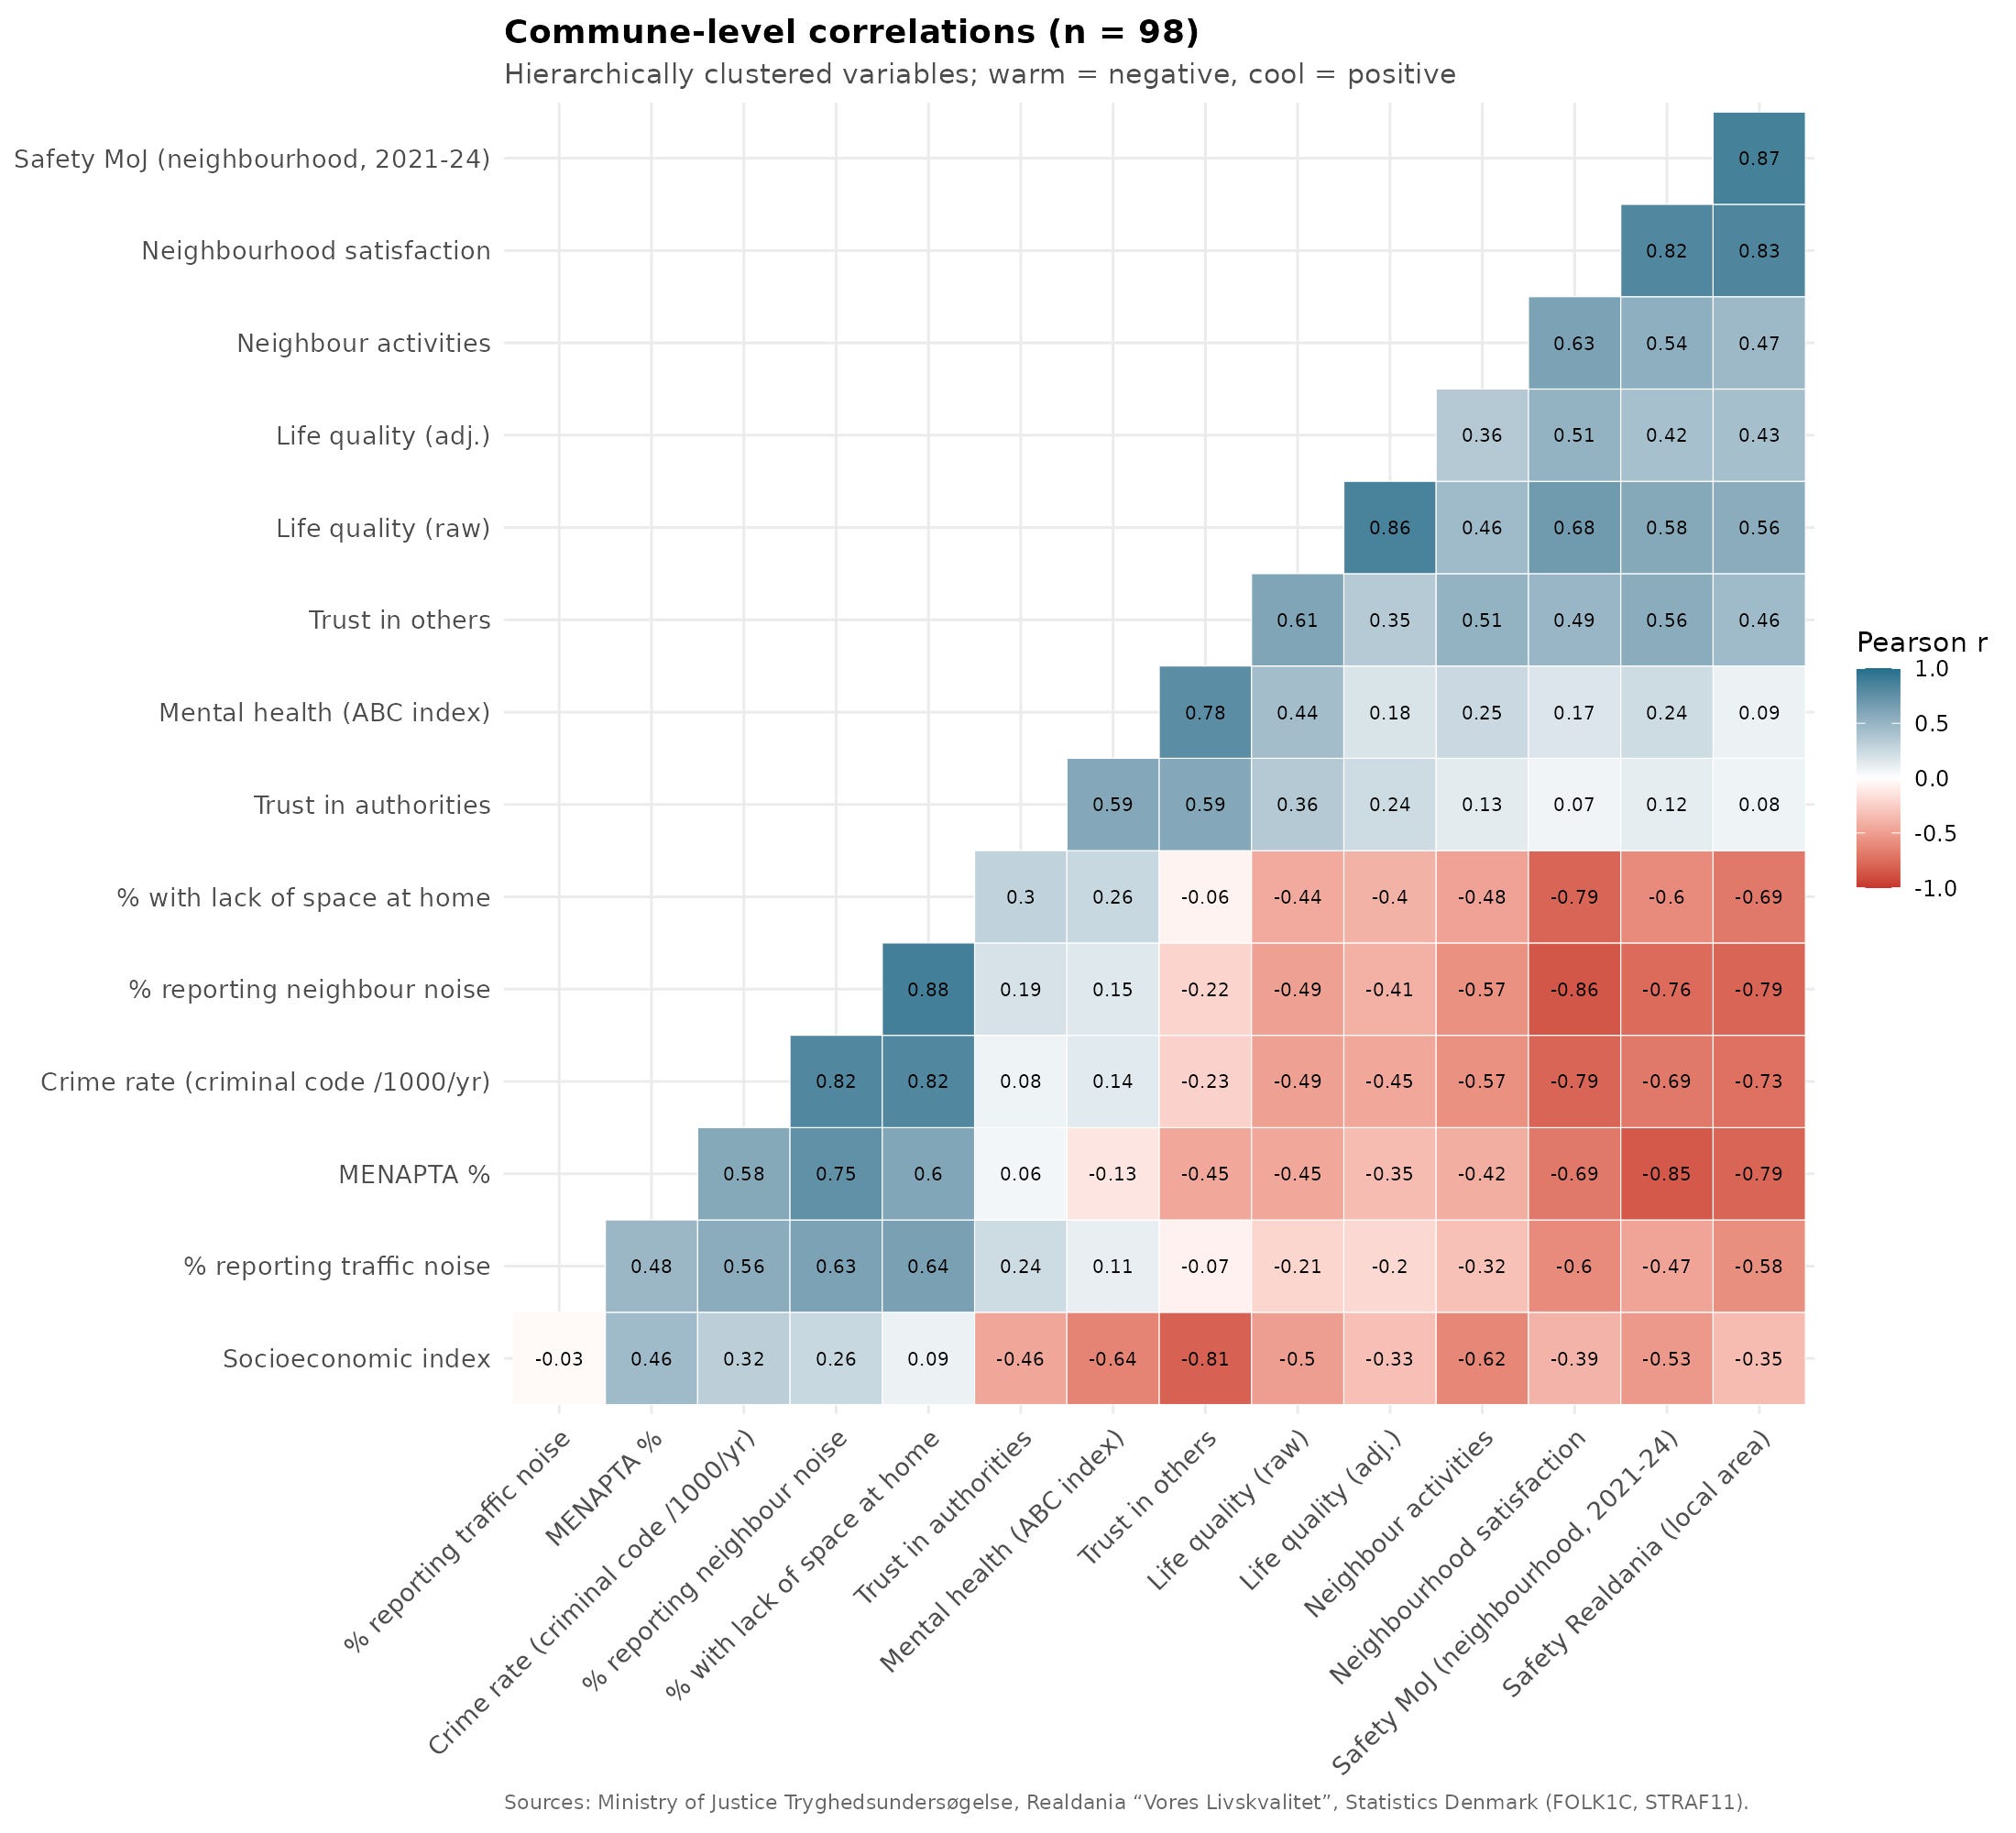
So MENAPTA% is the strongest correlate of feelings of safety, aside from the other measures given in the same survey. Some of the stranger correlations are probably due to aggregation issues. Aside from the Copenhagen splits, the other large cities are in a single commune unit that is thus composed of migrants, university students, rich Danes, working class Danes and so on, which may create strange patterns.
For those wondering about regressions, maybe it is population density in some sense that causes safety concerns. So let’s try that:
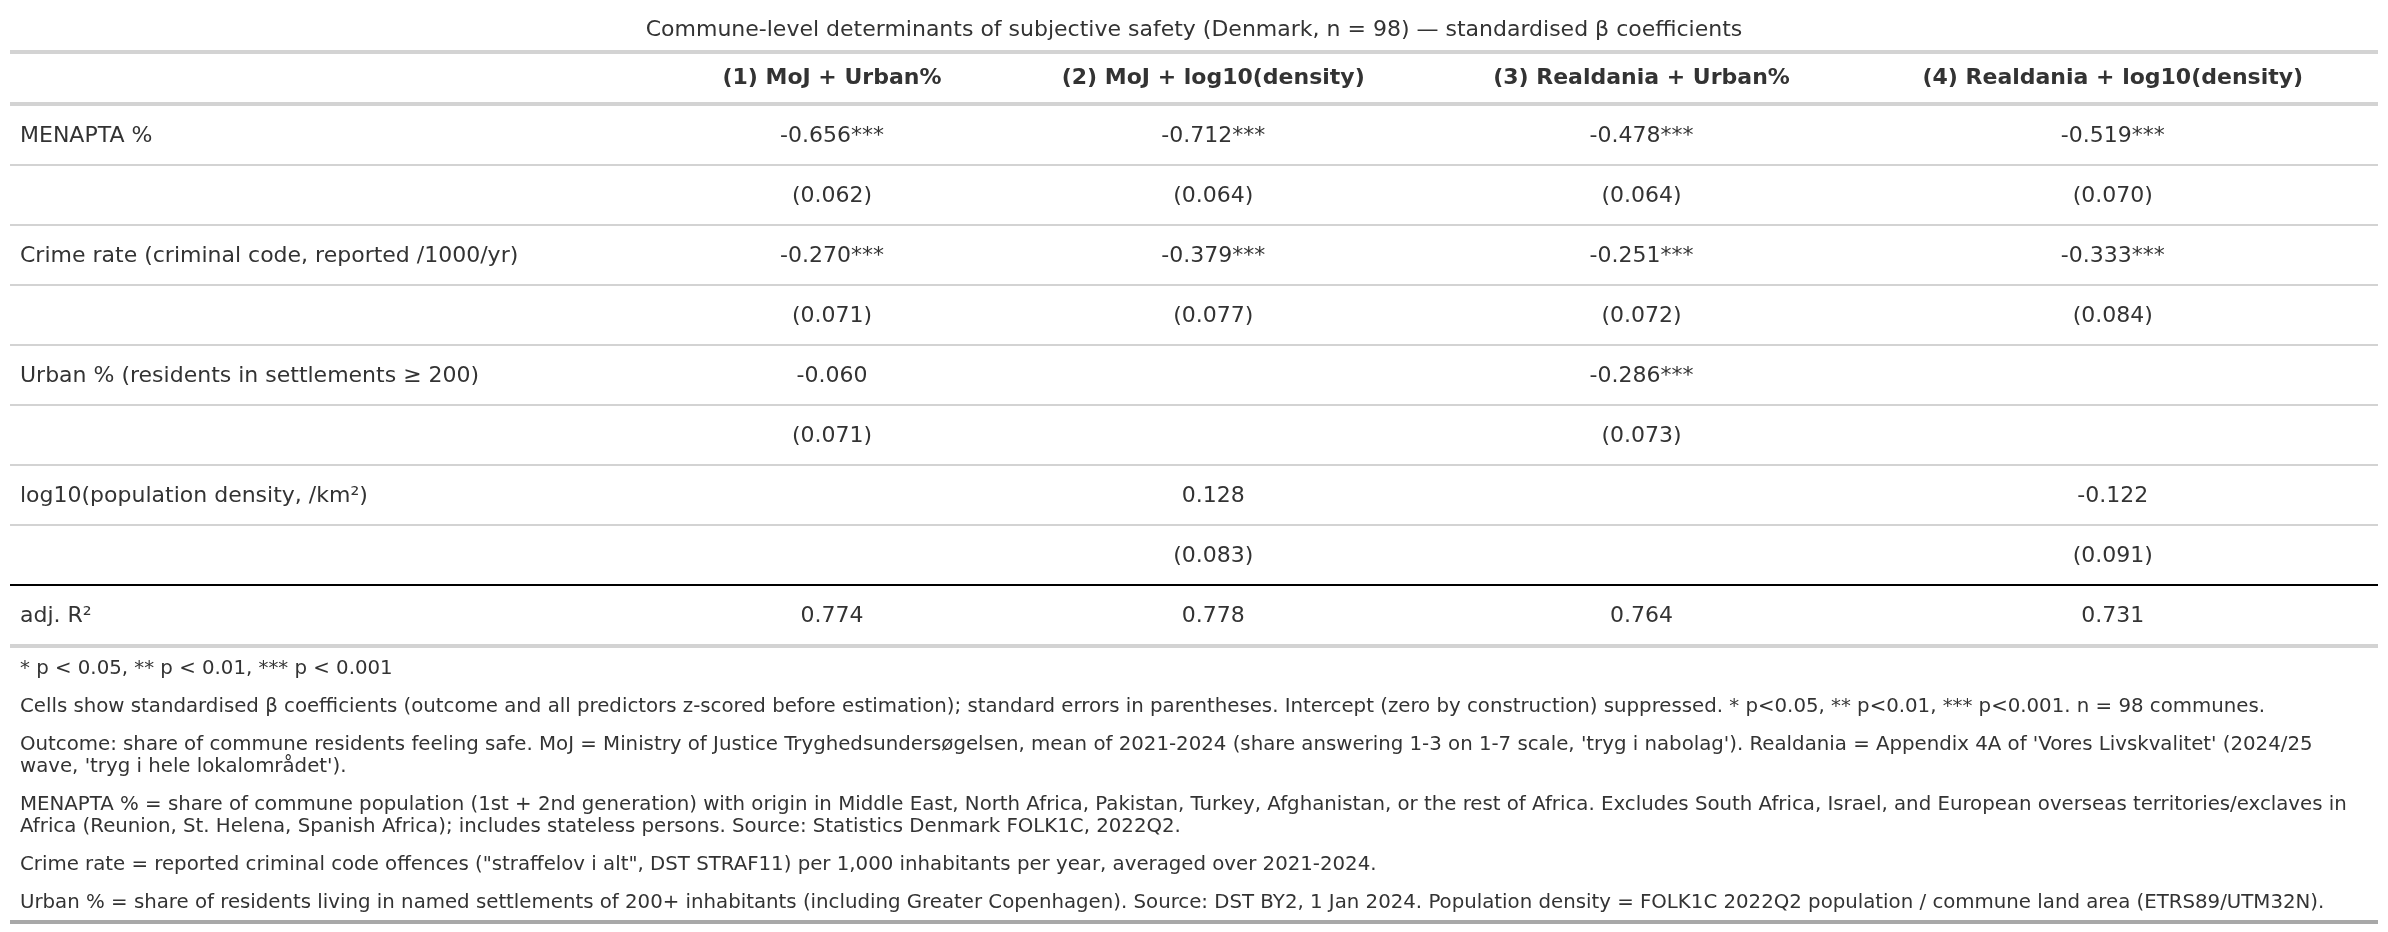
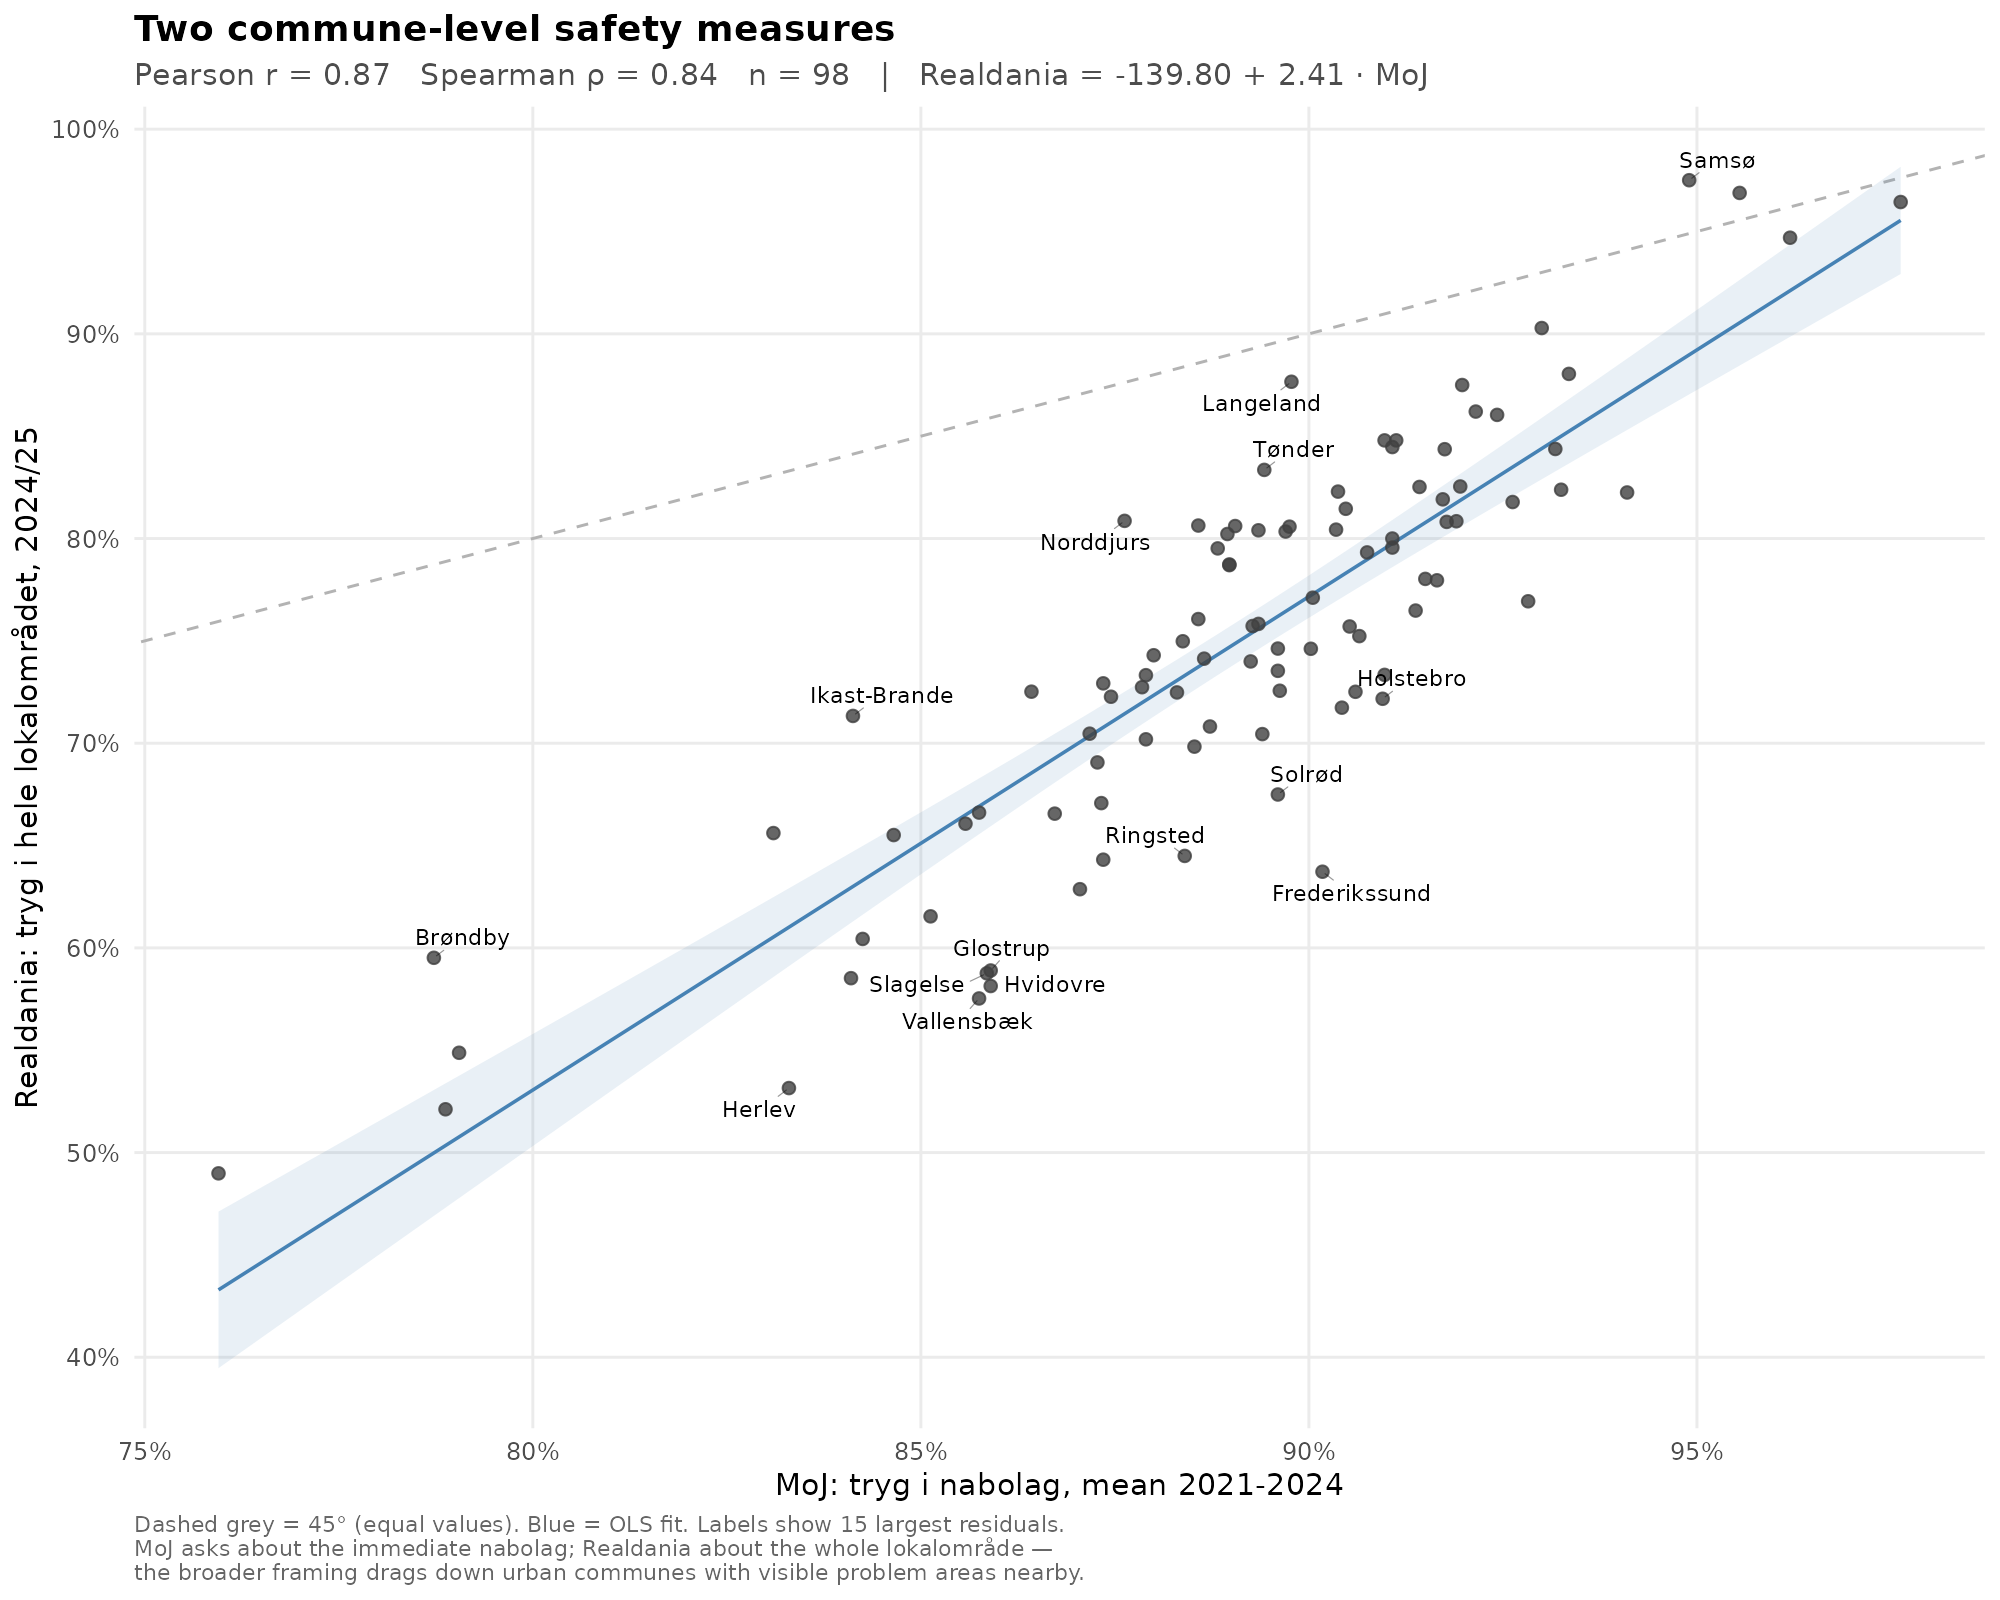
Using either urbanization (% of population living in settlements of 200+ people) or population density does not materially change the results for MENAPTA% as a predictor. They are weaker using the Realdania dataset, perhaps because they asked a different safety question:
MOJ: “Now a question about fear of crime. On a scale from 1–7 [...], how safe or unsafe do you feel? By ‘neighbourhood’ we mean the area immediately surrounding your residence.”.
Realdania: “Are there places in your local area where you avoid going after nightfall because you feel unsafe?” % answering “No, I feel safe in the whole local area”.
The MOJ variable is more reliable because it is based on 4 years of data versus a single year for Realdania. These two measures are very strongly correlated:
Using regression models assumes a simple causal structure of the data in the form of effect <- cause1 + cause2 + cause3 + cause.... In real life we know that a more plausible causal model is like this:
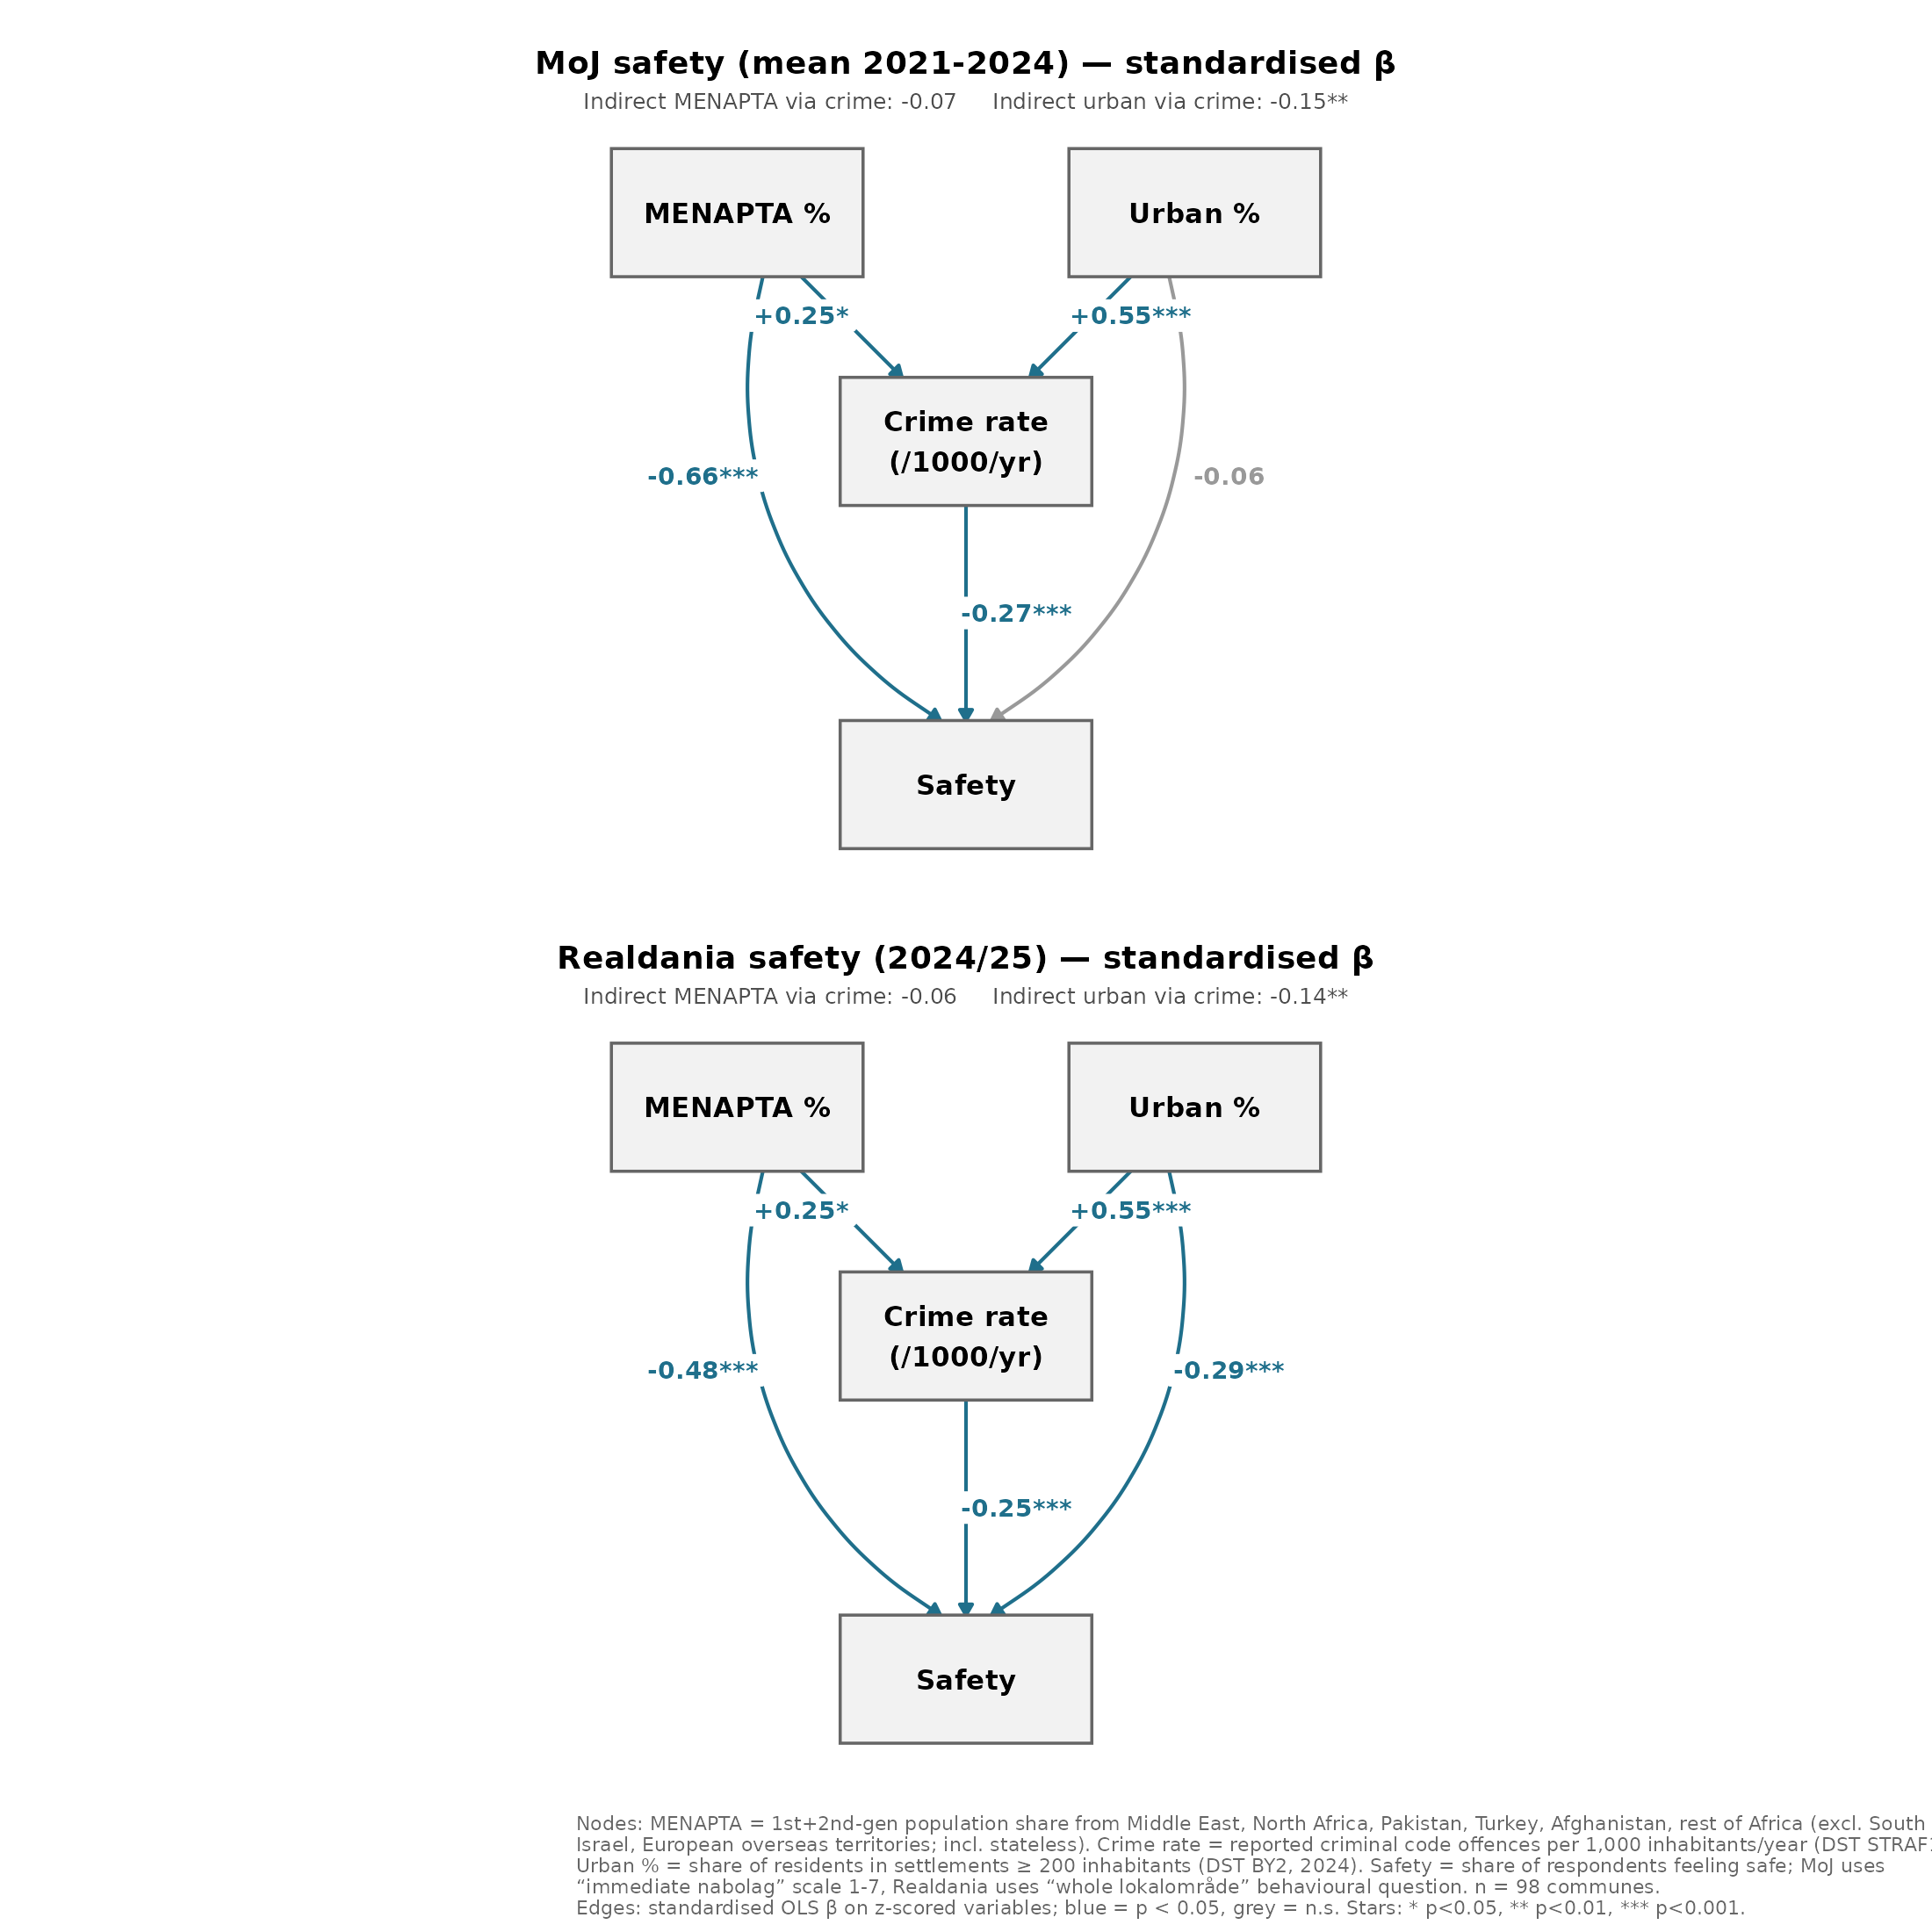
In this way, we can see that given this plausible causal model, the effect of MENAPTA on subjective safety is ~90% direct, not mediated by the crime rate. This may be somewhat puzzling. If people’s feelings of safety relate to reality, they should also mainly be a function of antisocial behavior as proxied by the crime rate. This could be because 1) some crime or antisocial behavior is not captured by the crime rate e.g. under-reporting, ‘new normal’, or behavioral adaptation (you don’t feel unsafe because you no longer think about walking home alone at 2 am), or 2) these peoples just feel less safe in general and the effect we see is mainly a composition effect. Prior research has frequently found that such compositional effects are large. Whites in USA report higher interpersonal trust levels no matter where they live. One review included this summary:
Studies of trends reveal significant ethnoracial gaps in trust (Smith 1997, Patterson 1999, Alesina & La Ferrara 2002, Uslaner 2002). For instance, Smith (1997) finds that members of minority groups report substantially more misanthropy (less trust) than members of the majority. Among the 40 ethnic groups studied, misanthropy was highest among blacks. In descending order, they were followed by Asians, Amerindians, Hispanics from Spanish-speaking countries, more recent European immigrants from Southern and Eastern Europe, and middle European immigrants from countries such as France, French Canada, Germany, and Ireland. Misanthropy was lowest among descendants of early European immigrants from Scandinavia and Great Britain.
...
Here again, Uslaner (2002) illustrates the point well. Among those who have attended high school, 41% of whites report trusting others, compared with just 13% of blacks. Among those who attended or graduated college, 55% of whites compared with just 22% of blacks reported trusting others. Inconceivably, trust among the wealthiest blacks was similar to levels of trust expressed by the poorest whites (also see Patterson 1999).
The blue-eyed and naive Nord stereotype.
(R notebook, OSF repo.)
Data from gallup shows the Middle east reporting high levels of feeling safe, almost equal to Europe (the gulf countries are even higher than Europe)
https://www.gallup.com/analytics/356996/gallup-global-safety-research-center.aspx
Looking at crimes too and reported happiness... (and since crime is about policy and personal predisposition), this seems to mean middle eastern countries and especially the gulf countries are the best at policy and laws
Arab-Berber (and African) societies are culturally characterised by mistrust, not to say a form of paranoia. This is particularly evident in beliefs about the evil eye, the ‘jnoun’, and so on, which treat every other person as a potential enemy. This has a significant impact on social and interpersonal relationships; for example, one should never pay a compliment, as this attracts the evil eye...