

I’ve researched the outcomes of migrants by country of origin in many studies and posts, but now with the power of AI, I’ve been quickly able to compile all of them into a single coherent database as well as add many new ones. These are presented on a new page at https://emilkirkegaard.dk/migration/. You can explore all the results, look at the plots, find sources, and download the data for your own analyses.
The working model for this kind of work is that a simplified model of human inequality approximately holds. In this model, every group of people has a distribution of and thus also an average value for human capital traits, chiefly but not exclusively intelligence. These distributions are primarily caused by genetic differences, as in, (true) polygenic scores (genetic potential) for the relevant traits. When people move around, they keep this genetic value, and this is true also for groups. In recent history (<100 years), the values are approximately constant though not in the more distant past (100 or 1000s of years). Thus, the basic prediction here is that if we can estimate this average human capital of particular groups, this should predict their performance when they move (migrate) or mix with others. Here one must take into account selection effects, that is, that migrants are not necessarily and not generally representative of the home habitat/country in these human capital traits. Thus, it is necessary to measure such selection effects. Following the initial work by the IAB on their brain drain dataset, I’ve used completed formal education level as a proxy for this. These estimates were generally obtained from ‘microdata’ (individual data) that were matched with the same cohort and age group at home (insofar as possible), counting only migrants who arrived as adults (25+), so that degrees earned in the host country are not counted. Thus, if a population at home has e.g. 10% of people with university degrees, but 70% of migrants have this, then they are very selected. The most selected corridors are:
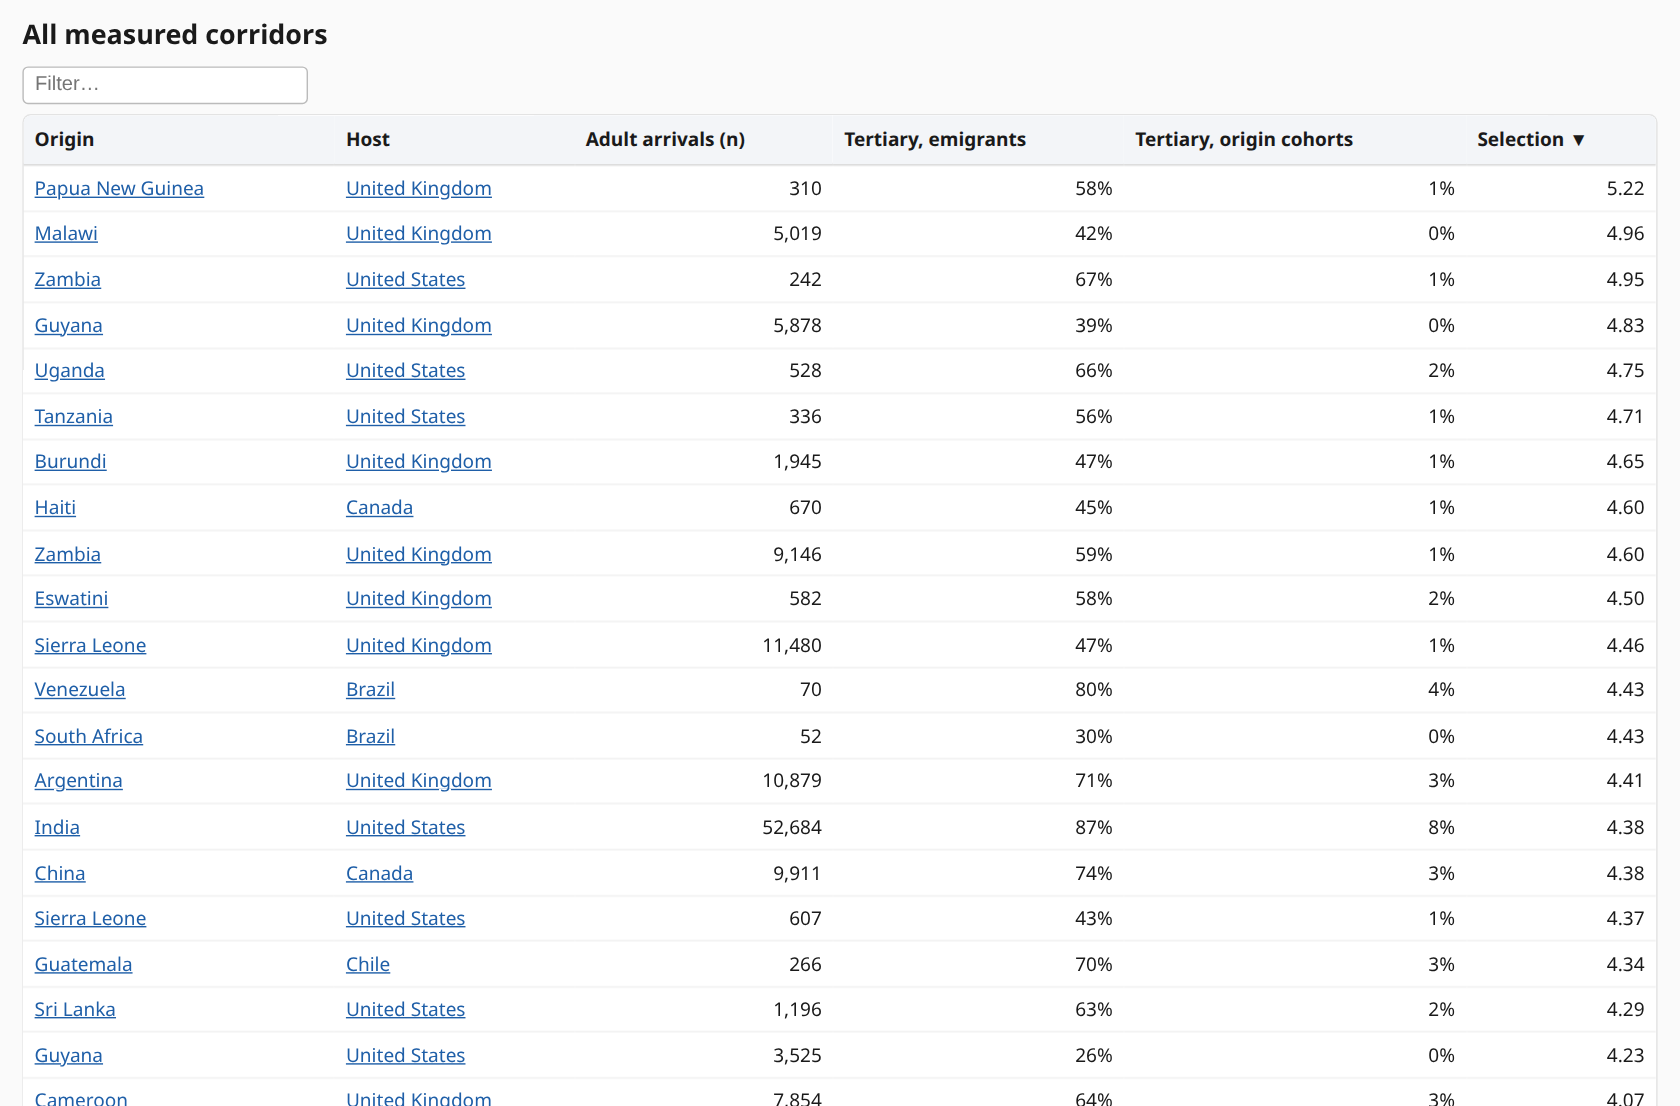
Extreme selection is mostly seen for very poor origin countries, which is only logical, since the lower the education level in the origin, the larger the difference can be. Many poor countries have university degree rates in single digits, but manage to send people to the west with 50%+ such degrees. They are educating only a few people in university, and large numbers of them are leaving. People who are high human capital but leave their countries before taking education would thus generally be misestimated.
This kind of way of measuring selection only works for adults with completed education, a major limitation, so take it as a rough proxy and nothing more. It is possible to genetically measure the selection effects by comparing home/representative samples to migrant samples, though this has never been done systematically to my knowledge. This is generally because samples are too small or the current polygenic score estimates too imperfect (especially for non-Europeans). Performance of a given group in some host country is measured using whichever available social and cognitive data including employment rate, income, educational attainment, cognitive scores (e.g. PISA), crime, and social welfare use. Prior research has shown that it is not generally important which specific metric is used since the groups rank about the same across them. This working model is not entirely true, especially because some social metrics are strongly affected by age/sex composition (e.g. crime), time in the country, language/cultural distance (e.g. test bias). Thus, it is preferable to study 2nd and later generations. The problem with those data is in general that many countries do not provide useful data. This is especially true for people who change their citizenships, and children from mixed relationships (e.g. German mother, Spanish father). I have been inclusive and also used data based on citizenship when country of birth or parental country of birth was not available. This causes some biases since naturalization rates differ by group systematically: people from worse countries are more eager to convert to a new superior citizenship, especially because it generally means they cannot be deported (so easily). Countries also differ in how easy it is to obtain these citizenships (e.g. automatic at birth for many New World countries), which further adds noise and bias to the results. With these issues in mind, we don’t expect perfect results and neither do we find them.
So the basis of the analysis as of writing are data from these 34 host countries:
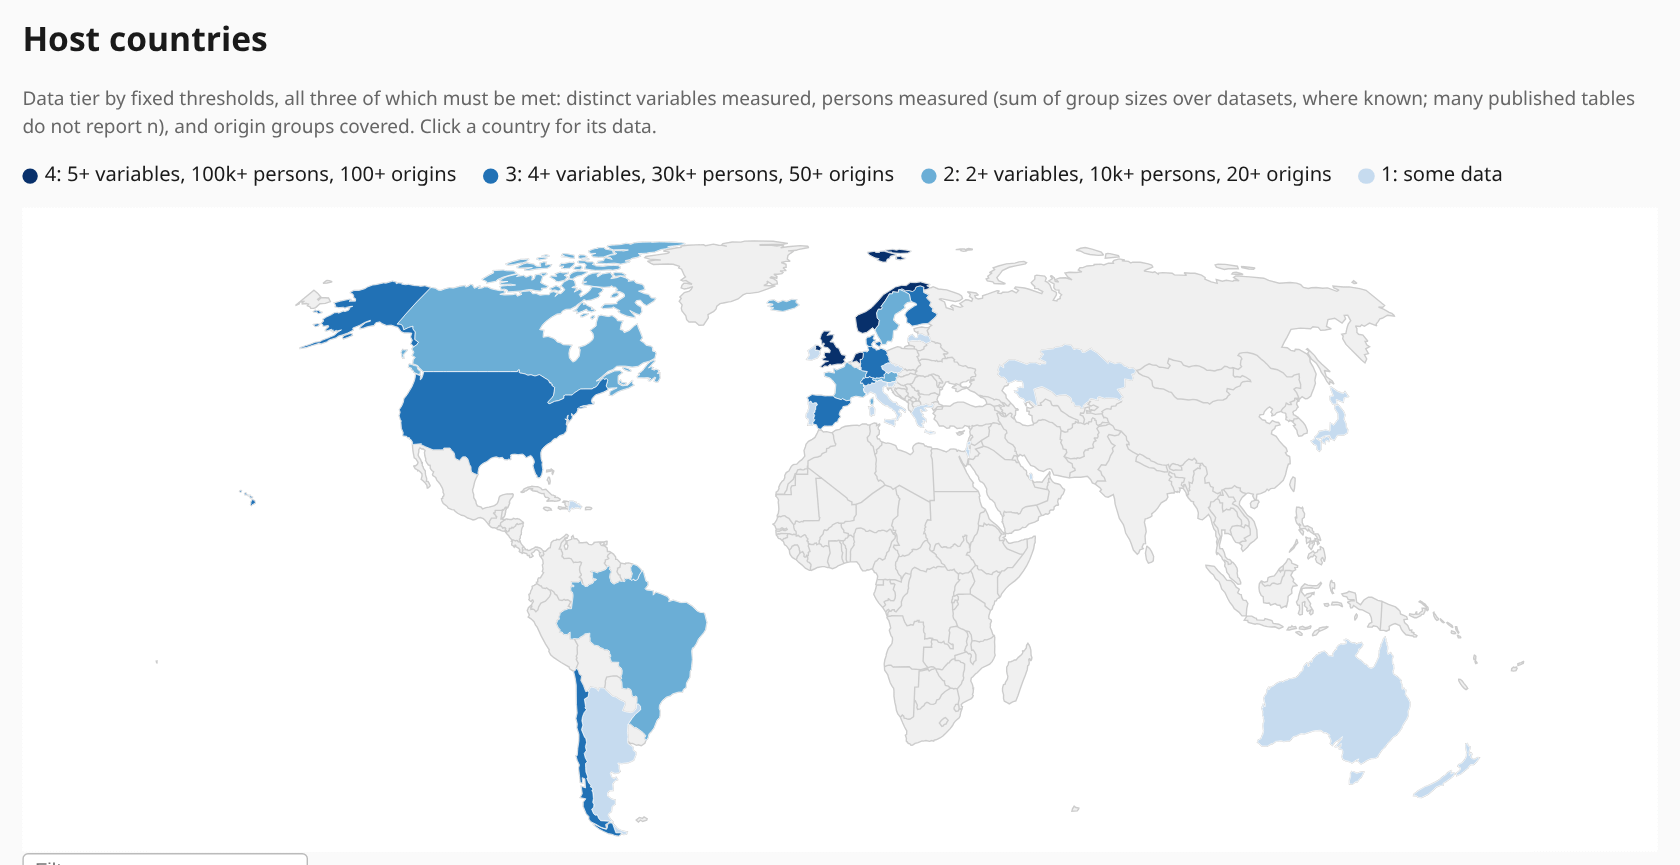
They are color coded by how much and how useful data they provide. In general, larger countries provide estimates for more origin groups owing to larger migrant populations. Countries with better government databases provide more data, insofar as the results aren’t completely censored/hidden. I have mostly obtained results from Western countries because these have high rates of immigration in the last few decades as well as useful public data. It’s possible there are more useful data to be found in e.g. Thailand. Belgium was the only western country I was unable to find any useful results for, perhaps a reader can find something.
The overall results for the origin countries should under the working model reflect the average human capital in the people from those countries, and the map we get looks like this:
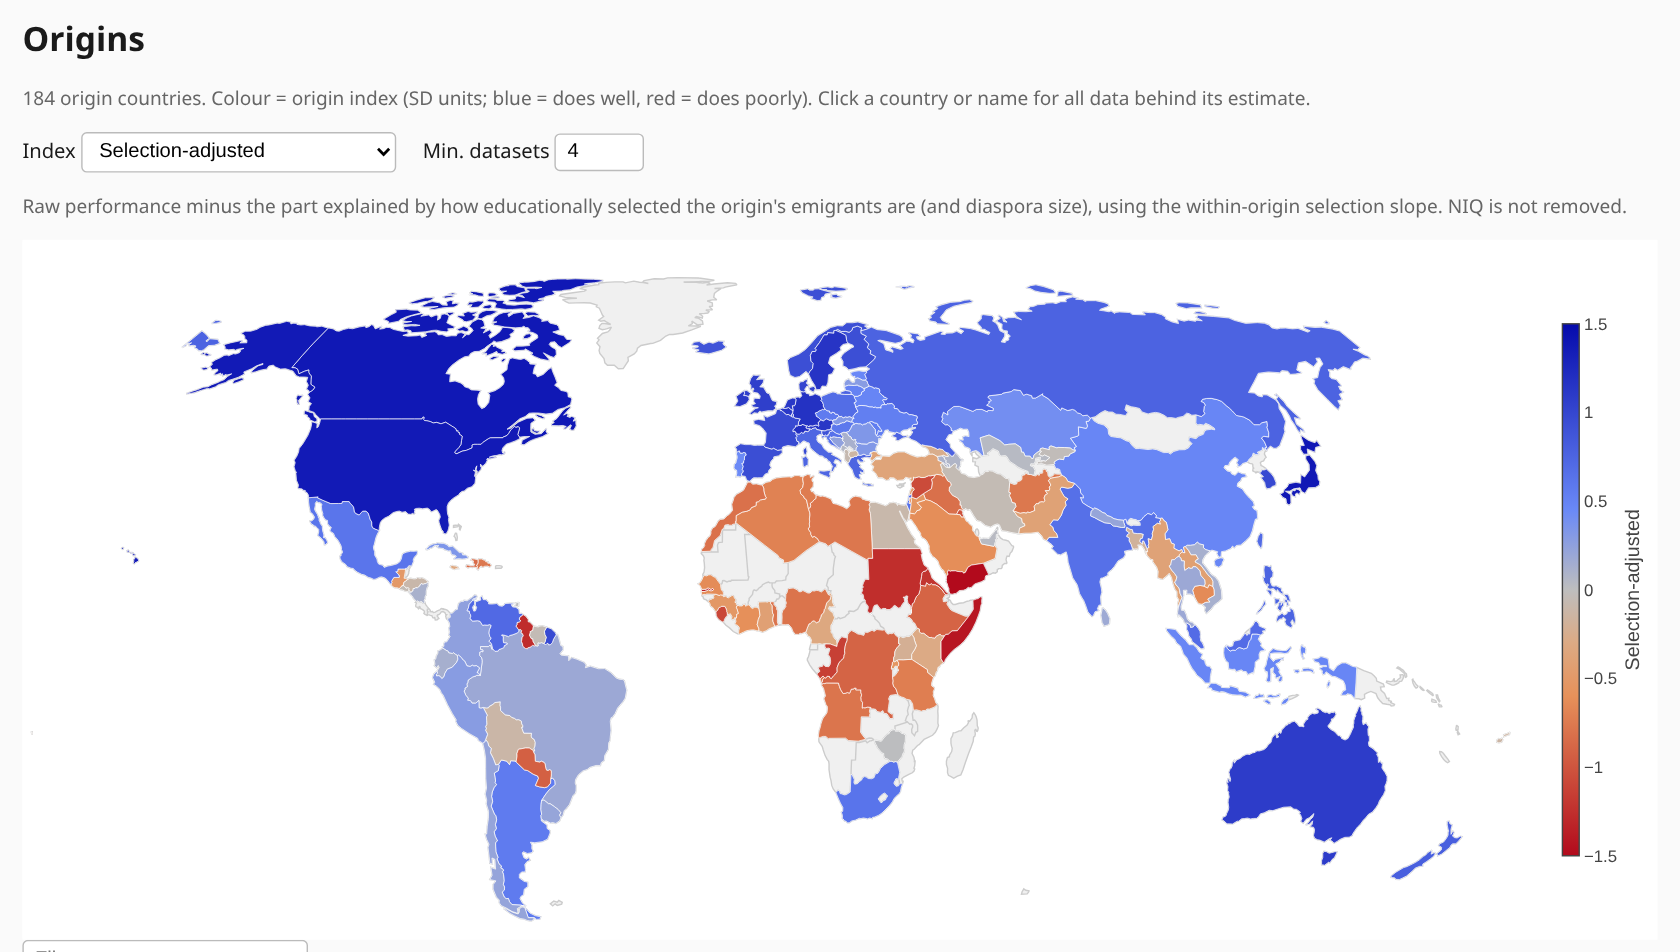
Thus, it looks about the same as every other such map. Even after adjustment for observed migrant selection, Mexicans, South Africans, Indians do fairly well. You can click any country to see what data the results are based on. E.g., for Mexico:
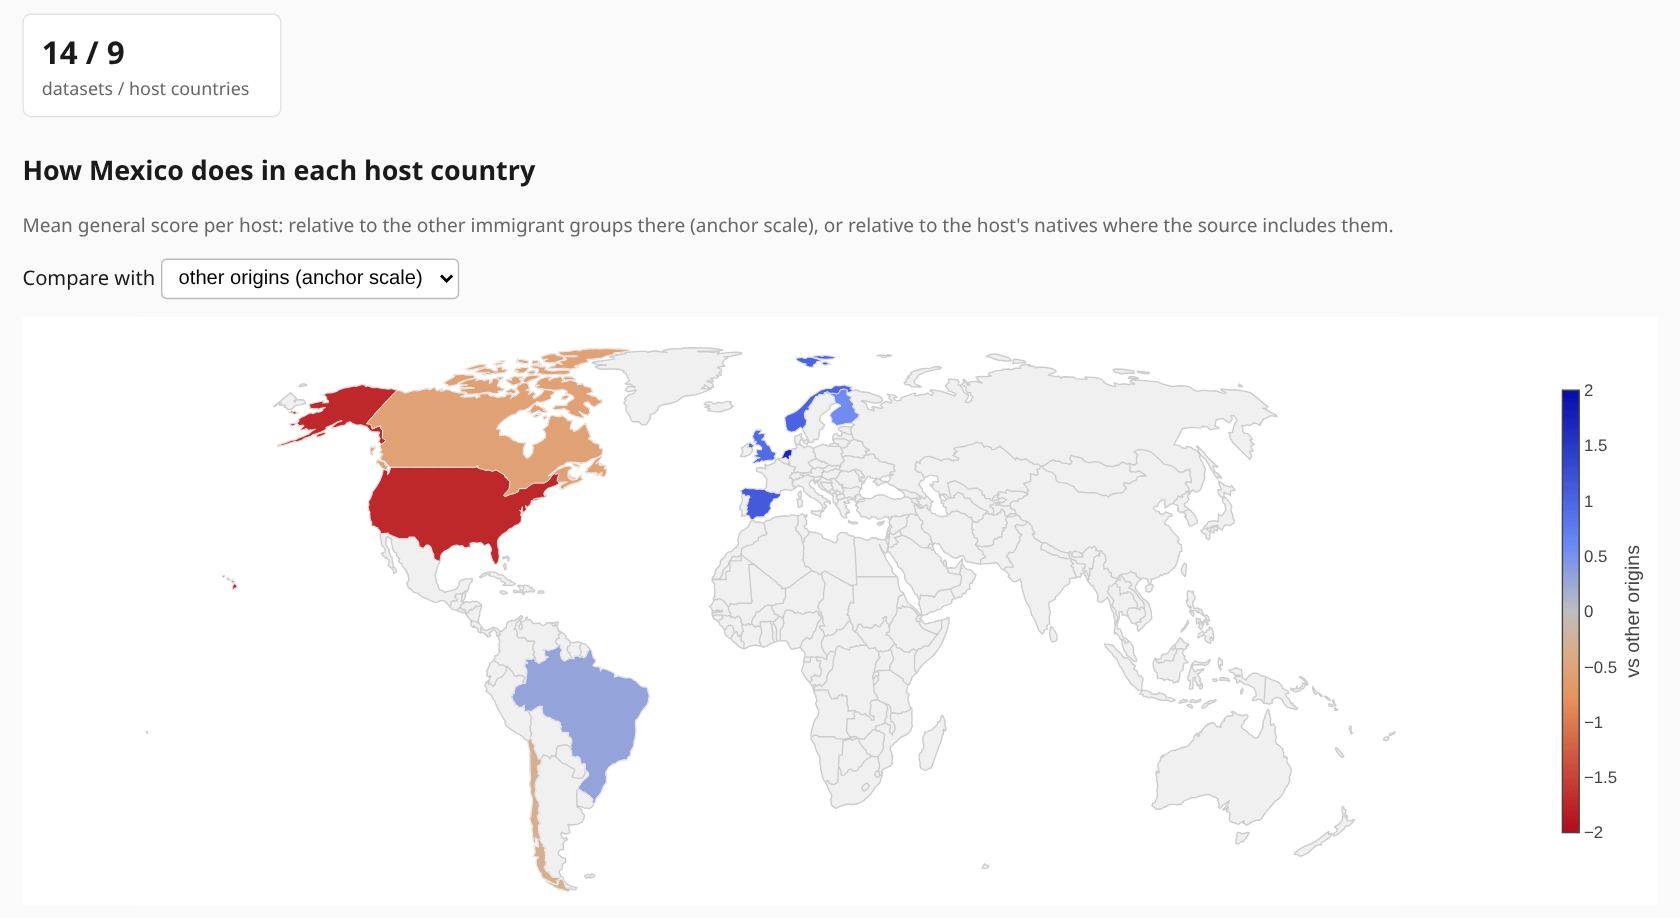
So we can see that Mexicans don’t do well in USA or Canada, but do well in Europe. If you check migrant flows, something like 95% of all Mexican migrants live in the USA and are relatively unselected. A small number are in Europe, much more selected with resulting good outcomes. Depending on how you weight the results, Mexicans thus may obtain a large negative (if using migrant size weights), or somewhat to strongly positive score (if no weights). The overall models change somewhat depending on the weights, but not in a consistently obviously better direction, so I’ve used a middling approach to weights.
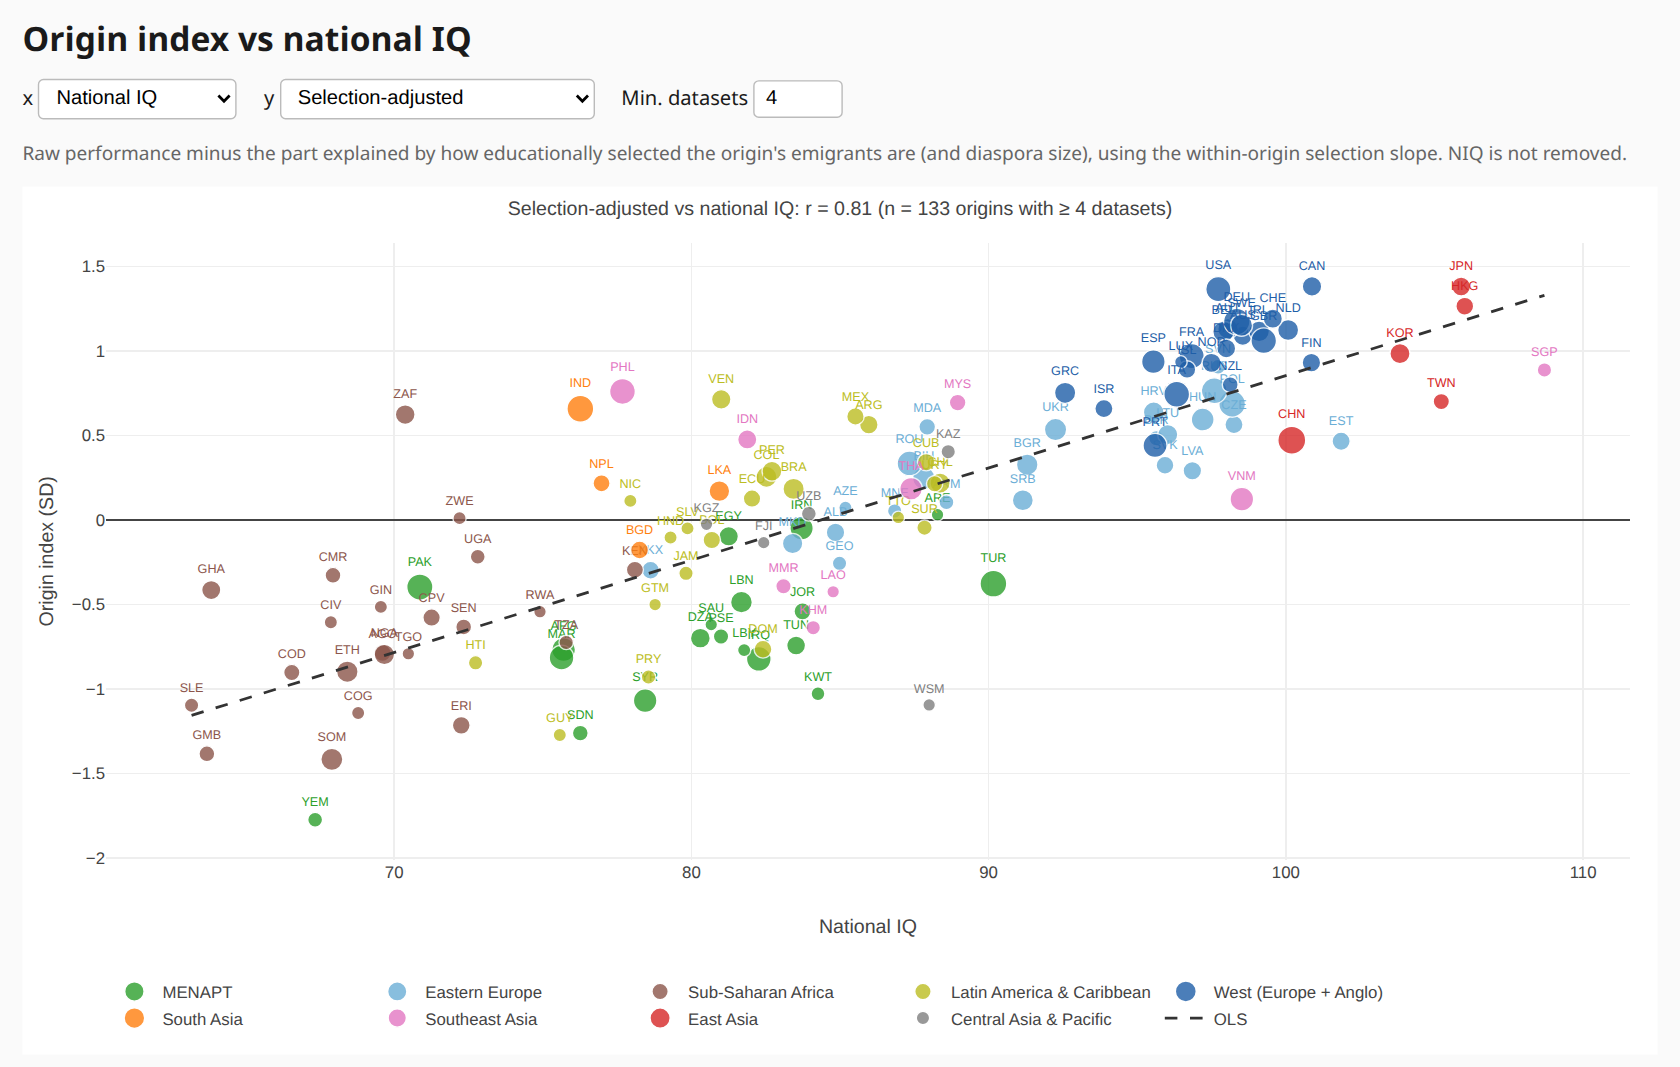
If we take the current ‘best estimate’ for each origin group and correlate it with national IQs (the best human capital measurement) or home country general development (HDI but better), we get:
And:
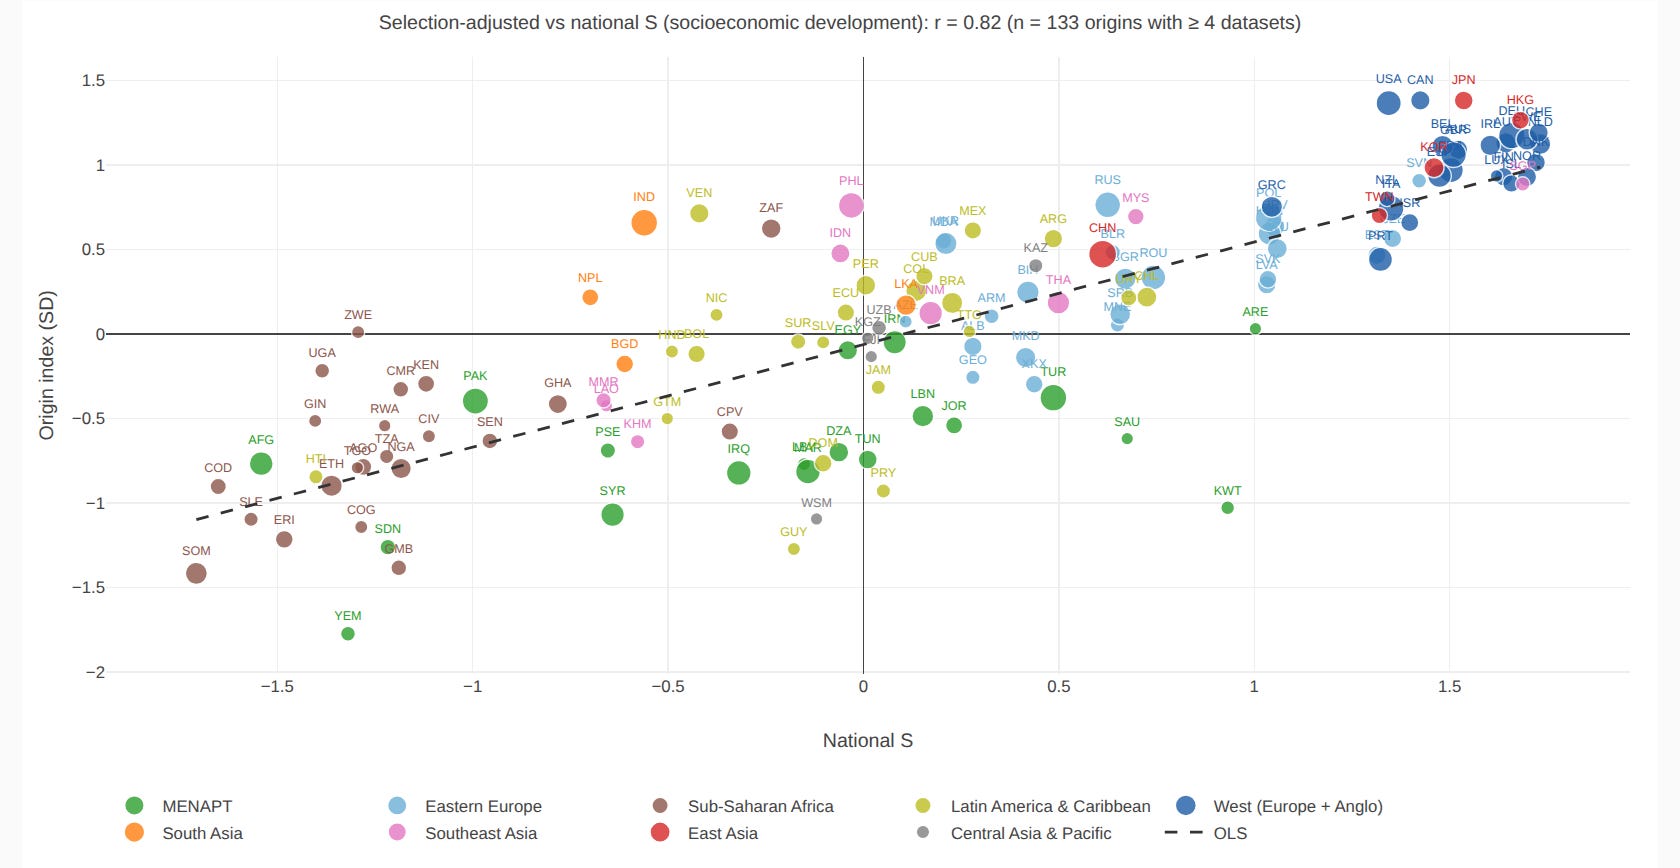
Thus, the main prediction of the working model is seen in the data. Results are not perfect, of course, given all the issues with the data quality, measurements, time-in-country, cultural/language biases in tests, and imperfectly modelled selection effects. But they are pretty good and compelling. Now no one can credibly claim that origin country metrics do not predict migrant outcomes consistently.